


 mathematics
Similar presentations:

")
")


")
")


Common Probability Distributions
1. Common Probability Distributions
By Dias Kulzhanov2. DISCRETE RANDOM VARIABLES
• A discrete random variable can take on at most a countable number ofpossible values. For example, a discrete random variable X can take on a
limited number of outcomes x1, x2, …, xn (n possible outcomes), or a
discrete random variable Y can take on an unlimited number of outcomes
y1, y2, … (without end).1 Because we can count all the possible outcomes
of X and Y (even if we go on forever in the case of Y), both X and Y satisfy
the definition of a discrete random variable
• We can view a probability distribution in two ways:
1. The probability function specifies the probability that the random variable
will take on a specific value. The probability function is denoted p(x) for a
discrete random variable and f(x) for a continuous random variable. For
any probability function p(x), 0 ≤ p(x) ≤ 1, and the sum of p(x) over all
values of X equals 1.
2. The cumulative distribution function, denoted F(x) for both continuous and
discrete random variables, gives the probability that the random variable is
less than or equal to x.
3. The Discrete Uniform Distribution
• The discrete uniform and the continuous uniform distributions arethe distributions of equally likely outcomes.
The Binomial Distribution
• The binomial random variable is defined as the number of successes
in n Bernoulli trials, where the probability of success, p, is constant
for all trials and the trials are independent. A Bernoulli trial is an
experiment with two outcomes, which can represent success or
failure, an up move or a down move, or another binary (two-fold)
outcome.
4.
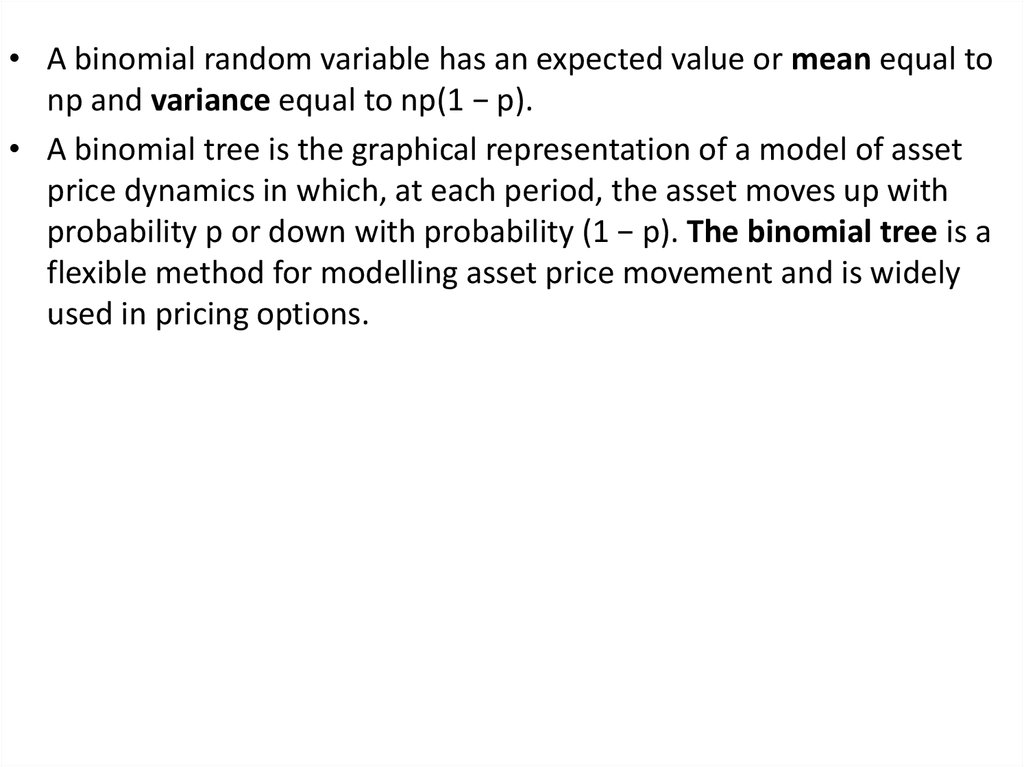
• A binomial random variable has an expected value or mean equal tonp and variance equal to np(1 − p).
• A binomial tree is the graphical representation of a model of asset
price dynamics in which, at each period, the asset moves up with
probability p or down with probability (1 − p). The binomial tree is a
flexible method for modelling asset price movement and is widely
used in pricing options.