


 electronics
Similar presentations:


")


")
Samsung Electronics
1.
Samsung Electronics Co., LtdSamsung Electronics Co., Ltd
Presented by
YongHyun Kim
Finance, 161
Higher School of Economics , Saint-Petersburg, 2017
www.hse.ru
2.
The history of Samsung Electronics Co., LtdSamsung Electronics Co., Ltd. (Korean: 삼 성 전 자 ; Hanja: 三 星 電 子
(Literally "tristar electronics")) is a South Korean multinational electronics
photo
company headquartered in Suwon, South Korea. Through extremely
complicated ownership structure with some circular ownership, it is the
flagship division of the Samsung Group, accounting for 70% of the group's
revenue in 2012. It is the world’s 2nd largest information photo
technology
company by revenue, after Apple. Samsung Electronics has assembly
plants and sales networks in 80 countries and employs around 370,000
people. Since 2012, Kwon Oh-hyun has served as the company's CEO.
photo
Higher School of Economics , St. Petersburg, 2017
2
3.
The history of Samsung Electronics Co., LtdSamsung Electronics Co., Ltd. Samsung has long been a major
manufacturer of electronic components such as lithium-ion batteries,
semiconductors, chips, flash and hard drive devices for clients
such as
photo
Apple, Sony, HTC and Nokia.
It is the world's largest manufacturer of mobile phones and smartphones
fueled by the popularity of its Samsung Galaxy line of devices. The
company is also a major vendor of tablet computers, particularly its
Android-powered Samsung Galaxy Tab collection, and is generally
photo
regarded as pioneering the phablet market through the Samsung
Galaxy
Note family of devices.
Samsung has been the world’s largest TV manufacturer since 2006, and
the world's largest manufacturer of mobile phones since 2011. Samsung
Electronics is a major part of the South Korean economy; in 2012 it was
responsible for 20% of GDP.
photo
Higher School of Economics , St. Petersburg, 2017
3
4.
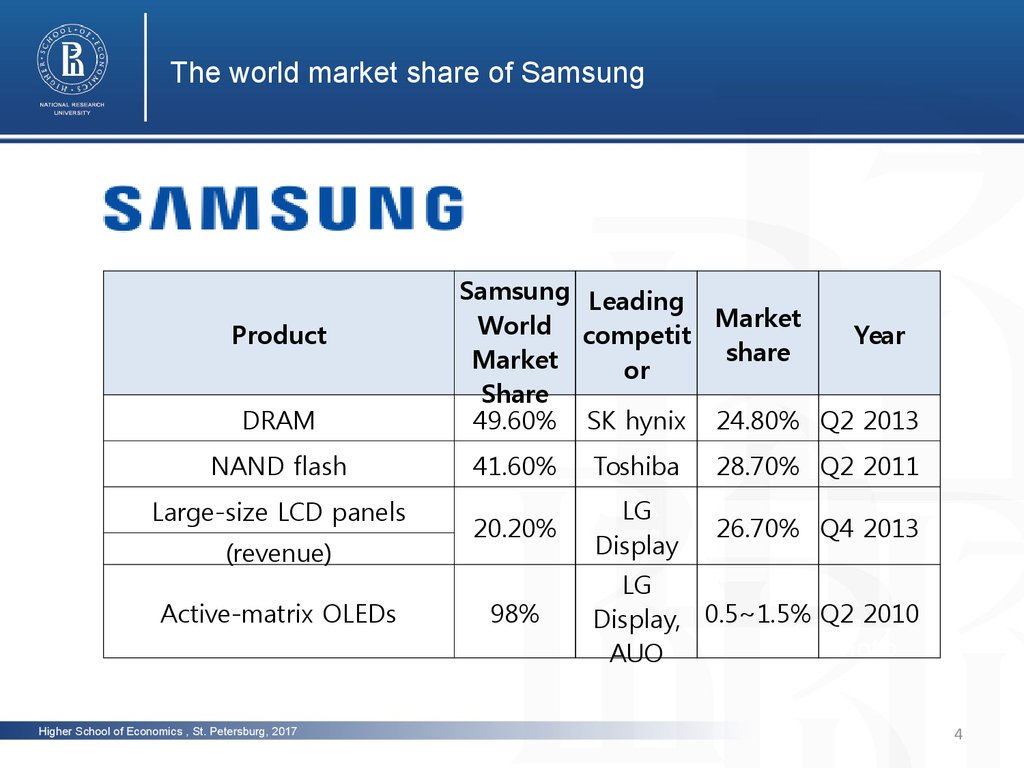
The world market share of SamsungProduct
DRAM
NAND flash
Large-size LCD panels
(revenue)
Active-matrix OLEDs
Higher School of Economics , St. Petersburg, 2017
photo
Samsung Leading
World competit Market
Year
share
Market
or
Share
49.60% SK hynix 24.80% Q2 2013
41.60%
Toshiba
photo
28.70% Q2
2011
20.20%
LG
Display
26.70% Q4 2013
98%
LG
Display, 0.5~1.5% Q2 2010
photo
AUO
4
5.
The world market share of Samsungphoto
LCD monitors
18%
Hard-disk drives
9%
LG
12.70%
Electronic
Western
Digital
2010
31.30%
Q1 2010
photo
24%
LG
14.70%
Electronic
Q2 2010
Mobile phones
34%
Apple Inc. 13.40%
Digital cameras
11.80%
Televisions
(LCD, PDP, CRT, LED)
Higher School of Economics , St. Petersburg, 2017
Sony
Q3 2013
17.40% photo
2010
5
6.
The Index of Investmentphoto
(unit: billions Won, IFRS)
2015
2016
2017E
2018E
Sales
200,653
201,867
229,701
236,822
Operating profit
26,413
29,241
46,886
EBITDA
47,344
49,954
68,210
48,576
photo
69,964
Profit before tax
25,961
30,714
48,085
49,584
Net Profit
19,060
22,726
35,583
36,692
EPS(Won)
125,750
158,044
255,012
Increase ratio(%YoY)
-19.0
24.5
60.0
268,268
photo
4.9
Higher School of Economics , St. Petersburg, 2017
6
7.
The Index of Investmentphoto
(unit: billions Won, IFRS)
2015
2016
2017E
2018E
PER
10.0
11.4
7.1
6.7
PBR
1.2
1.6
1.3
EV/EBITDA
3.3
4.3
3.1
2.6
Profit ratio(%)
13.2
14.5
20.4
20.5
ROE(%)
11.0
12.2
17.1
15.3
Net debt ratio(%)
-32.7
-37.8
-36.7
-42.2
photo
Higher School of Economics , St. Petersburg, 2017
1.1
photo
7
8.
Analysis of business divisionsSamsung Electronics
Semi-Conductor
Display
Panel
IT & Mobile
operating profit
7.5 trillion won,
consisting of 65
% of total
operating profit
selling 8.4 trillion
won(+15%QoQ),
operating profit
1.3 trillion
won(+0.4%QoQ)
selling
25.6trillion
Won(+9%QoQ),
Operating profit
2.4trillion
Won(+15%QoQ)
Higher School of Economics , St. Petersburg, 2017
Consumer
Electronics
Selling 11.5trillion
Won(+11%QoQ),
Operating profit
0.4trillion
Won(+11%QoQ)
9.
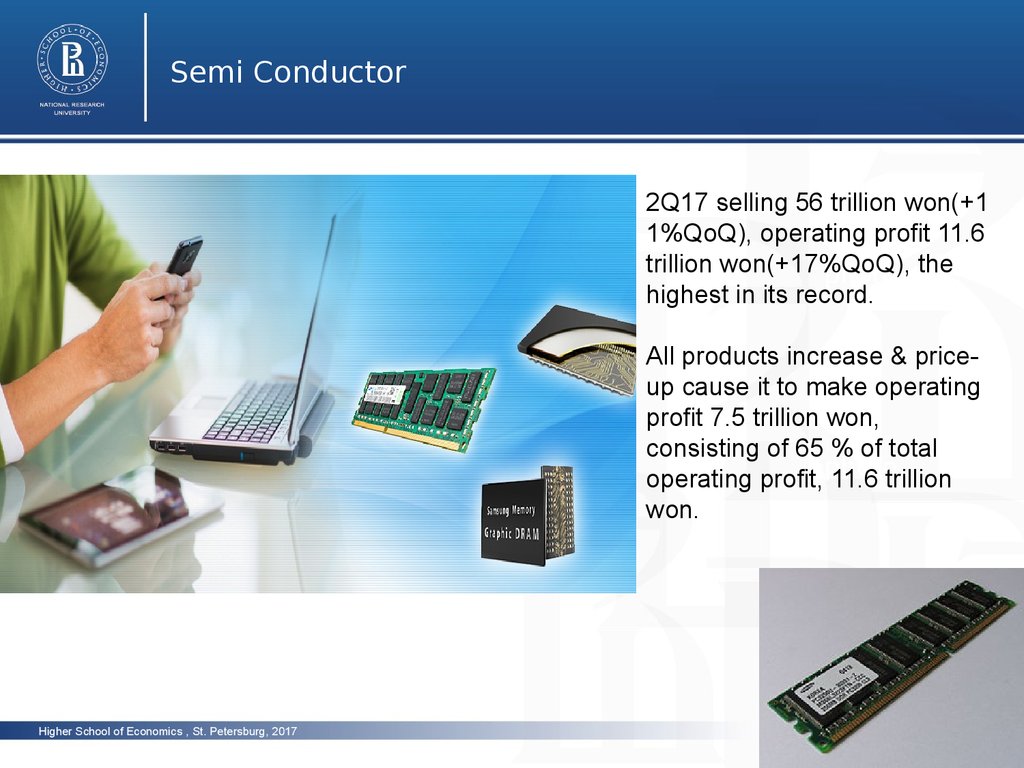
Semi Conductor2Q17 selling 56 trillion won(+1
1%QoQ), operating profit 11.6
trillion won(+17%QoQ),
photo the
highest in its record.
All products increase & priceup cause it to make operating
profit 7.5 trillion won,
consisting of 65 % of total
operating profit,photo
11.6 trillion
won.
photo
Higher School of Economics , St. Petersburg, 2017
9
10.
Display PanelThe Samsung Galaxy S II, which incorporates a Super AMOLED Plus screen
Selling 8.4 trillion
won(+15%QoQ), operating profit
1.3 trillion won(+0.4%QoQ)
photo
Flexible OLED is main product.
Operating profit is expected to
decrease -2%p because of the
increase of OLED fixed
cost & the
photo
price of LCD panel
photo
Higher School of Economics , St. Petersburg, 2017
10
11.
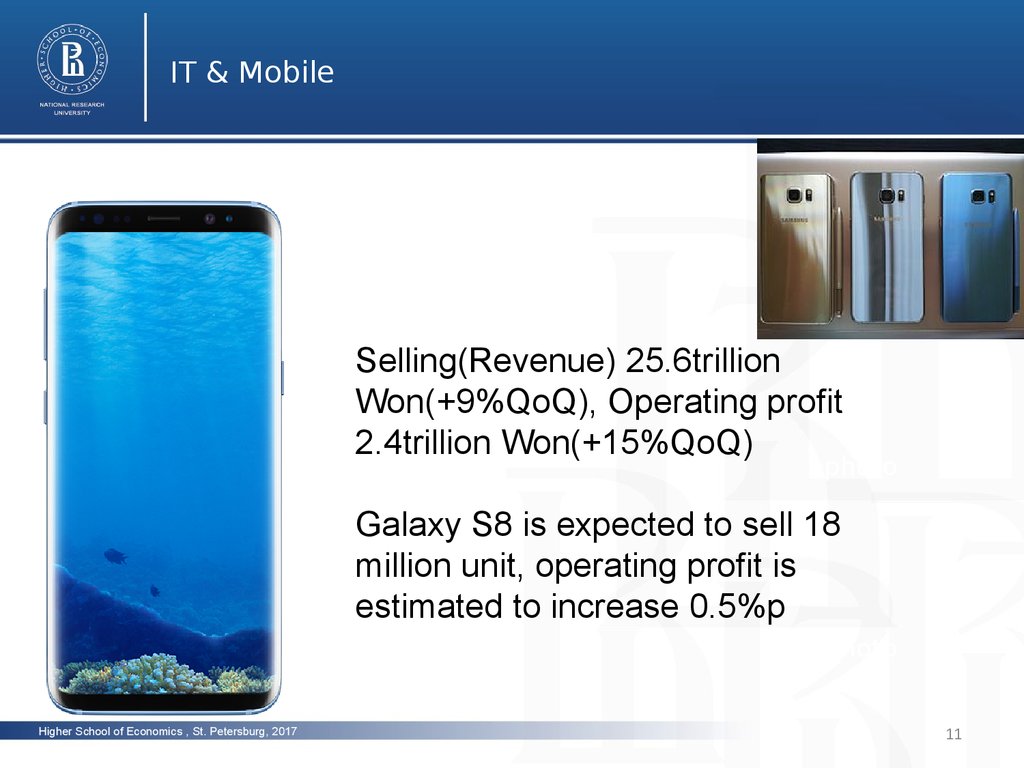
IT & Mobilephoto
Selling(Revenue) 25.6trillion
Won(+9%QoQ), Operating profit
2.4trillion Won(+15%QoQ)
photo
Galaxy S8 is expected to sell 18
million unit, operating profit is
estimated to increase 0.5%p
photo
Higher School of Economics , St. Petersburg, 2017
11
12.
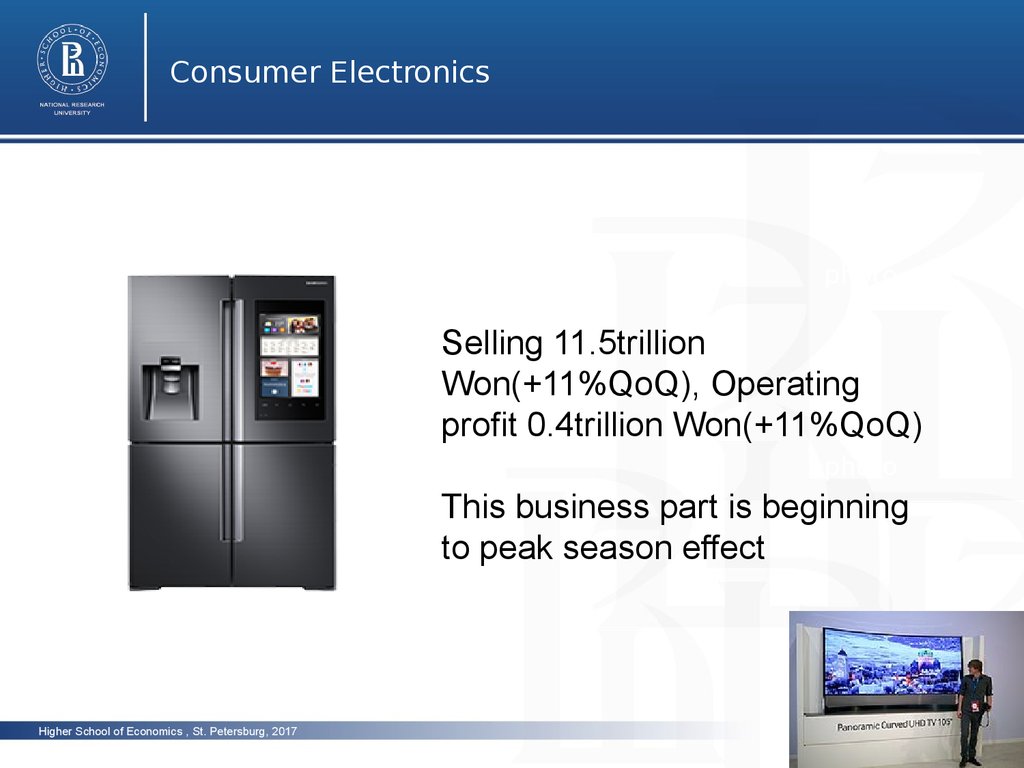
Consumer Electronicsphoto
Selling 11.5trillion
Won(+11%QoQ), Operating
profit 0.4trillion Won(+11%QoQ)
photo
This business part is beginning
to peak season effect
photo
Higher School of Economics , St. Petersburg, 2017
12
13.
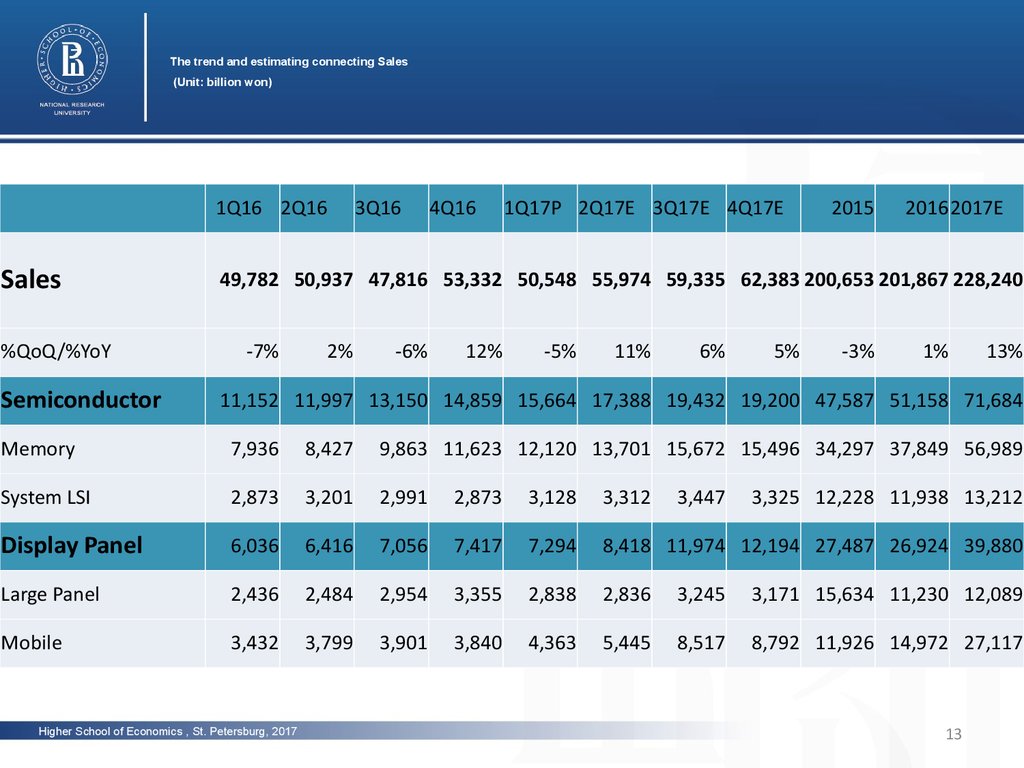
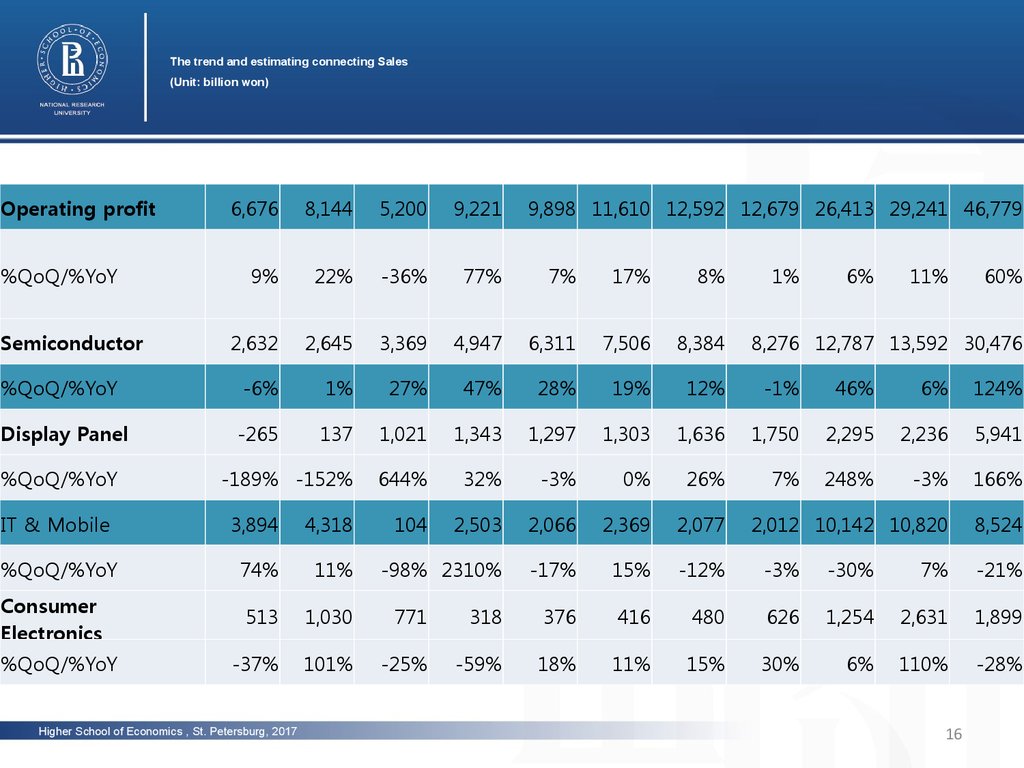
The trend and estimating connecting Sales(Unit: billion won)
1Q16 2Q16
Sales
photo
49,782 50,937 47,816 53,332 50,548 55,974 59,335 62,383 200,653
201,867 228,240
%QoQ/%YoY
Semiconductor
-7%
2%
3Q16
-6%
4Q16
12%
1Q17P 2Q17E 3Q17E 4Q17E
-5%
11%
6%
5%
2015
-3%
20162017E
1%
13%
11,152 11,997 13,150 14,859 15,664 17,388 19,432 19,200 47,587 51,158 71,684
Memory
7,936
8,427
9,863 11,623 12,120 13,701 15,672 15,496 34,297 37,849 56,989
System LSI
2,873
3,201
2,991
2,873
3,128
3,312
Display Panel
6,036
6,416
7,056
7,417
7,294
8,418 11,974 12,194 27,487 26,924 39,880
Large Panel
2,436
2,484
2,954
3,355
2,838
2,836
3,245
3,171 15,634 11,230 12,089
Mobile
3,432
3,799
3,901
3,840
4,363
5,445
8,517
8,792 11,926
photo14,972 27,117
Higher School of Economics , St. Petersburg, 2017
photo
3,447
3,325 12,228 11,938 13,212
13
14.
The trend and estimating connecting Sales(Unit: billion won)
IT & Mobile
27,600 26,559 22,543 23,611 23,482 25,565 23,367 23,882 103,554 100,313 96,296
Wireless
26,943 26,073 22,089 22,647 22,471 24,641 22,526 22,877 100,515 97,752 92,516
Network/etc
Consumer
Electronics
VD
photo
657
ratio of COGS
454
964
1,011
924
841
1,004
3,039
2,569
3,780
10,623 11,547 11,243 13,637 10,338 11,503 11,875 14,797 46,895 47,051 48,512
6,420
Cost of good
sold(COGS)
494
6,608
6,566
9,085
6,465
6,587
photo
7,016 10,148 29,219 28,678 30,217
30,374 29,609 29,411 30,883 28,161 30,166 32,138 34,555 123,482 120,278 125,021
61%
58%
62%
58%
56%
54%
54%
55%
62%
62%
photo
Higher School of Economics , St. Petersburg, 2017
14
62%
15.
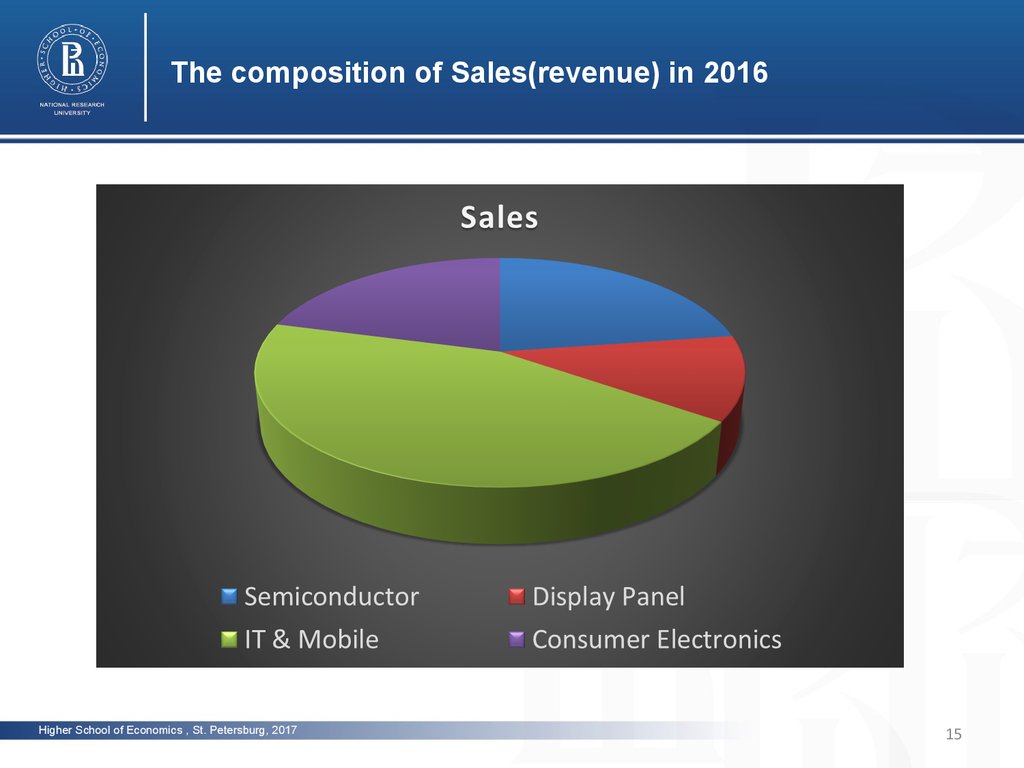
The composition of Sales(revenue) in 2016photo
photo
photo
Higher School of Economics , St. Petersburg, 2017
15
16.
The trend and estimating connecting Sales(Unit: billion won)
Operating profit
6,676
8,144
5,200
9,221
9%
22%
-36%
77%
7%
17%
8%
2,632
2,645
3,369
4,947
6,311
7,506
8,384
%QoQ/%YoY
-6%
1%
27%
47%
28%
19%
12%
-1%
46%
6%
124%
Display Panel
-265
137
1,021
1,343
1,297
1,303
1,636
1,750
2,295
2,236
5,941
-189% -152%
644%
32%
-3%
0%
26%
7%
-3%
166%
104
2,503
2,066
2,369
2,077
2,012 10,142 10,820
8,524
-98% 2310%
-17%
15%
-12%
-3%
-30%
7%
-21%
1,254
2,631
1,899
110%
-28%
%QoQ/%YoY
Semiconductor
%QoQ/%YoY
9,898 11,610 12,592 12,679 26,413 29,241 46,779
1%
3,894
4,318
%QoQ/%YoY
74%
11%
Consumer
Electronics
513
1,030
771
318
376
416
480
626
-37%
101%
-25%
-59%
18%
11%
15%
30%
Higher School of Economics , St. Petersburg, 2017
11%
60%
8,276 12,787 13,592 30,476
IT & Mobile
%QoQ/%YoY
6%
photo
photo
248%
photo
6%
16
17.
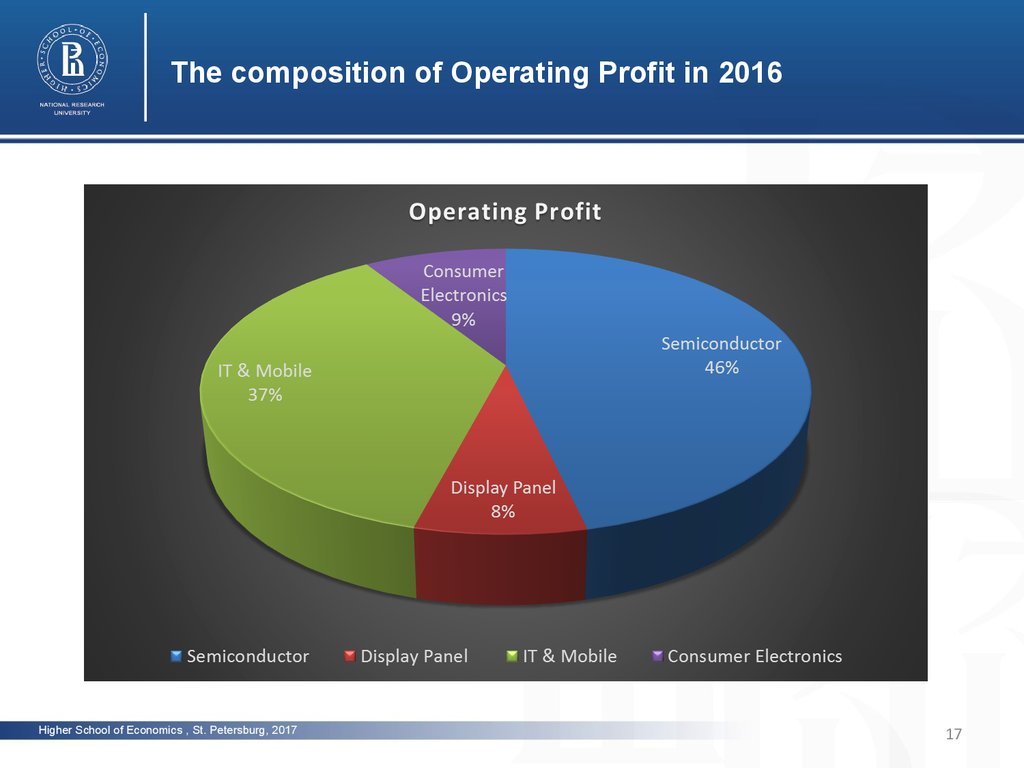
The composition of Operating Profit in 2016photo
photo
photo
Higher School of Economics , St. Petersburg, 2017
17
18.
The trend and estimating connecting Sales(Unit: billion won)
ratio of operating
profit
13%
16%
11%
17%
20%
21%
21%
20%
13%
14%
20%
IT & Mobile
14%
16%
0%
11%
9%
9%
9%
8%
photo
10%
11%
9%
Semiconductor
24%
22%
26%
33%
40%
43%
43%
43%
27%
27%
43%
Display Panel
-4%
2%
14%
18%
18%
15%
14%
14%
8%
8%
15%
5%
9%
7%
2%
4%
4%
4%
4%
3%
6%
4%
EBIT
7,122
8,072
5,971
9,549 10,165 11,891 12,976 13,030 25,961 30,714 48,061
tax
1,870
2,225
1,433
2,460
2,480
2,901
3,166
3,179
net profit
5,253
5,847
4,538
7,088
7,684
8,990
9,810
9,850 19,060 22,726 36,334
11%
11%
9%
13%
15%
16%
17%
5,092
5,966
197 13,463
7,840
Consumer Electronics
ratio of net profit
Total comprehensive
profit
Higher School of Economics , St. Petersburg, 2017
photo
16%
6,901
9%
7,988 11,727
11%
photo
16%
9,171 10,008 10,049 19,136 24,718 37,068
18
19.
The quarterly results of Sales & Net profit during 2016-2017E (unit: billion won)photo
photo
photo
Higher School of Economics , St. Petersburg, 2017
19
20.
The yearly trend of EBIT & Net Profit during 2015-2017E (unit: billion won)photo
photo
photo
Higher School of Economics , St. Petersburg, 2017
20
21.
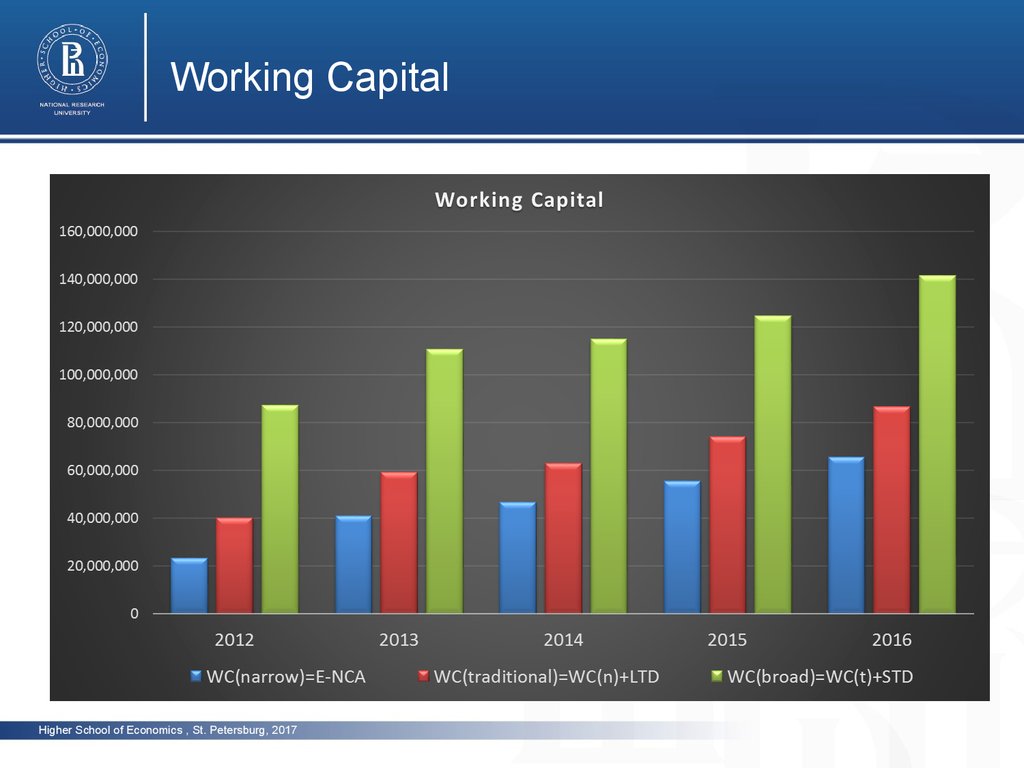
Working Capital2012
2013
(unit: million won)
2014
2015
2016
Equity
117,094,052
144,442,616
162,181,725
172,876,767
186,424,328
Non-Current
Assets
93,802,553
103,314,747
115,276,932
117,364,796
120,744,620
LTD
17,044,466
18,316,993
16,227,320
18,799,845
21,045,901
STD
46,933,052
51,315,409
52,013,913
50,502,909
54,704,095
WC(narrow)
= E-NCA
23,291,499
41,127,869
46,904,793
55,511,971
65,679,708
WC(traditional)
=WC(n)+LTD
40,335,965
59,444,862
63,132,113
74,311,816
86,725,609
WC(broad)
=WC(t)+STD
87,269,017
110,760,271
115,146,026
Higher School of Economics , St. Petersburg, 2017
photo
photo
124,814,725photo
141,429,704
22.
Working Capitalphoto
photo
photo
Higher School of Economics , St. Petersburg, 2017