

 mathematics
Similar presentations:
")


")


")
The binomial, hypergeometric, poisson distributions (lecture 8)
1.
LECTURE 8THE BINOMIAL, HYPERGEOMETRIC,
POISSON DISTRIBUTIONS
&
CONTINOUS RANDOM VARIABLES
2.
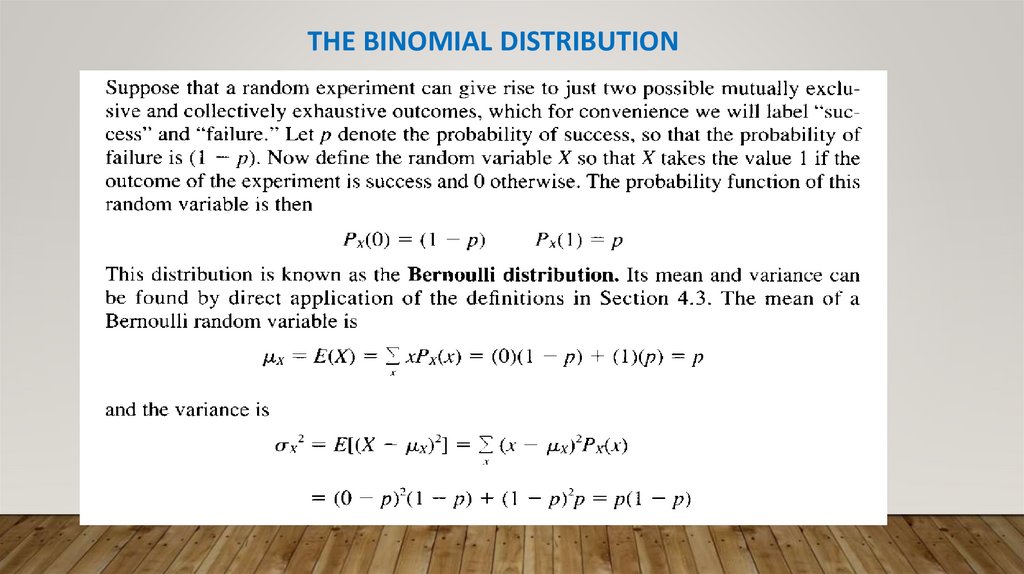
THE BINOMIAL DISTRIBUTION3.
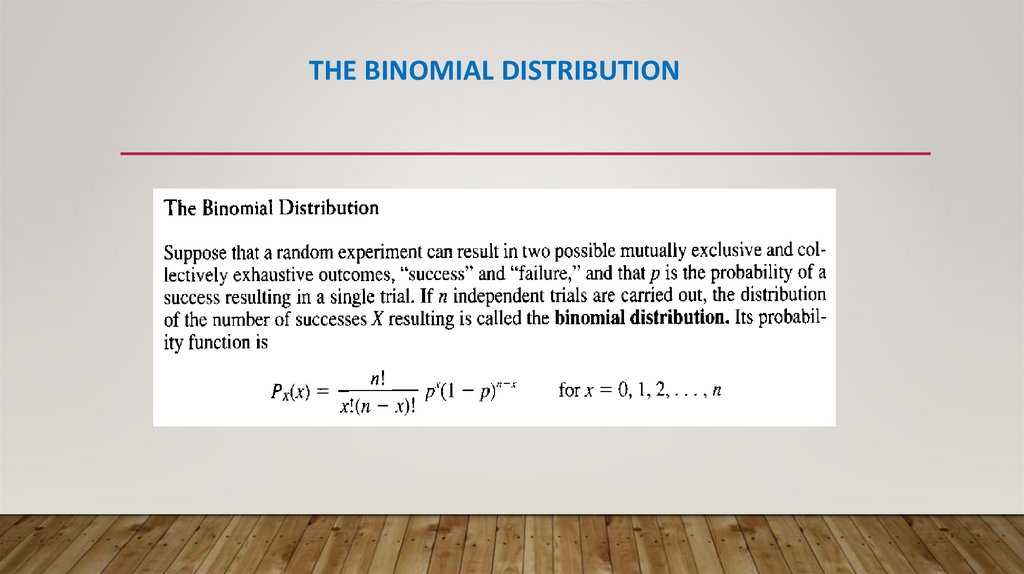
THE BINOMIAL DISTRIBUTION4.
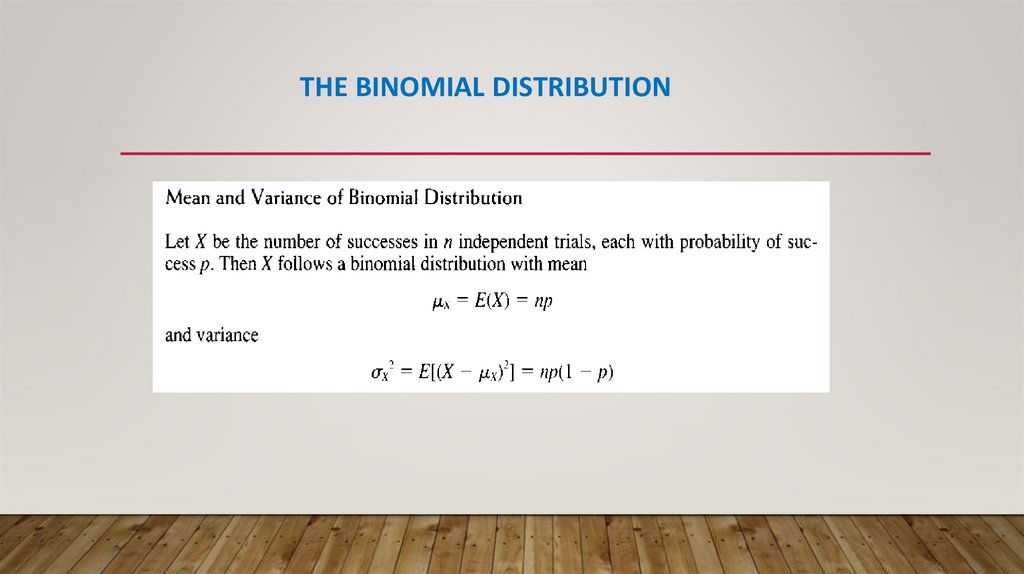
THE BINOMIAL DISTRIBUTION5.
Ex: People who work at high-stress jobs frequently develop stress-related physical problems. In a recent study,it was found that 40% of the large number of business executives surveyed have symptoms of stress-induced
problems. Consider a group of 1500 randomly selected business executives and assume that the probability of
an executive with stress-induced problems is 0.4.
Let X be the number of business executives in the sample of 1500 who develop stress-related problems. What
are the mean and standard deviation of X?
6.
Ex: If for a binomial random variable, the probability of success in one trial is 0.25, what’s theprobability of 8 success in 20 trials?
7.
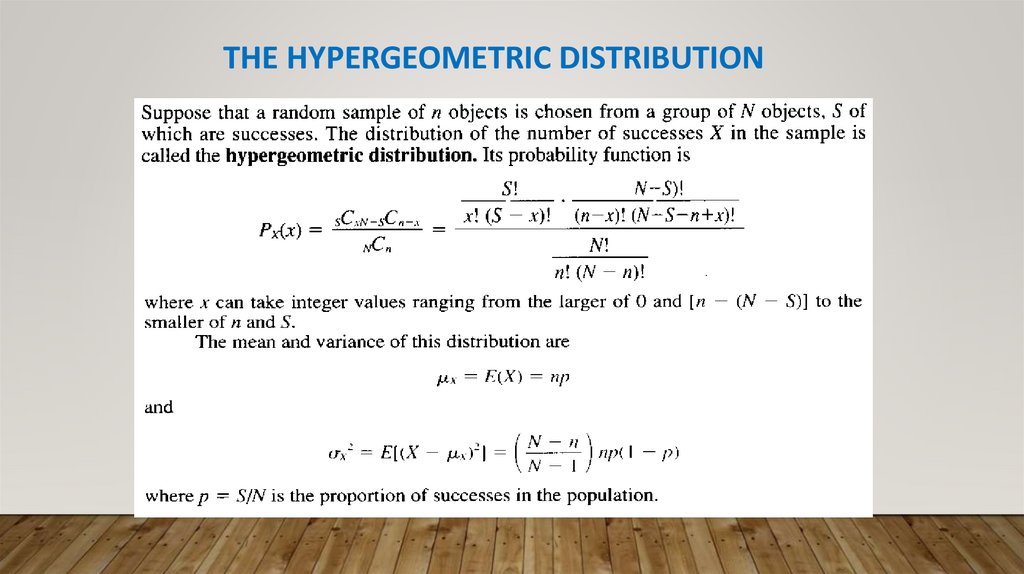
THE HYPERGEOMETRIC DISTRIBUTION8.
Ex: A company receives a shipment of 20 items. Because inspection of each individual item is expensive, it hasa policy of checking a random sample of 6 items from such a shipment and accepting delivery if no more than
one sampled item is defective. What is the probability that a shipment with 5 defective items will b e
accepted?
9.
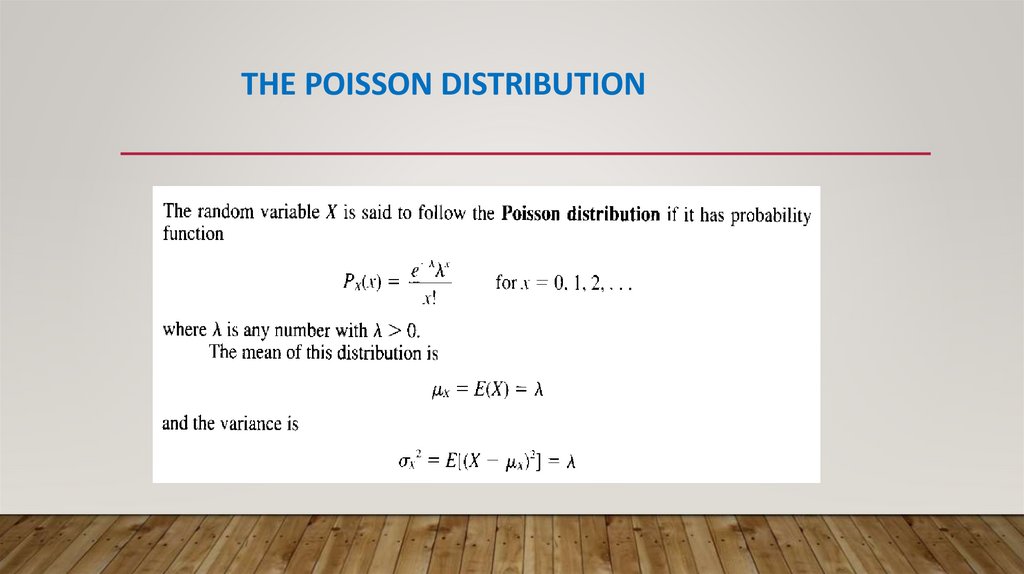
THE POISSON DISTRIBUTION10.
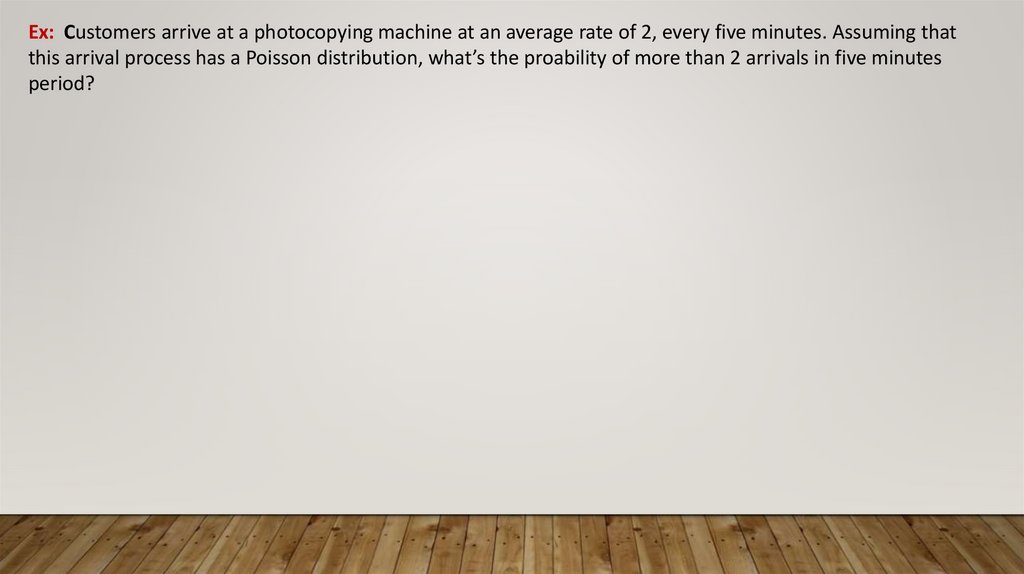
Ex: Customers arrive at a photocopying machine at an average rate of 2, every five minutes. Assuming thatthis arrival process has a Poisson distribution, what’s the proability of more than 2 arrivals in five minutes
period?
11.
CONTINOUS RANDOM VARIABLESAND
PROBABILITY DISTRIBUTIONS
12.
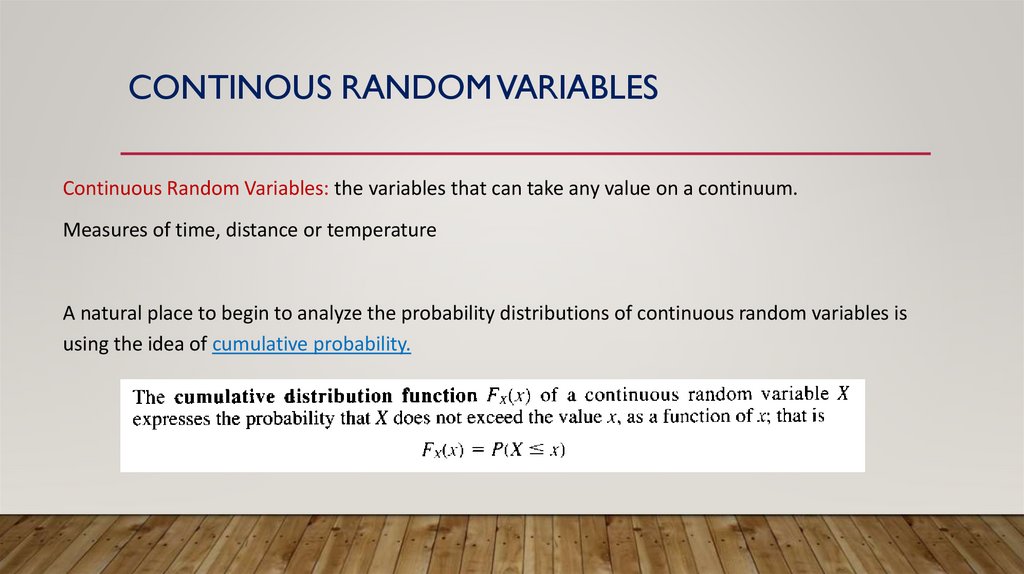
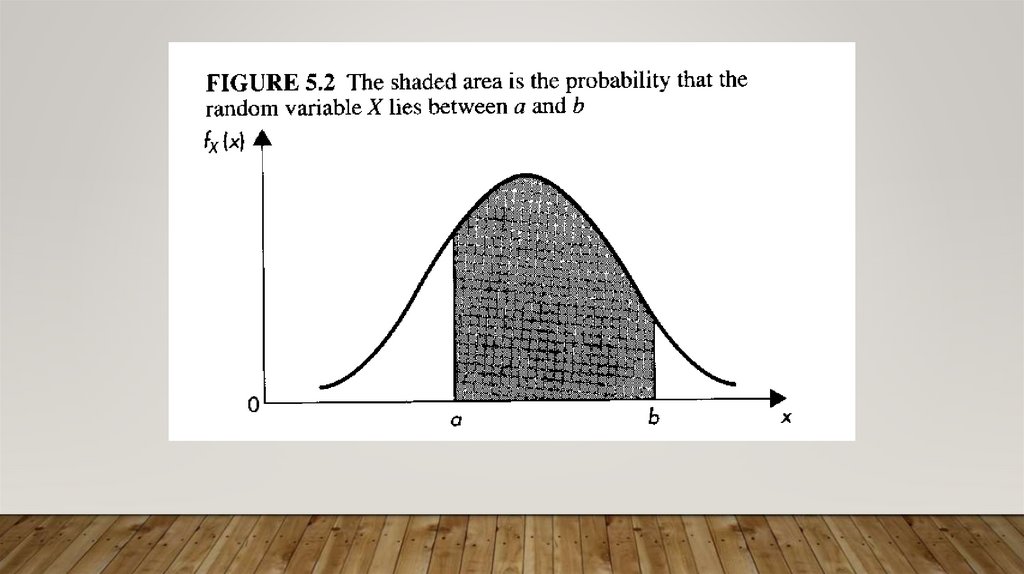
CONTINOUS RANDOM VARIABLESContinuous Random Variables: the variables that can take any value on a continuum.
Measures of time, distance or temperature
A natural place to begin to analyze the probability distributions of continuous random variables is
using the idea of cumulative probability.
13.
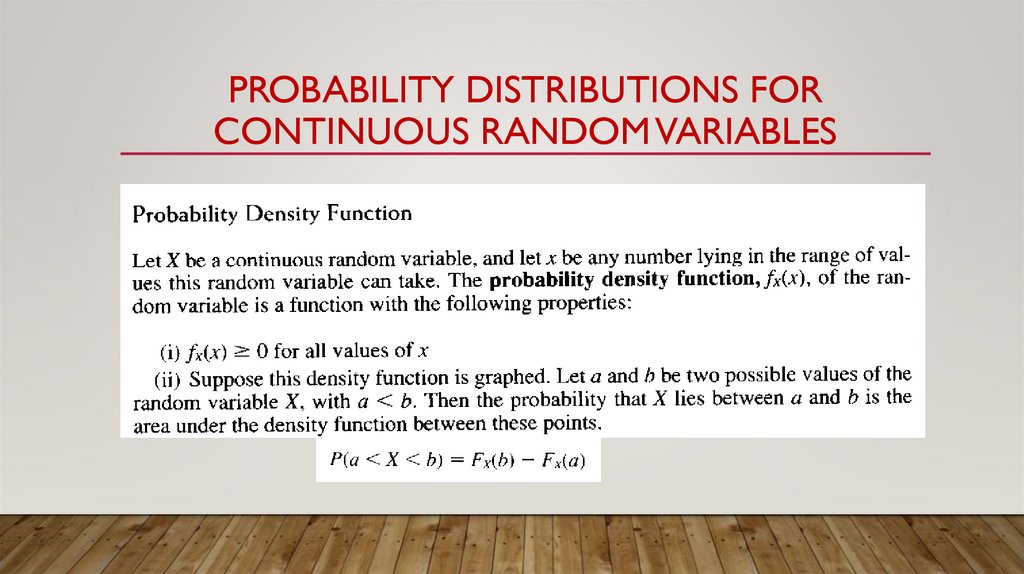
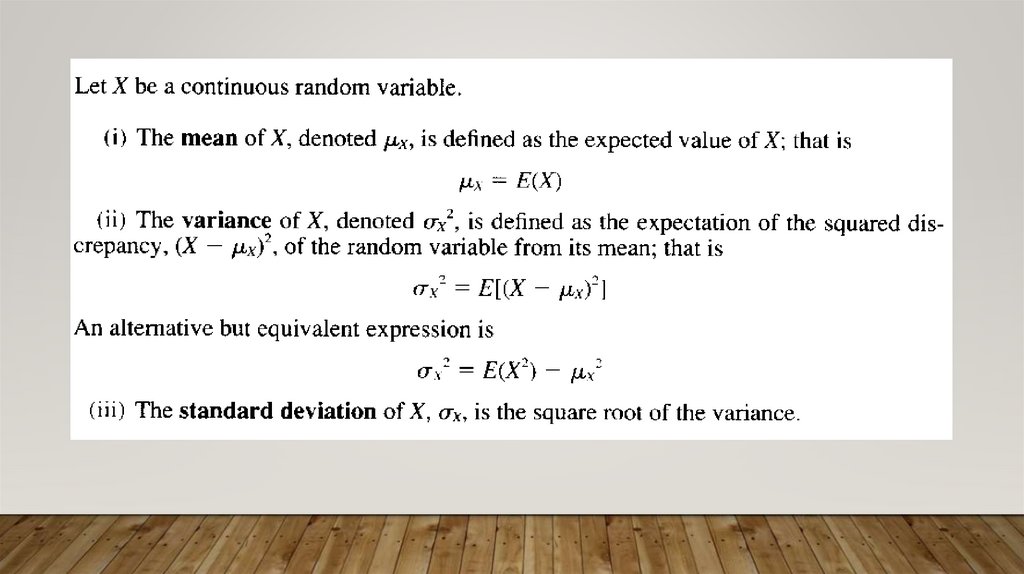
PROBABILITY DISTRIBUTIONS FORCONTINUOUS RANDOM VARIABLES
14.
15.
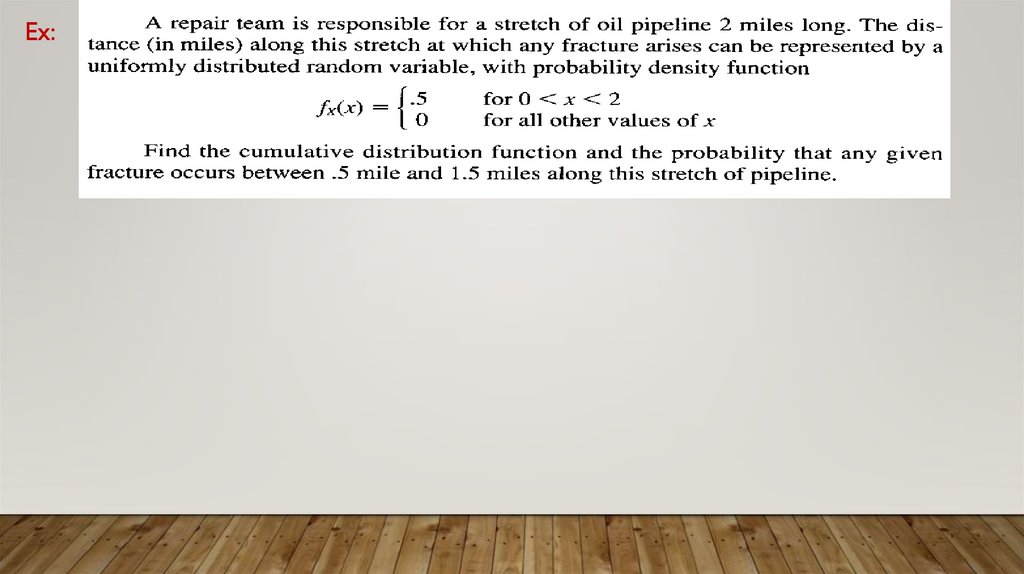
Ex:16.
17.
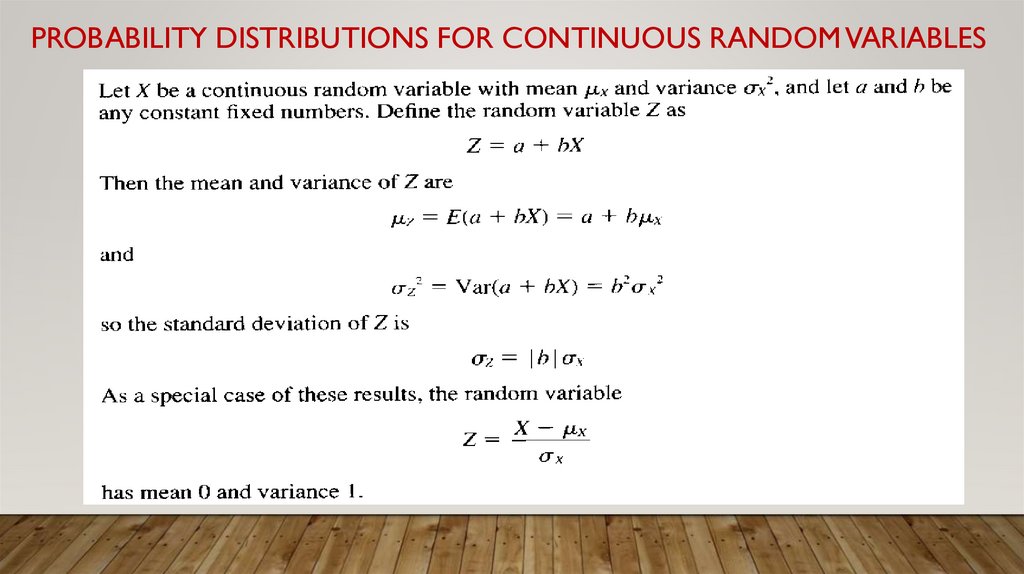
PROBABILITY DISTRIBUTIONS FOR CONTINUOUS RANDOM VARIABLES18.
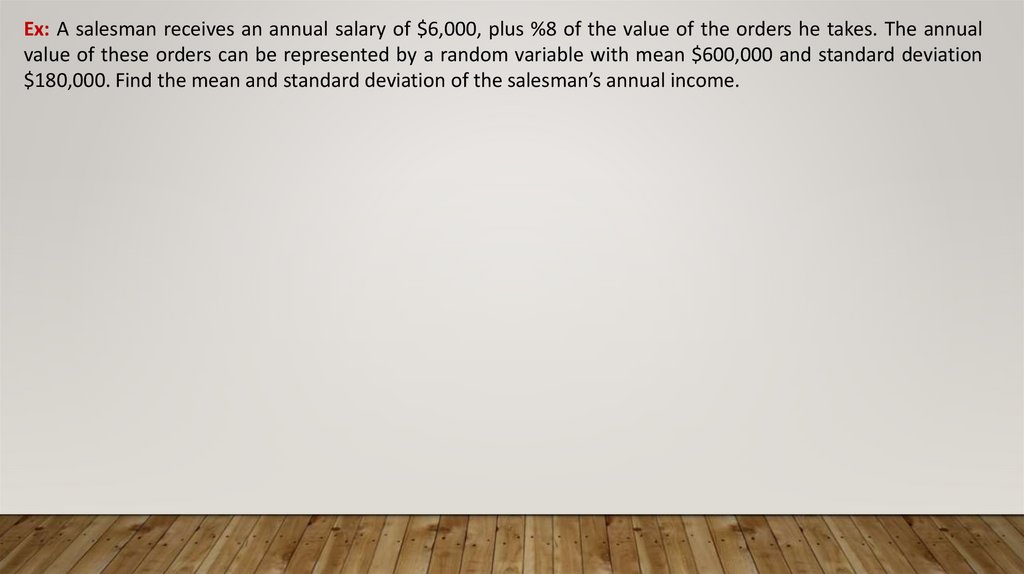
Ex: A salesman receives an annual salary of $6,000, plus %8 of the value of the orders he takes. The annualvalue of these orders can be represented by a random variable with mean $600,000 and standard deviation
$180,000. Find the mean and standard deviation of the salesman’s annual income.
19.
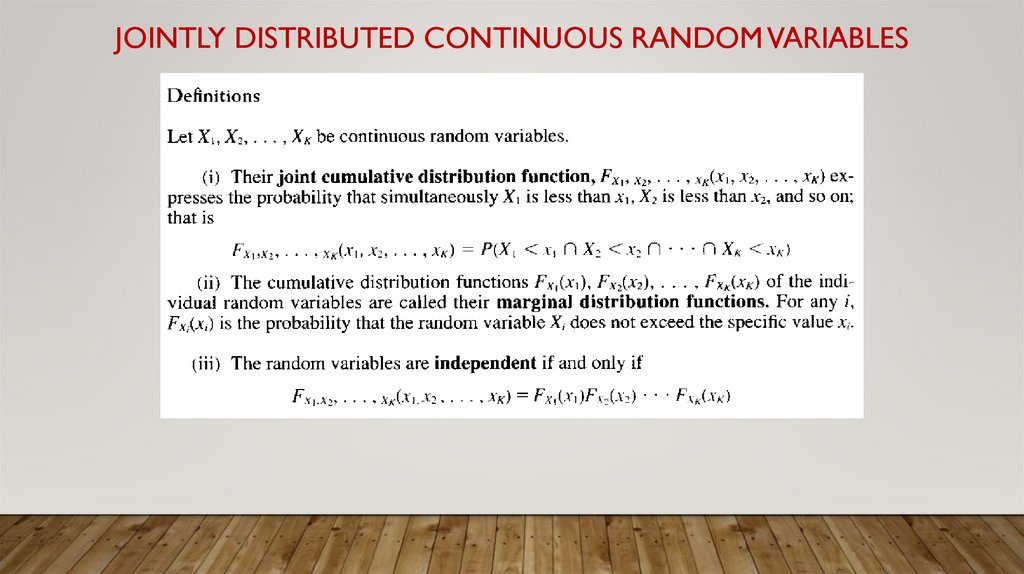
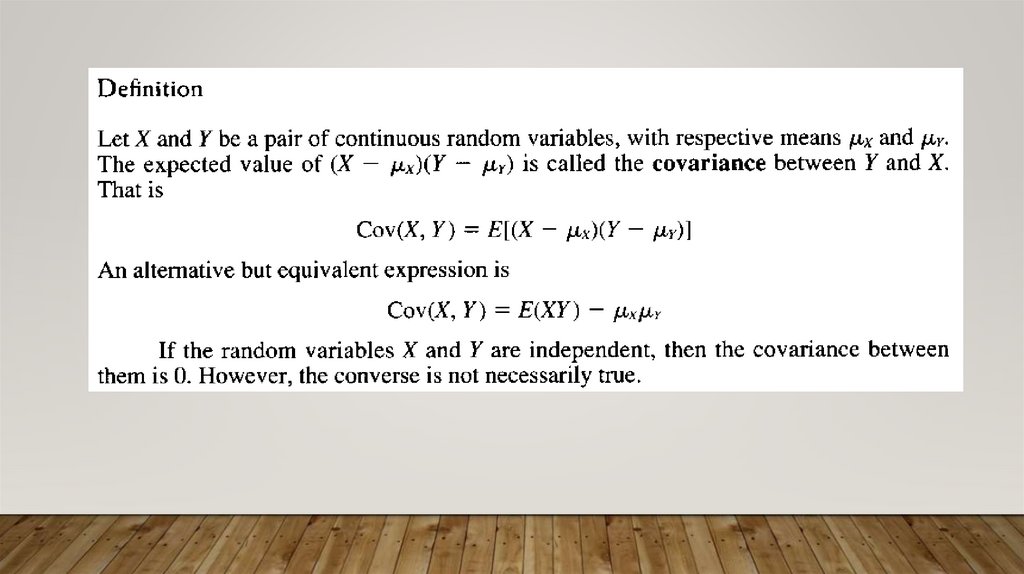
JOINTLY DISTRIBUTED CONTINUOUS RANDOM VARIABLES20.
21.
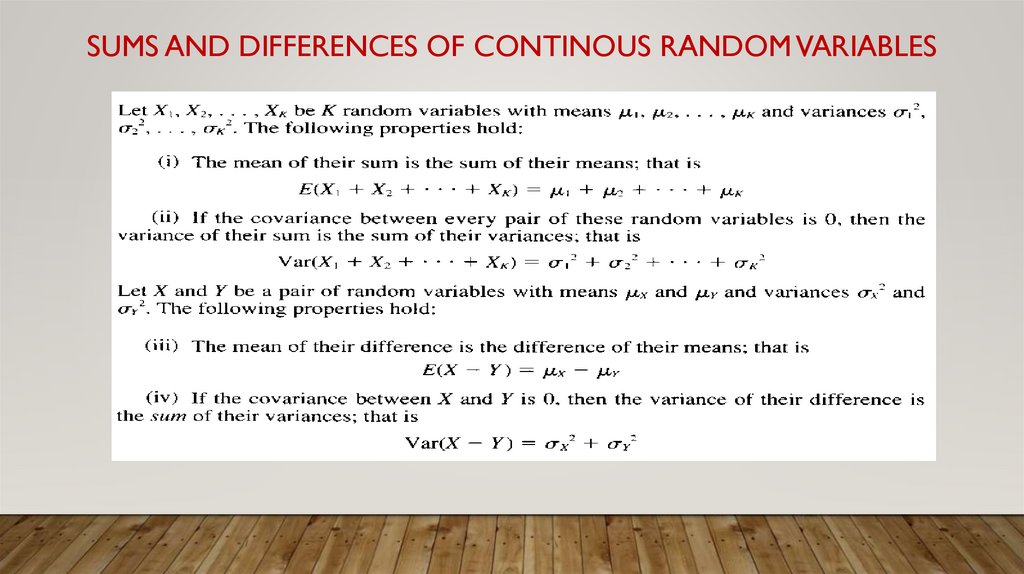
SUMS AND DIFFERENCES OF CONTINOUS RANDOM VARIABLES22.
THE NORMAL DISTRIBUTIONThe normal distribution which is a continous distribution plays a central role in a very large body of
statistical analysis.
23.
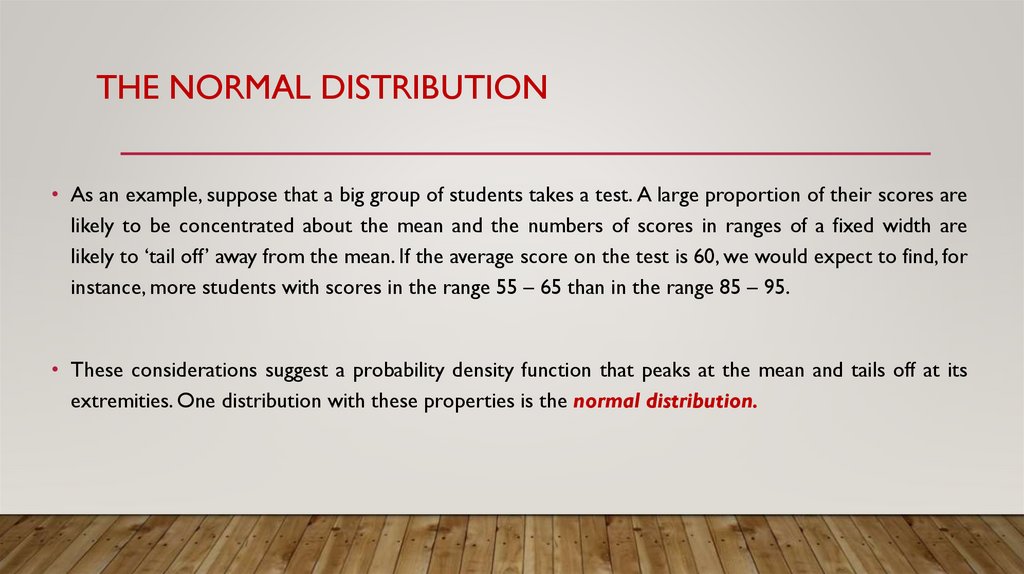
THE NORMAL DISTRIBUTION• As an example, suppose that a big group of students takes a test. A large proportion of their scores are
likely to be concentrated about the mean and the numbers of scores in ranges of a fixed width are
likely to ‘tail off’ away from the mean. If the average score on the test is 60, we would expect to find, for
instance, more students with scores in the range 55 – 65 than in the range 85 – 95.
• These considerations suggest a probability density function that peaks at the mean and tails off at its
extremities. One distribution with these properties is the normal distribution.
24.
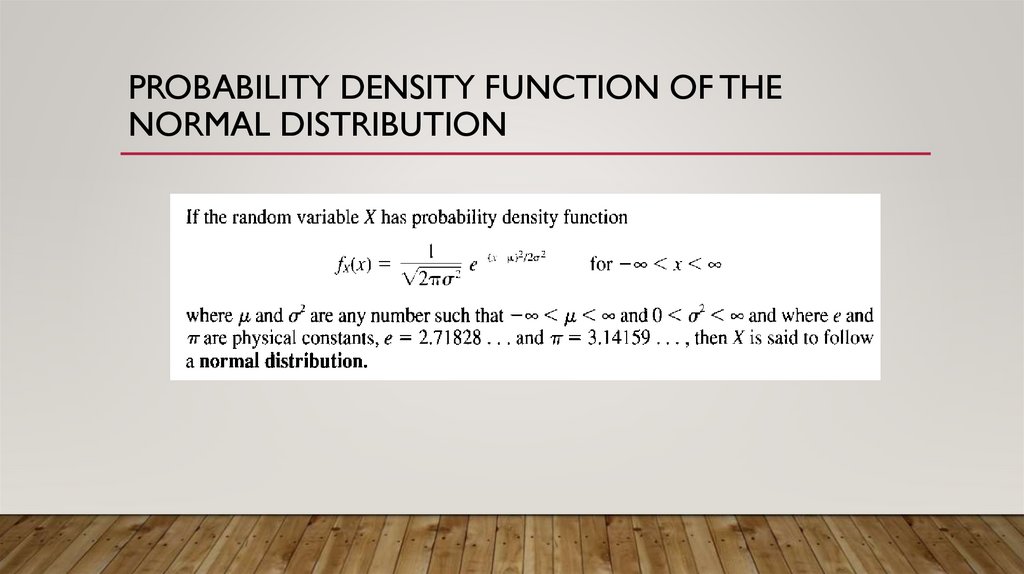
PROBABILITY DENSITY FUNCTION OF THENORMAL DISTRIBUTION
25.
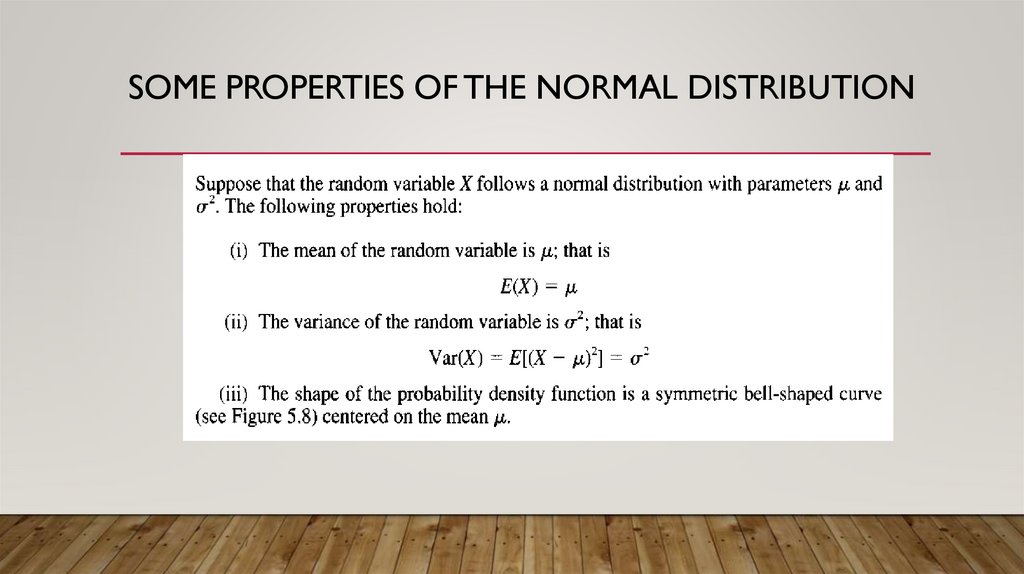
SOME PROPERTIES OF THE NORMAL DISTRIBUTION26.
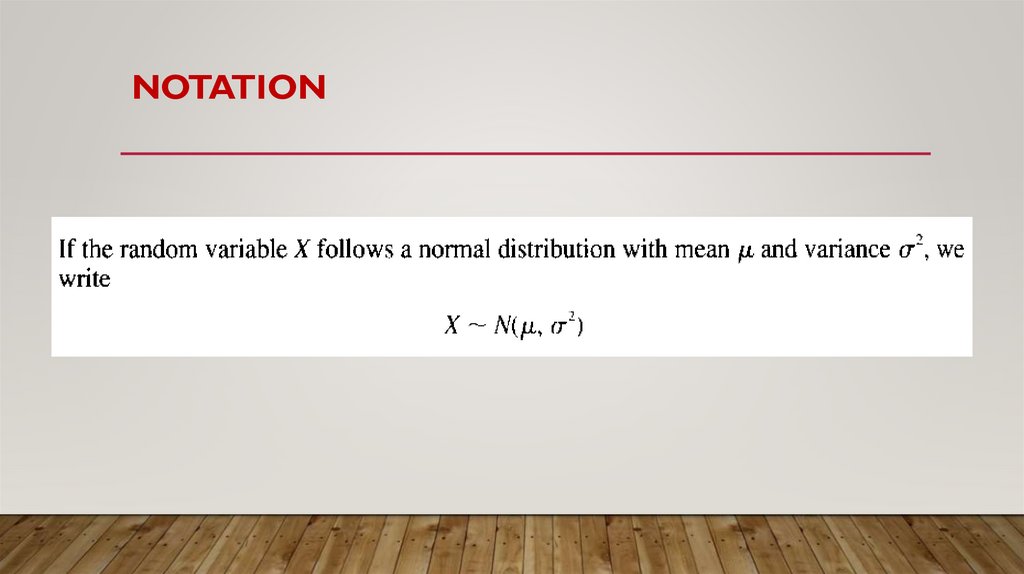
NOTATION27.
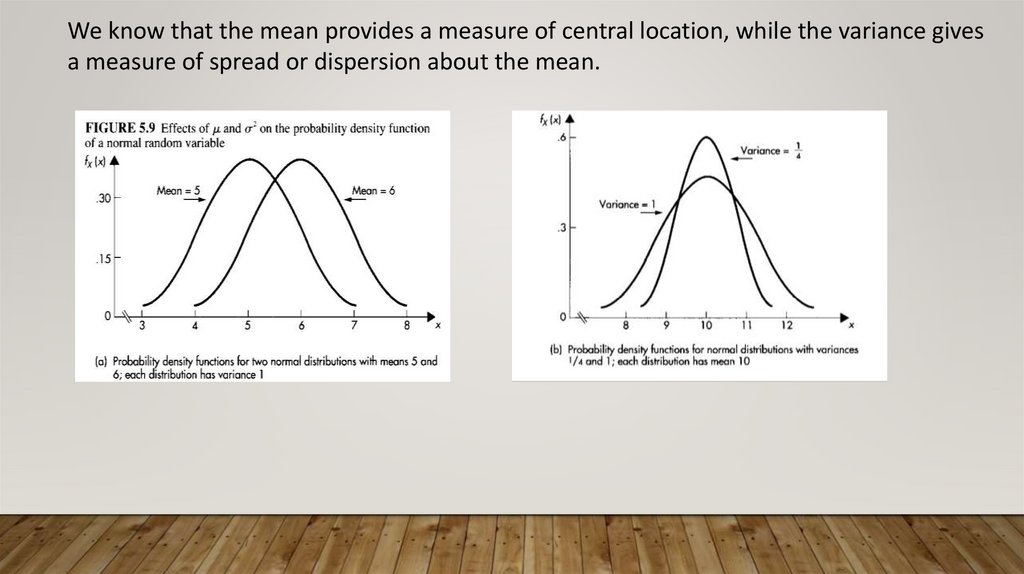
We know that the mean provides a measure of central location, while the variance givesa measure of spread or dispersion about the mean.
28.
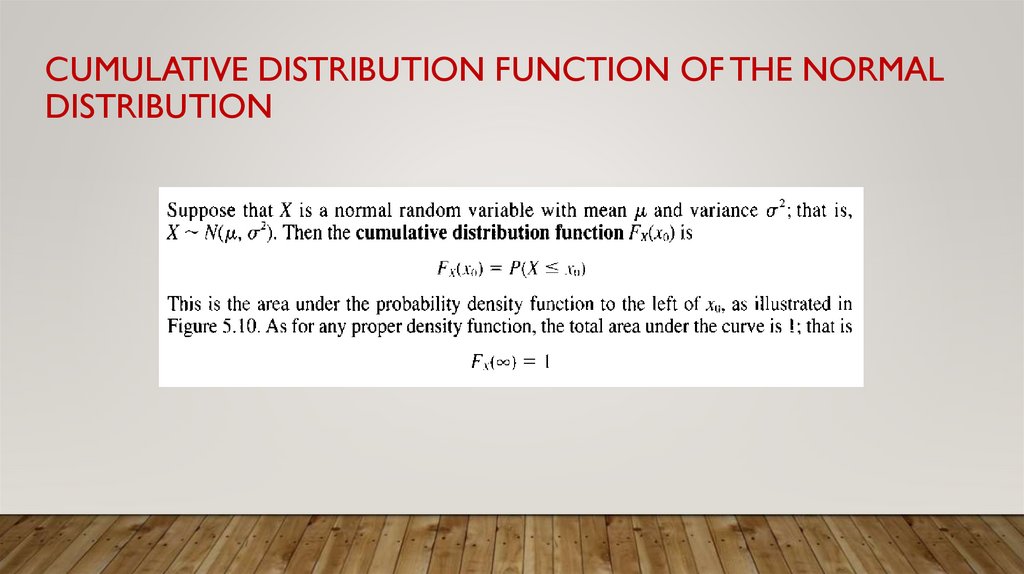
CUMULATIVE DISTRIBUTION FUNCTION OF THE NORMALDISTRIBUTION
29.
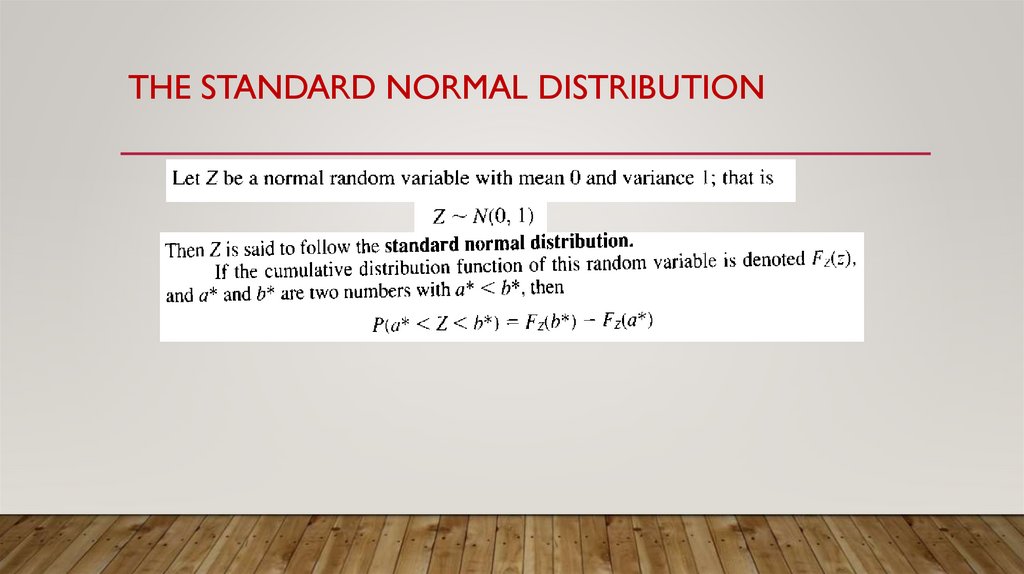
THE STANDARD NORMAL DISTRIBUTION30.
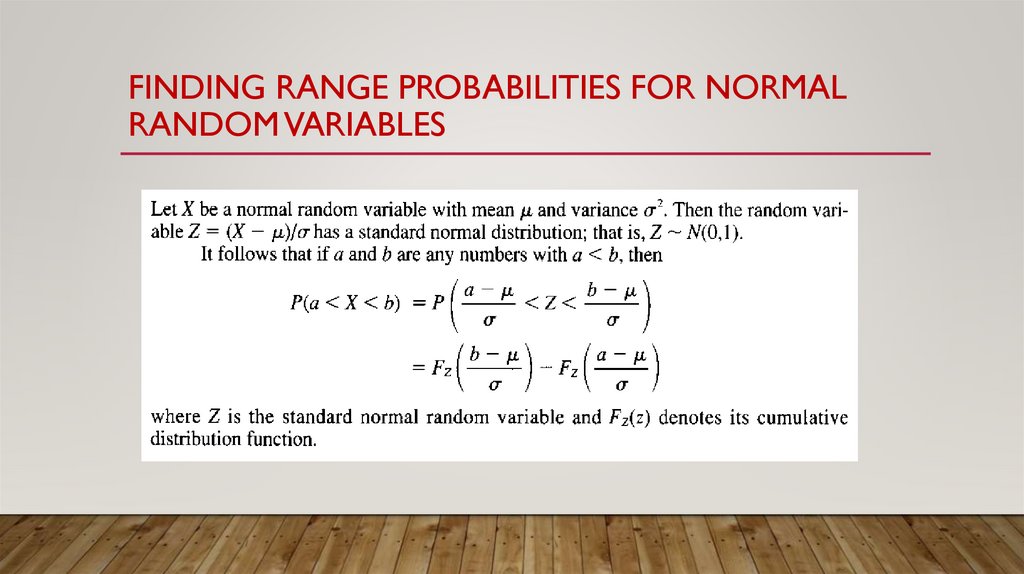
FINDING RANGE PROBABILITIES FOR NORMALRANDOM VARIABLES