

 mathematics
Similar presentations:


")


")
")


Review and Final Exam Guidance. Lecture 11
1.
Probability and StatisticsLecture 11
Review and Final Exam Guidance
2.
2. Special RV: Binomial, Poisson, Exponential, Uniform, Normal3
4
5
Ch 10
Walpole
3.
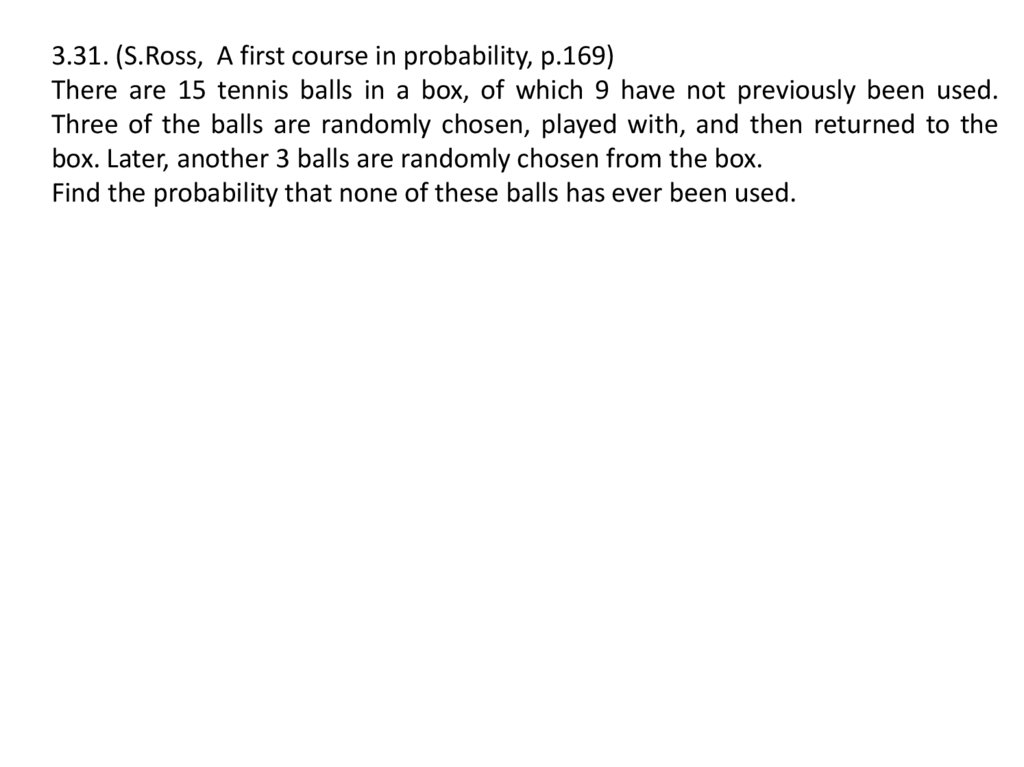
3.31. (S.Ross, A first course in probability, p.169)There are 15 tennis balls in a box, of which 9 have not previously been used.
Three of the balls are randomly chosen, played with, and then returned to the
box. Later, another 3 balls are randomly chosen from the box.
Find the probability that none of these balls has ever been used.
4.
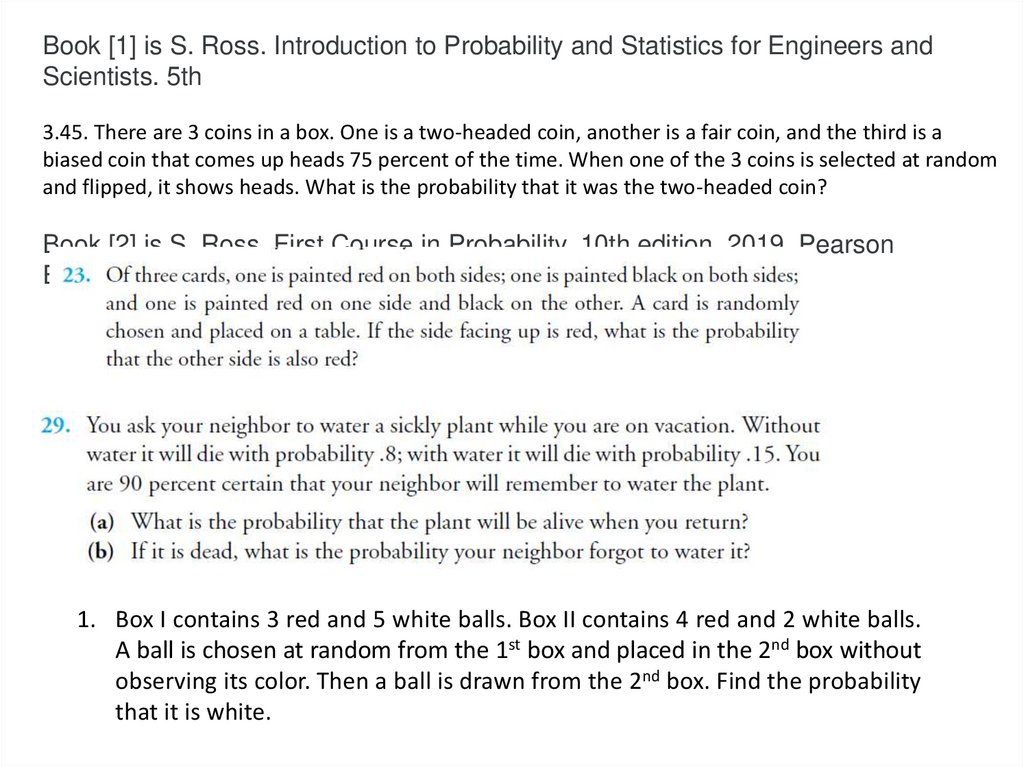
Book [1] is S. Ross. Introduction to Probability and Statistics for Engineers andScientists. 5th
3.45. There are 3 coins in a box. One is a two-headed coin, another is a fair coin, and the third is a
biased coin that comes up heads 75 percent of the time. When one of the 3 coins is selected at random
and flipped, it shows heads. What is the probability that it was the two-headed coin?
Book [2] is S. Ross. First Course in Probability. 10th edition. 2019, Pearson
Education.
1. Box I contains 3 red and 5 white balls. Box II contains 4 red and 2 white balls.
A ball is chosen at random from the 1st box and placed in the 2nd box without
observing its color. Then a ball is drawn from the 2nd box. Find the probability
that it is white.
5.
1. There are 5 boxes. Each of the 1st, 2nd and 3rd boxes contains 2 white and 3black balls. Each of the 4th and 5th boxes contains 1 white and 1 black ball. A
box is chosen at random and a ball is drawn from it. What is the conditional
probability that 4-th or 5-th box is chosen if the taken ball occurs to be
white?
3.32. Consider two boxes, one containing 1 black and 1 white marble, the
other 2 black and 1 white marble. A box is selected at random, and a marble
is drawn from it at random. What is the probability that the marble is black?
What is the probability that the first box was the one selected given that the
marble is white?
6.
Quiz-21. Suppose that a fair coin is tossed 800 times. Find approximate value for the
probability of obtaining more than 455 heads.
2. Suppose that the distribution of the number of defects on any given roll of
material is the Poisson distribution with mean 4, and the number of defects on each
roll is counted for a random sample of 125 rolls. Determine the probability that the
average number of defects per roll in the sample will be less than 6.
3. Suppose that you have a sample of 100 values from a population with mean µ =
520 and with standard deviation σ = 75.
(a) What is the probability that the sample mean will be in the interval (510, 530)?
(b) Give an interval that covers the middle 90% of the distribution of the sample
mean.
7.
1. In a random sample of 1000 homes in a certain city, it is found that 228 areheated by oil. Find 99% confidence interval for the proportion of homes in this
city that are heated by oil.
How large a sample is needed if we wish to be 99% confident that our sample
proportion will be within 0.05 of the true proportion of homes in the city that are
heated by oil?
8.
2. The heights of a random sample of 100 college students showed a mean of174.5 centimeters and a standard deviation of 6.2 centimeters. Construct a 96%
confidence interval for the mean height of all college students.
9.
The heights of a random sample of 50 college students showed a mean of174.5 centimeters and a standard deviation of 6.9 centimeters.
(a) Construct a 98% confidence interval for the mean height of all college
students.
(b) What can we assert with 98% confidence about the possible size of our
error if we estimate the mean height of all college students to be 174.5
centimeters?
10.
2. Each of 20 science students independently measured the melting point of lead.The sample mean and sample standard deviation of these measurements were (in
degrees centigrade) 330.2 and 15.4, respectively. Construct a 95 percent con dence
interval estimate of the true melting point of lead.
3. Scholastic Aptitude Test (SAT) mathematics scores of a random sample of 500
high school seniors in the state of Texas are collected, and the sample mean and
standard deviation are found to be 501 and 112, respectively.
Find:
a) a 99% confidence interval on the mean SAT mathematics score for seniors in
the state of Texas;
b) a 95 percent upper con dence interval on the mean SAT mathematics score for
seniors in the state of Texas.
Since the sample size is large, use normal approximation
11.
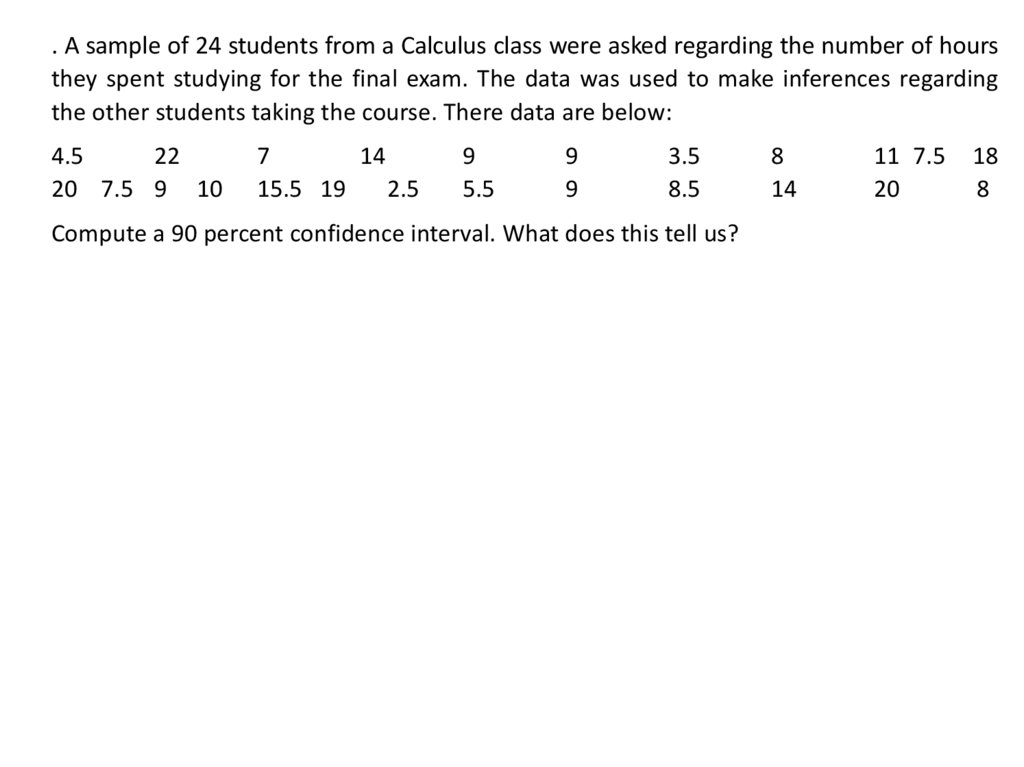
. A sample of 24 students from a Calculus class were asked regarding the number of hoursthey spent studying for the final exam. The data was used to make inferences regarding
the other students taking the course. There data are below:
4.5
22
20 7.5 9 10
7
14
15.5 19
2.5
9
5.5
9
9
3.5
8.5
Compute a 90 percent confidence interval. What does this tell us?
8
14
11 7.5
20
18
8
12.
13.
14.
15.
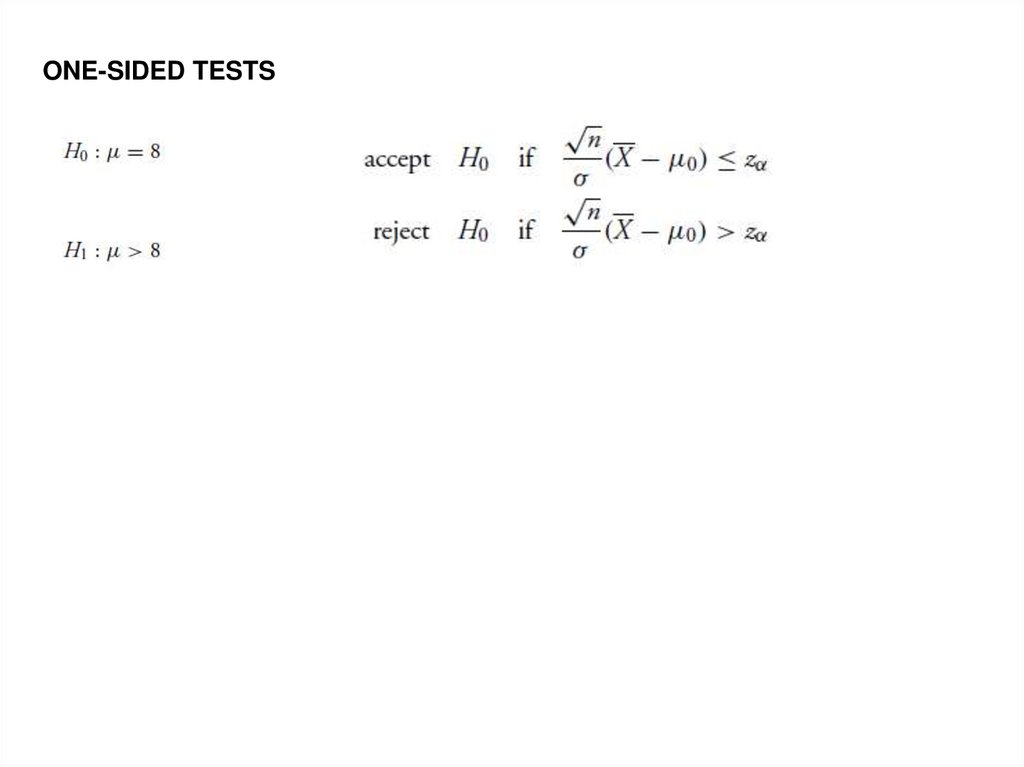
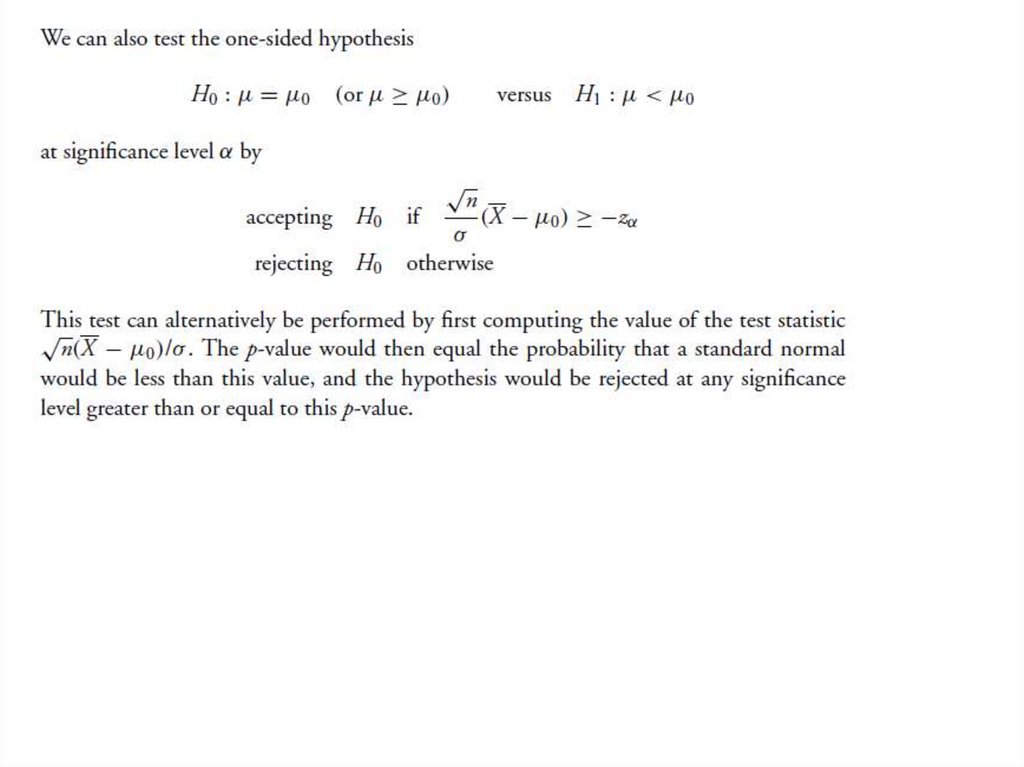
ONE-SIDED TESTS16.
17.
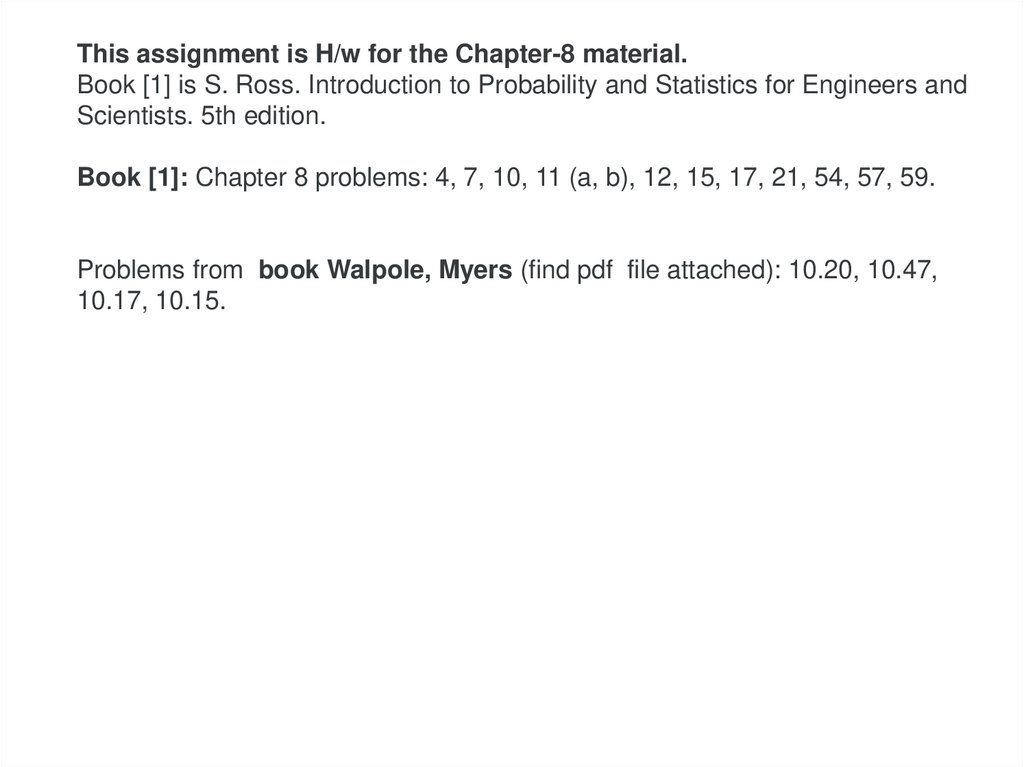
This assignment is H/w for the Chapter-8 material.Book [1] is S. Ross. Introduction to Probability and Statistics for Engineers and
Scientists. 5th edition.
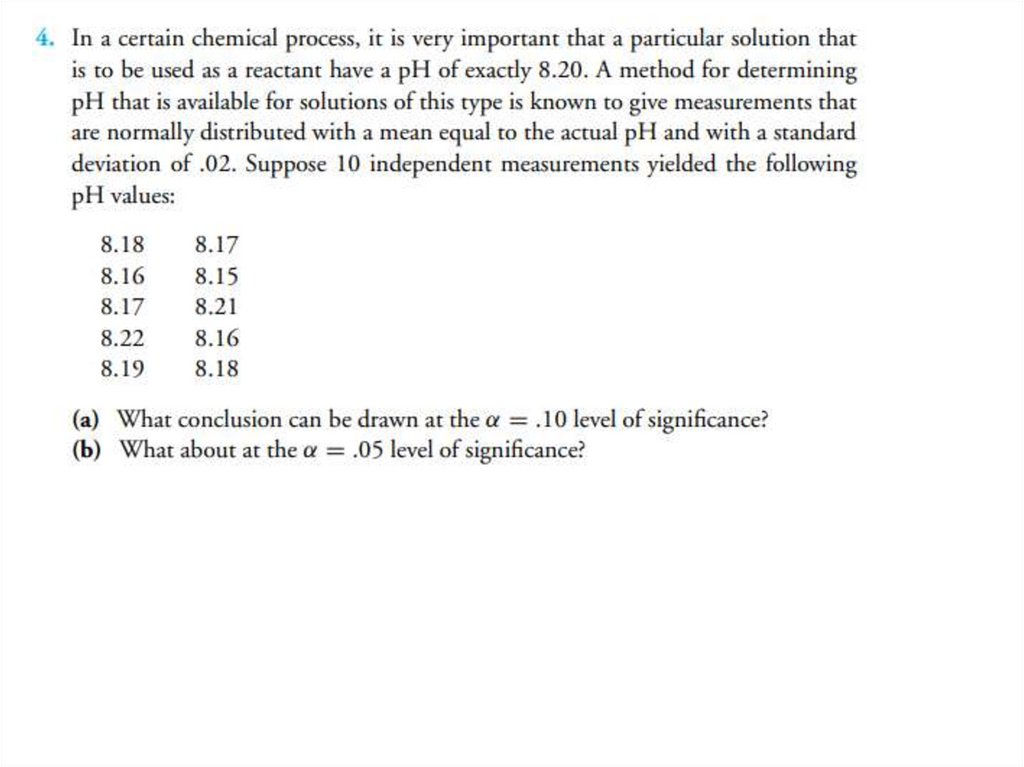
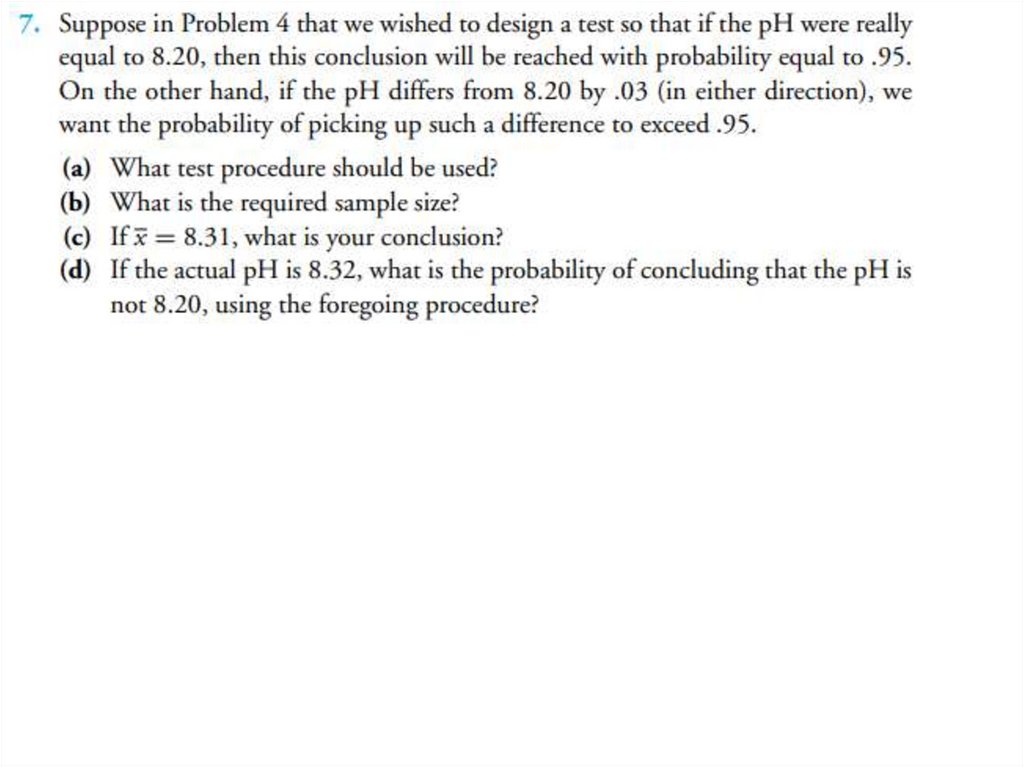
Book [1]: Chapter 8 problems: 4, 7, 10, 11 (a, b), 12, 15, 17, 21, 54, 57, 59.
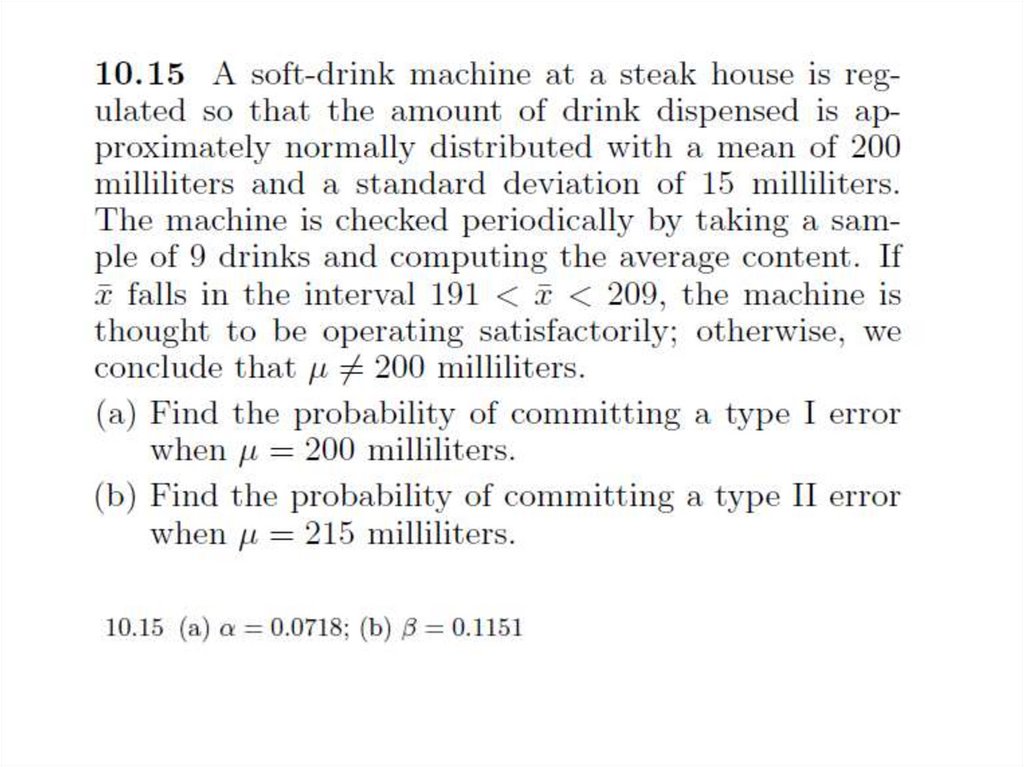
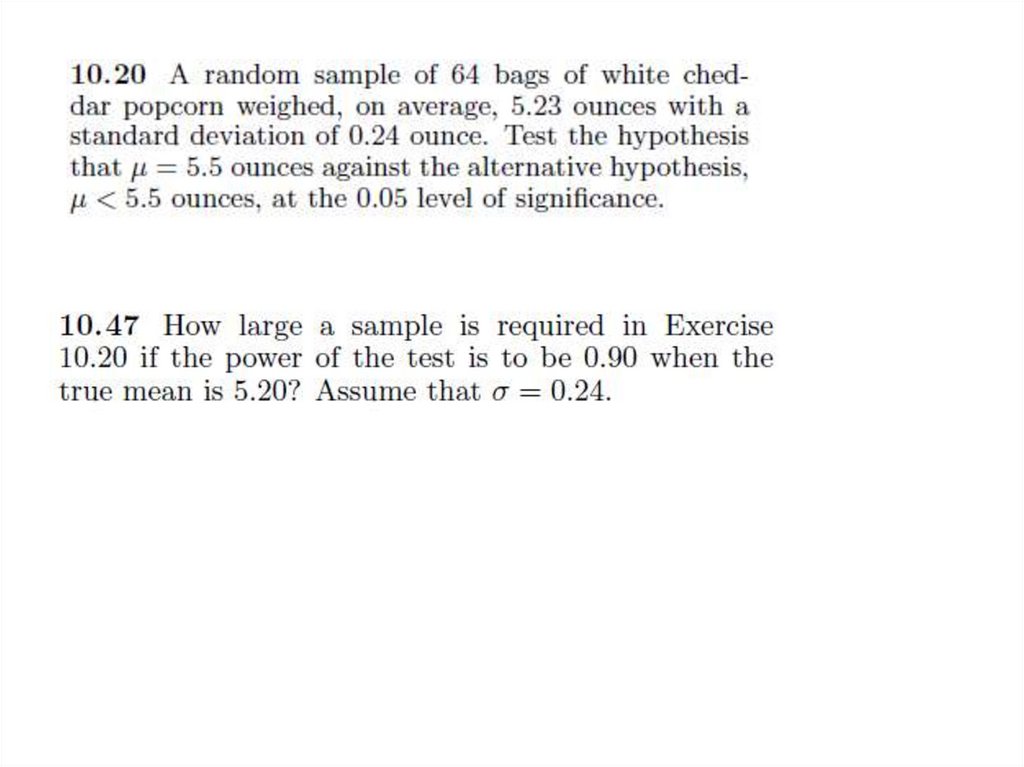
Problems from book Walpole, Myers (find pdf file attached): 10.20, 10.47,
10.17, 10.15.