


 industry
Similar presentations:


")


Radar data visualization tool (RDV)
1.
TRAINING COURSERADAR DATA VISUALIZATION
TOOL (RDV)
Primary Surveillance Radar Systems
ATM
Nº doc.: 0066605020000MA06
Edición: A Revisión: 1
Fecha: 09/03/2020
2.
Warning of ConfidentialityThe data and information, in its totality or partial expression, contained in this document are property of
Indra Sistemas, S.A. This data and information cannot be disclosed totally or partially to third parties.
The copy, reproduction, public communication, dissemination, total or partial distribution, modification or
assignment will require the prior written authorization of Indra Sistemas, S.A. Its content cannot be used
for different purposes to those for which it is provided, its use being limited to the execution of the
Program it is supplied for.
0066605020000MA06 _A1
09/03/2020
2 de 932
3.
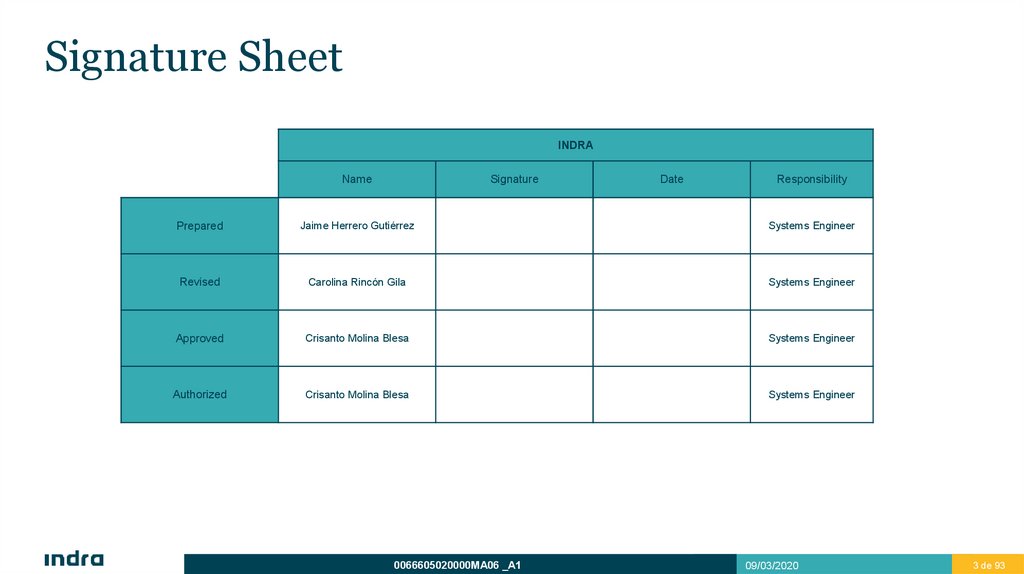
Signature SheetINDRA
Name
Signature
Date
Responsibility
Prepared
Jaime Herrero Gutiérrez
Systems Engineer
Revised
Carolina Rincón Gila
Systems Engineer
Approved
Crisanto Molina Blesa
Systems Engineer
Authorized
Crisanto Molina Blesa
Systems Engineer
0066605020000MA06 _A1
09/03/2020
3 de 933
4.
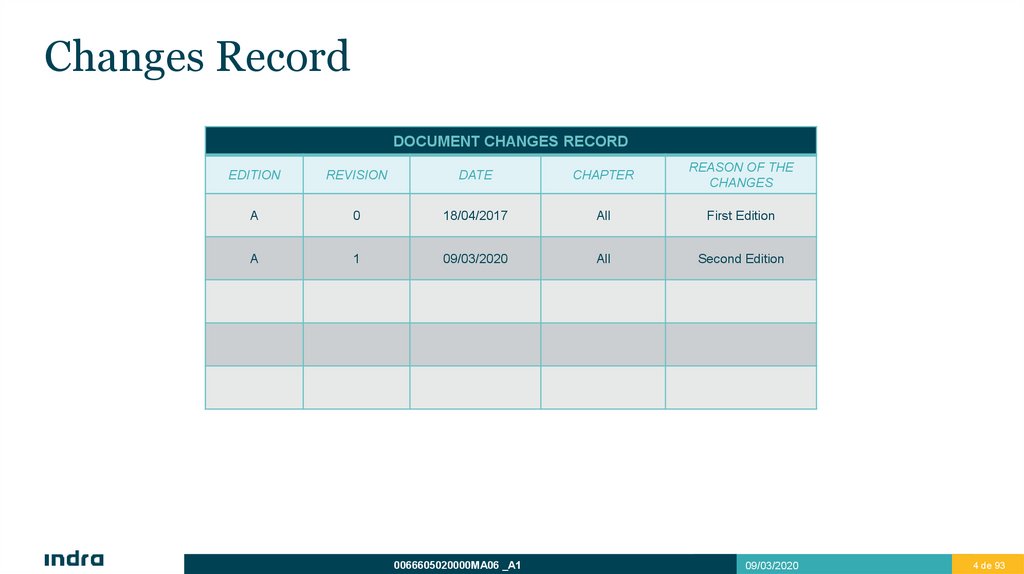
Changes RecordDOCUMENT CHANGES RECORD
EDITION
REVISION
DATE
CHAPTER
REASON OF THE
CHANGES
A
0
18/04/2017
All
First Edition
A
1
09/03/2020
All
Second Edition
0066605020000MA06 _A1
09/03/2020
4 de 934
5.
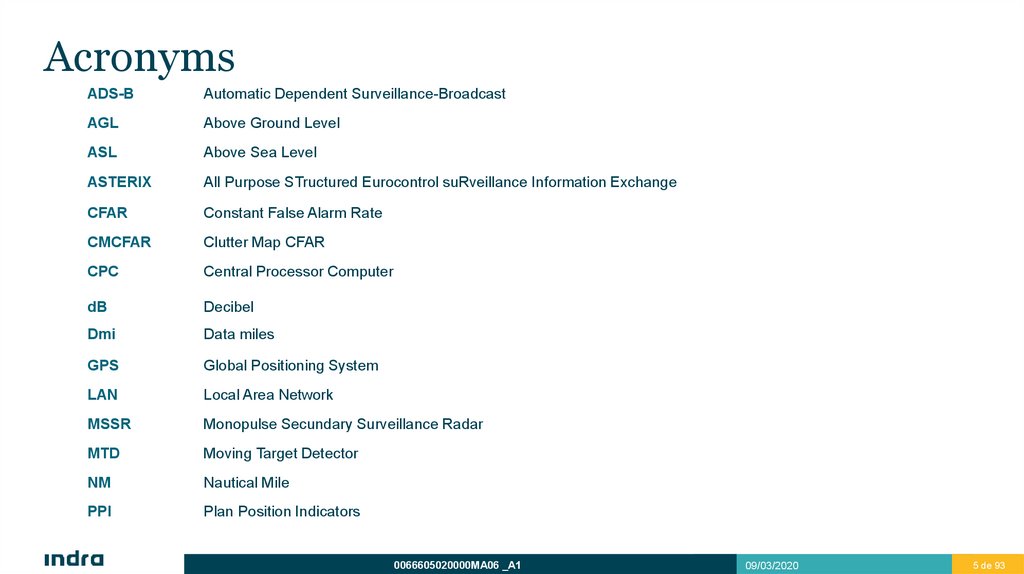
AcronymsADS-B
Automatic Dependent Surveillance-Broadcast
AGL
Above Ground Level
ASL
Above Sea Level
ASTERIX
All Purpose STructured Eurocontrol suRveillance Information Exchange
CFAR
Constant False Alarm Rate
CMCFAR
Clutter Map CFAR
CPC
Central Processor Computer
dB
Decibel
Dmi
Data miles
GPS
Global Positioning System
LAN
Local Area Network
MSSR
Monopulse Secundary Surveillance Radar
MTD
Moving Target Detector
NM
Nautical Mile
PPI
Plan Position Indicators
0066605020000MA06 _A1
09/03/2020
5 de 935
6.
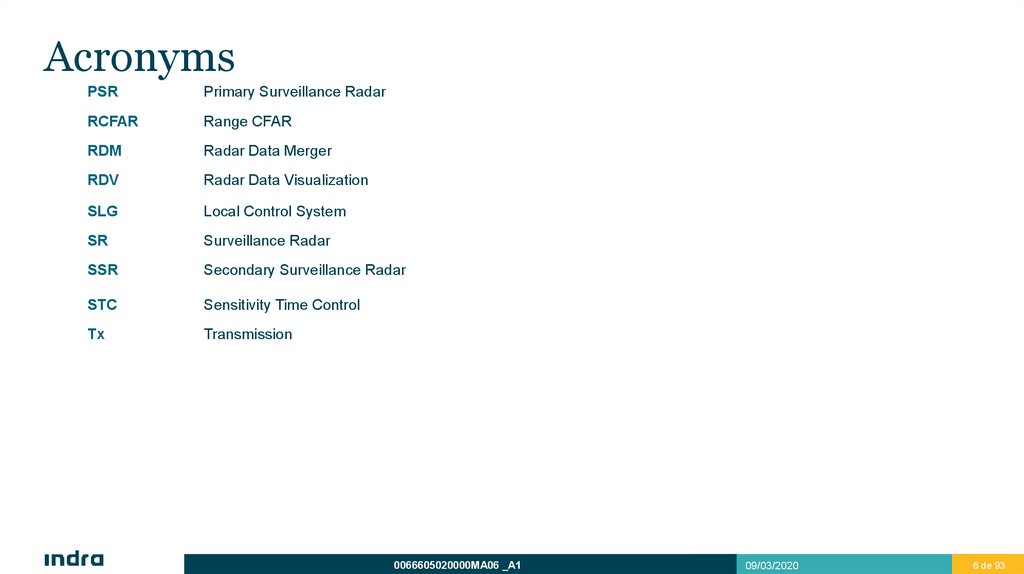
AcronymsPSR
Primary Surveillance Radar
RCFAR
Range CFAR
RDM
Radar Data Merger
RDV
Radar Data Visualization
SLG
Local Control System
SR
Surveillance Radar
SSR
Secondary Surveillance Radar
STC
Sensitivity Time Control
Tx
Transmission
0066605020000MA06 _A1
09/03/2020
6 de 936
7.
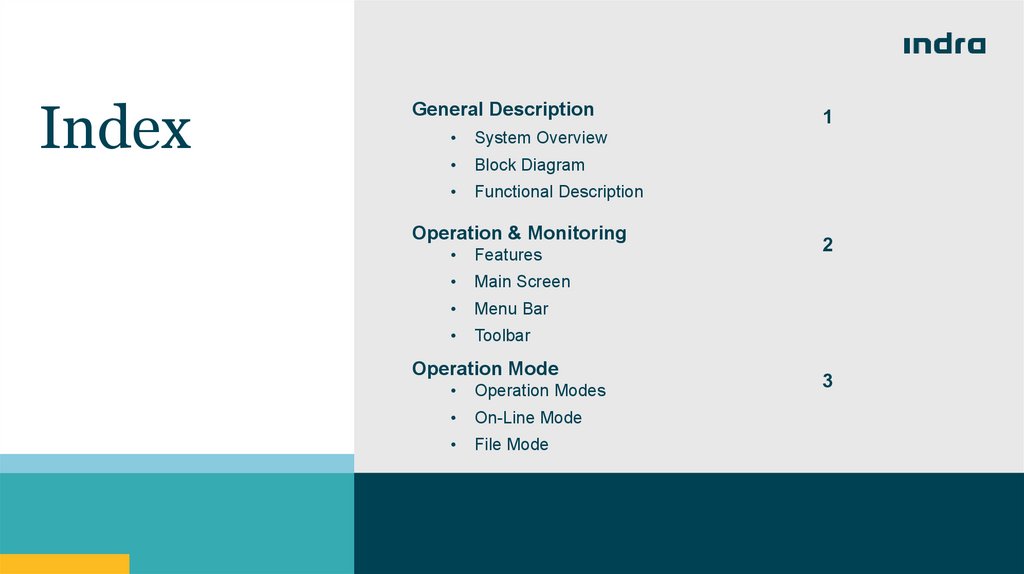
IndexGeneral Description
System Overview
Block Diagram
Functional Description
Operation & Monitoring
Features
Main Screen
Menu Bar
Toolbar
Operation Mode
Operation Modes
On-Line Mode
File Mode
1
2
3
8.
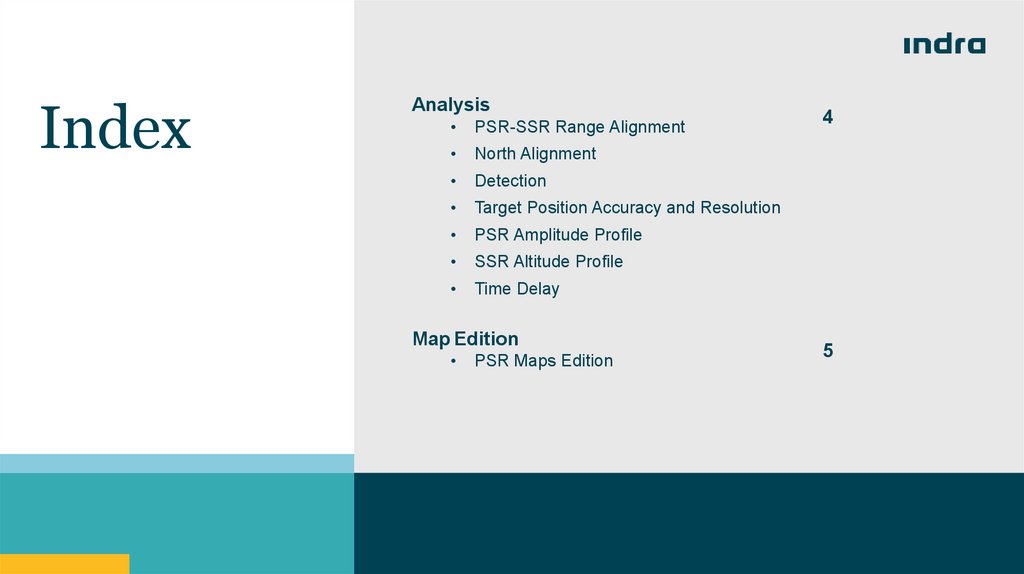
IndexAnalysis
PSR-SSR Range Alignment
North Alignment
Detection
Target Position Accuracy and Resolution
PSR Amplitude Profile
SSR Altitude Profile
Time Delay
Map Edition
PSR Maps Edition
4
5
9.
General DescriptionSystem Overview
Block Diagram
Functional Description
1
10.
General DescriptionSystem Overview
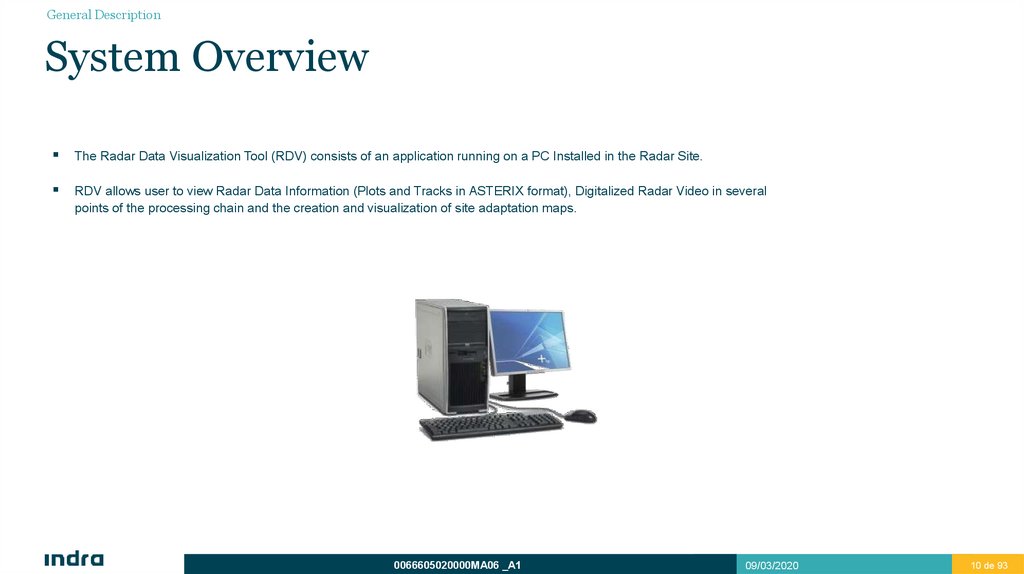
The Radar Data Visualization Tool (RDV) consists of an application running on a PC Installed in the Radar Site.
RDV allows user to view Radar Data Information (Plots and Tracks in ASTERIX format), Digitalized Radar Video in several
points of the processing chain and the creation and visualization of site adaptation maps.
0066605020000MA06 _A1
09/03/2020
10 de 93
10
11.
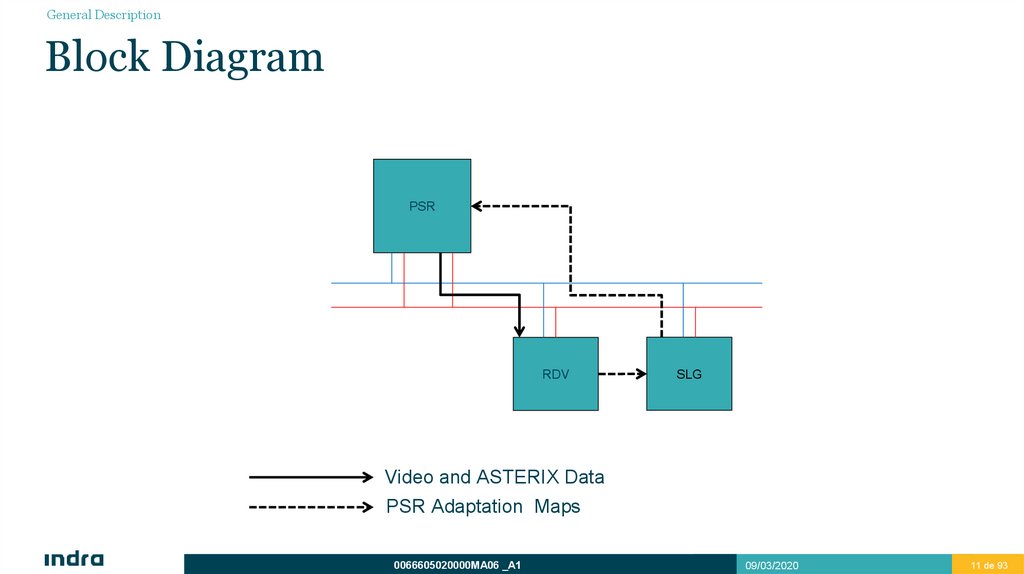
General DescriptionBlock Diagram
PSR
RDV
SLG
Video and ASTERIX Data
PSR Adaptation Maps
0066605020000MA06 _A1
09/03/2020
11 de 93
11
12.
General DescriptionFunctional Description
The main of RDV are:
Radar Data: Visualization and recordings of ASTERIX Data from PSR, MSSR, RDM and ADS-B. Monitor PSR real time samples and detections.
PSR Video: Visualization of PSR Digitalized Video from all possible points in the processing chain as raw signal a signal after compression in every
single channel, weather levels, detections, etc.
PSR Adaptation Maps: Creation, edition and displaying of PSR site adaptation maps, including Digital STC, Analogue STC, Receiver States,
Transmission Blanking and Tracking Areas.
Analyses: The RDV provides tools to analyse radar information as PSR/SSR Alignment, North Alignment, Accuracy and Probability of Detection, PSR
Amplitud Profile, SSR Altitude Profile, etc.
Reports: Evaluation of radar data files, providing information related to recording duration, radar detections, radar site location, etc. functions
0066605020000MA06 _A1
09/03/2020
12 de 93
12
13.
Operation & MonitoringFeatures
Main Screen
Menu Bar
Toolbar
2
14.
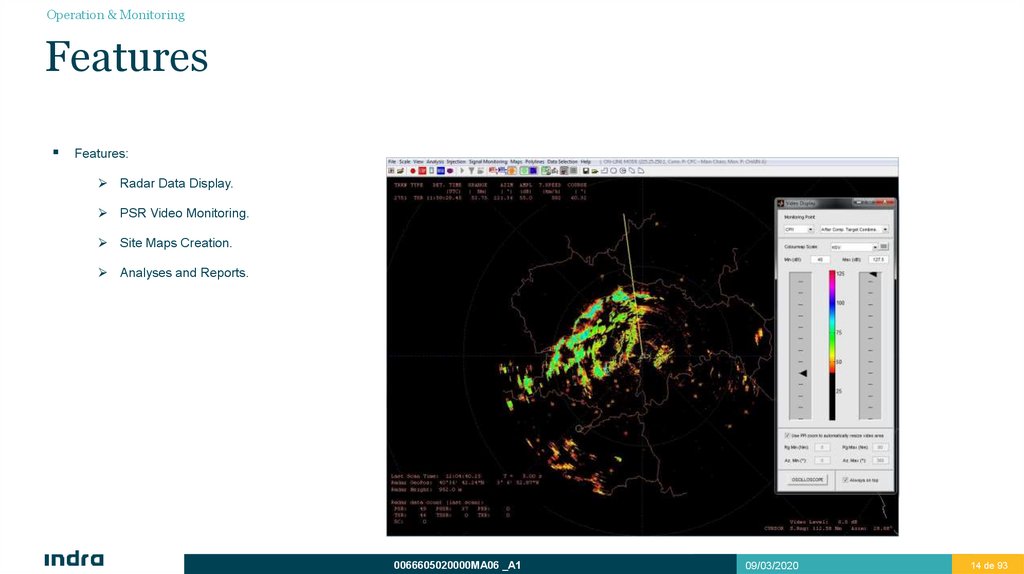
Operation & MonitoringFeatures
Features:
Radar Data Display.
PSR Video Monitoring.
Site Maps Creation.
Analyses and Reports.
0066605020000MA06 _A1
09/03/2020
14 de 93
14
15.
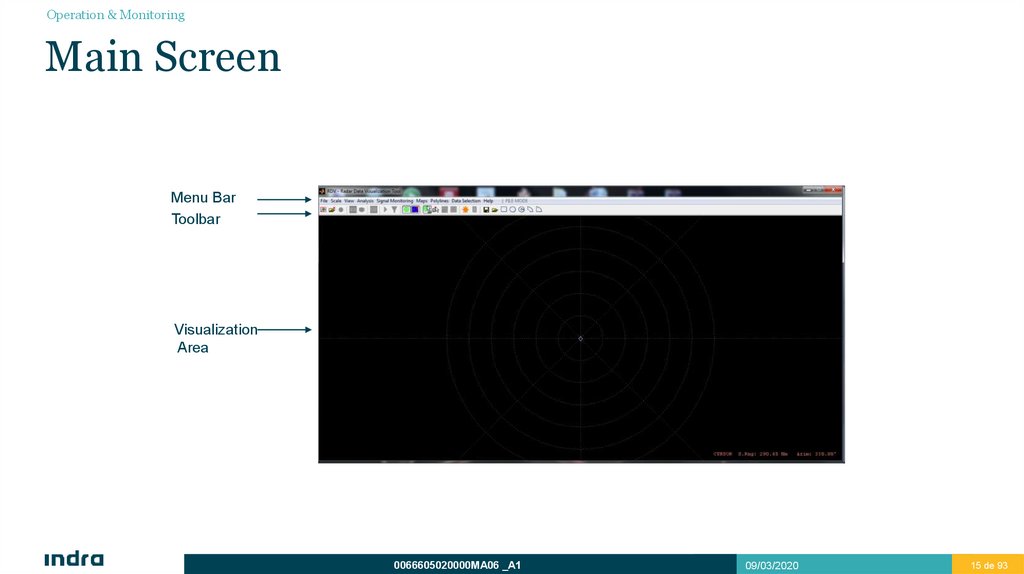
Operation & MonitoringMain Screen
Menu Bar
Toolbar
Visualization
Area
0066605020000MA06 _A1
09/03/2020
15 de 93
15
16.
Operation & MonitoringMain Screen
The main screen of the RDV shows three different areas:
Menu Bar:
Menus to access different application functions.
Toolbar on top:
Shortcut buttons for main functionalities.
Visualization Area:
Radar Data and Video Visualization.
0066605020000MA06 _A1
09/03/2020
16 de 93
16
17.
Operation & MonitoringMenu Bar
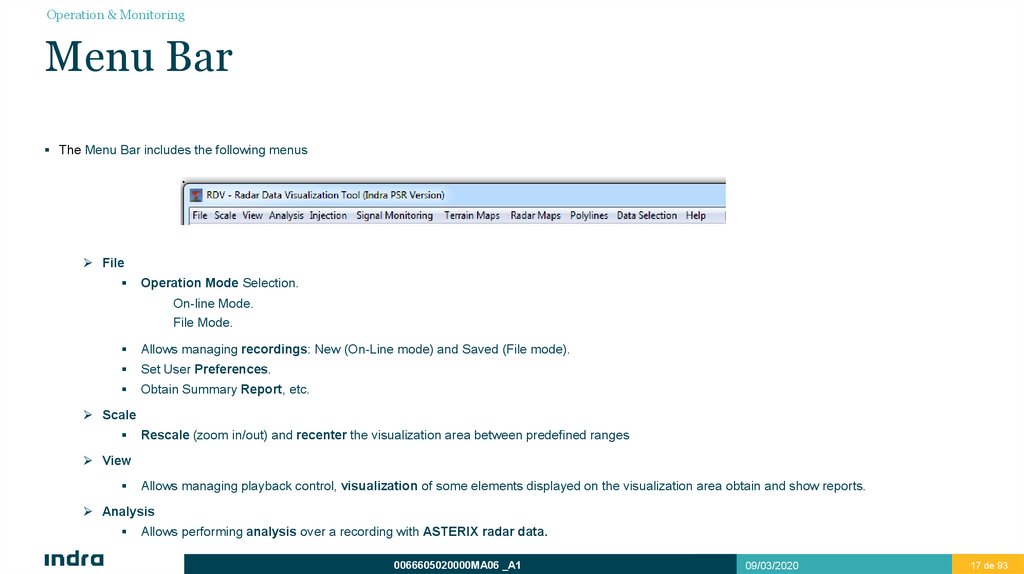
The Menu Bar includes the following menus
File
Operation Mode Selection.
On-line Mode.
File Mode.
Allows managing recordings: New (On-Line mode) and Saved (File mode).
Set User Preferences.
Obtain Summary Report, etc.
Scale
Rescale (zoom in/out) and recenter the visualization area between predefined ranges
View
Allows managing playback control, visualization of some elements displayed on the visualization area obtain and show reports.
Analysis
Allows performing analysis over a recording with ASTERIX radar data.
0066605020000MA06 _A1
09/03/2020
17 de 93
17
18.
Operation & MonitoringMenu Bar
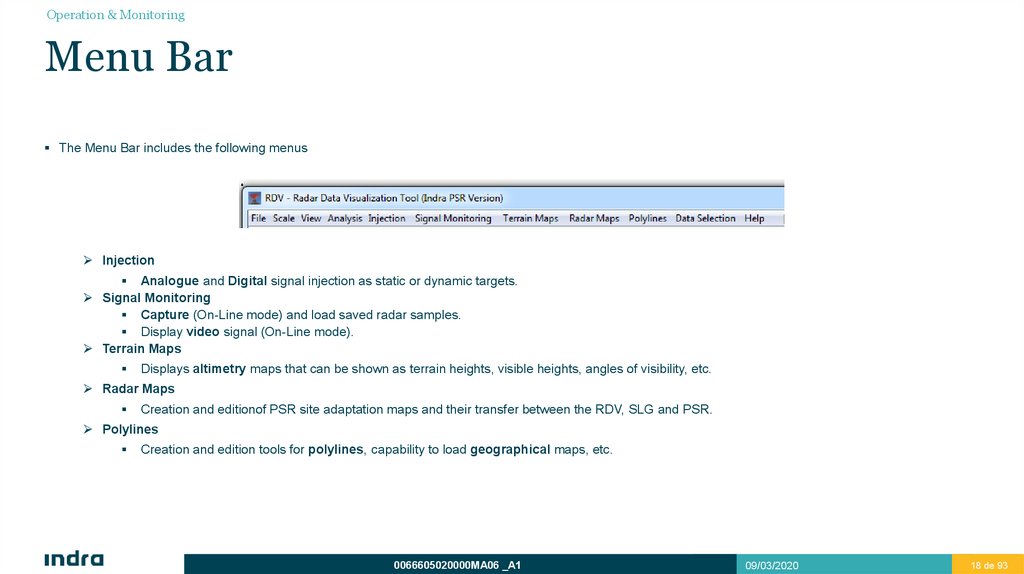
The Menu Bar includes the following menus
Injection
Analogue and Digital signal injection as static or dynamic targets.
Signal Monitoring
Capture (On-Line mode) and load saved radar samples.
Display video signal (On-Line mode).
Terrain Maps
Displays altimetry maps that can be shown as terrain heights, visible heights, angles of visibility, etc.
Radar Maps
Creation and editionof PSR site adaptation maps and their transfer between the RDV, SLG and PSR.
Polylines
Creation and edition tools for polylines, capability to load geographical maps, etc.
0066605020000MA06 _A1
09/03/2020
18 de 93
18
19.
Operation & MonitoringMenu Bar
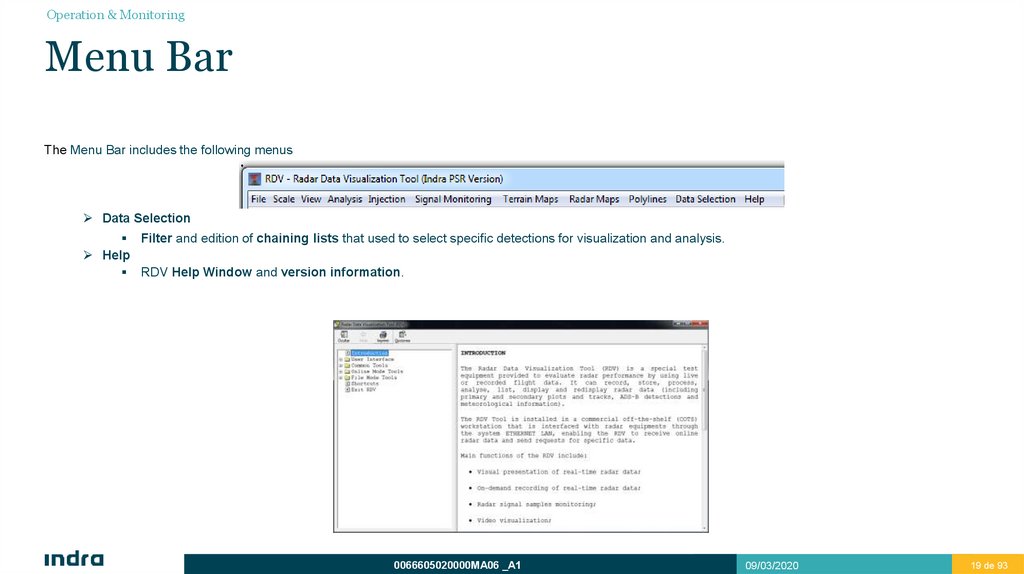
The Menu Bar includes the following menus
Data Selection
Filter and edition of chaining lists that used to select specific detections for visualization and analysis.
Help
RDV Help Window and version information.
0066605020000MA06 _A1
09/03/2020
19 de 93
19
20.
Operation & MonitoringMenu Bar
Menu File: General configuration menus. Includes the following options:
Set On-Line Mode: Displays real-time data when the RDV is properly connected to the radar.
Set File Mode: To analyse recordings, create detections chains, etc.
New Radar Recording: In On-line Mode, to configure new ASTERIX recordings.
Open Radar Data File: Opens an ASTERIX Data Recording used in the File Mode.
File Summary Report: Generates File with information about the recording.
ADS-B Data Visualization: To enable the visualization and recording of ADS-B ASTERIX data.
Preferences: To set preferences for lines, symbols, colors, traces, units, etc..
Report Configuration: Sets the information given in the Report List and Single Data.
Propagation Models: Sets the parameters for the propagation models.
SLG Login Configuration: Sets the user/password for the communication with the SLG.
Copy Figure to Clipboard: To use current figure in another program.
Save Figure As Image: Allows saving current figure in different formats.
Exit: Closes the application.
0066605020000MA06 _A1
09/03/2020
20 de 93
20
21.
Operation & MonitoringMenu Bar
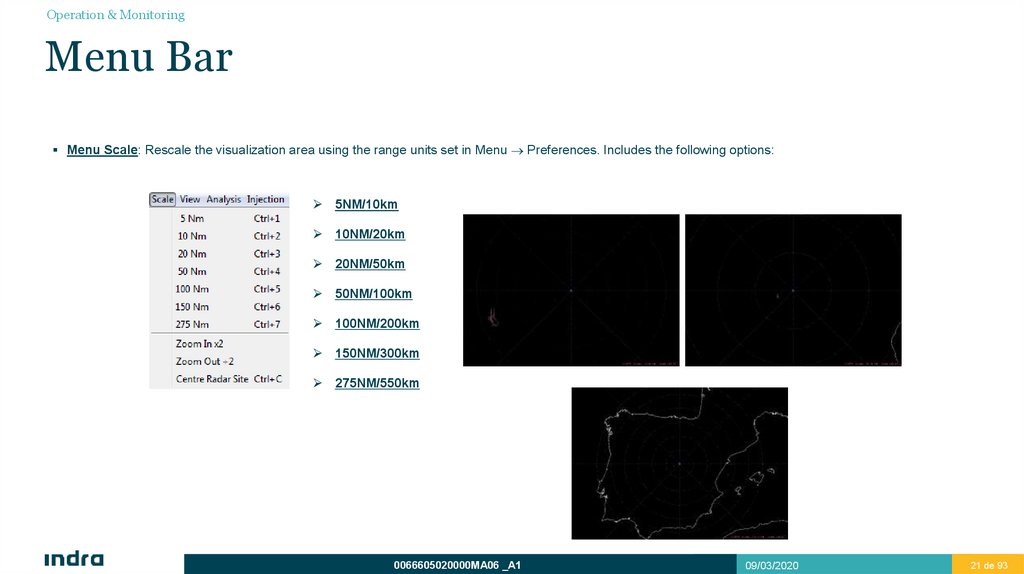
Menu Scale: Rescale the visualization area using the range units set in Menu Preferences. Includes the following options:
5NM/10km
10NM/20km
20NM/50km
50NM/100km
100NM/200km
150NM/300km
275NM/550km
0066605020000MA06 _A1
09/03/2020
21 de 93
21
22.
Operation & MonitoringMenu Bar
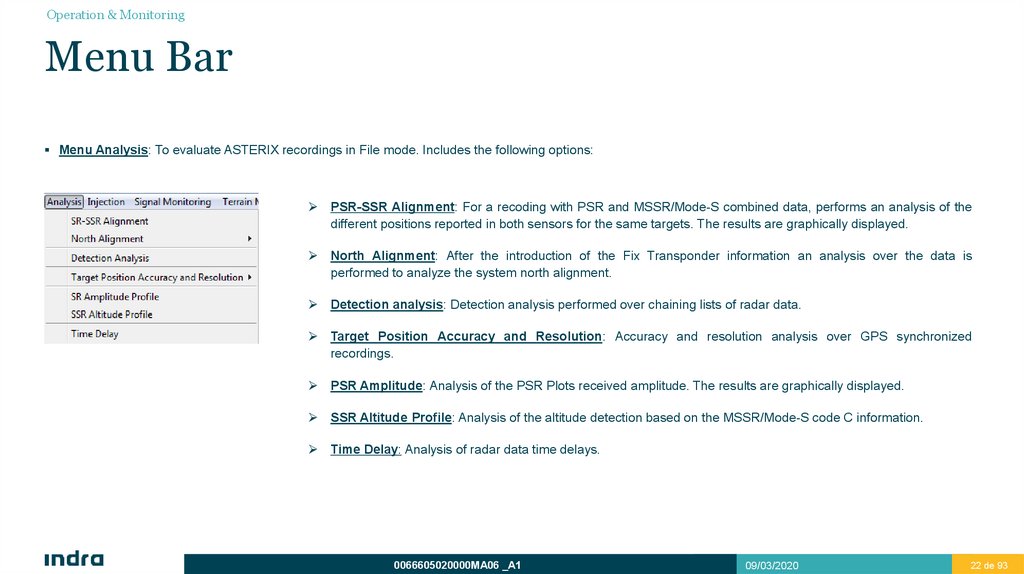
Menu Analysis: To evaluate ASTERIX recordings in File mode. Includes the following options:
PSR-SSR Alignment: For a recoding with PSR and MSSR/Mode-S combined data, performs an analysis of the
different positions reported in both sensors for the same targets. The results are graphically displayed.
North Alignment: After the introduction of the Fix Transponder information an analysis over the data is
performed to analyze the system north alignment.
Detection analysis: Detection analysis performed over chaining lists of radar data.
Target Position Accuracy and Resolution: Accuracy and resolution analysis over GPS synchronized
recordings.
PSR Amplitude: Analysis of the PSR Plots received amplitude. The results are graphically displayed.
SSR Altitude Profile: Analysis of the altitude detection based on the MSSR/Mode-S code C information.
Time Delay: Analysis of radar data time delays.
0066605020000MA06 _A1
09/03/2020
22 de 93
22
23.
Operation & MonitoringMenu Bar
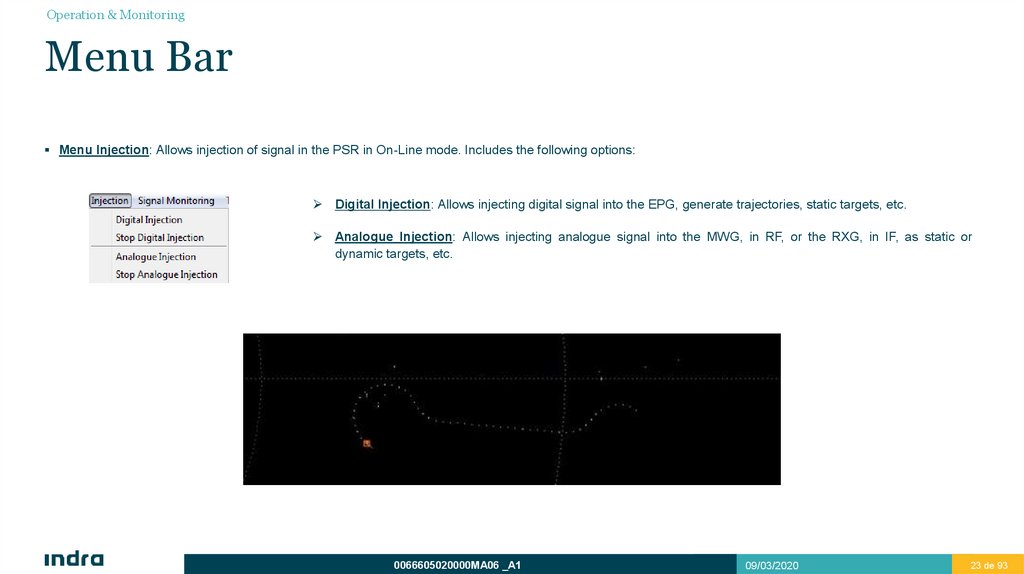
Menu Injection: Allows injection of signal in the PSR in On-Line mode. Includes the following options:
Digital Injection: Allows injecting digital signal into the EPG, generate trajectories, static targets, etc.
Analogue Injection: Allows injecting analogue signal into the MWG, in RF, or the RXG, in IF, as static or
dynamic targets, etc.
0066605020000MA06 _A1
09/03/2020
23 de 93
23
24.
Operation & MonitoringMenu Bar
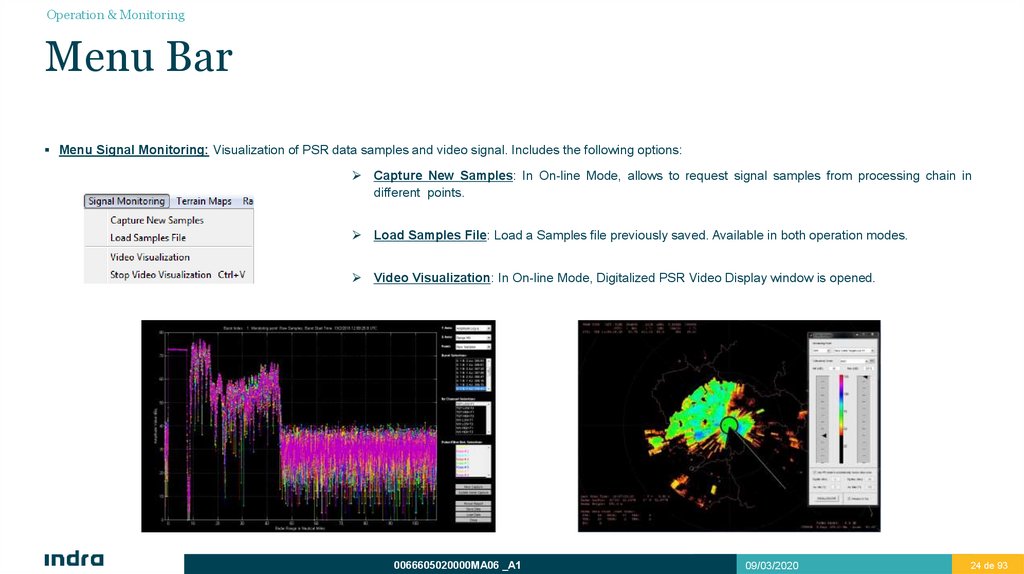
Menu Signal Monitoring: Visualization of PSR data samples and video signal. Includes the following options:
Capture New Samples: In On-line Mode, allows to request signal samples from processing chain in
different points.
Load Samples File: Load a Samples file previously saved. Available in both operation modes.
Video Visualization: In On-line Mode, Digitalized PSR Video Display window is opened.
0066605020000MA06 _A1
09/03/2020
24 de 93
24
25.
Operation & MonitoringMenu Bar
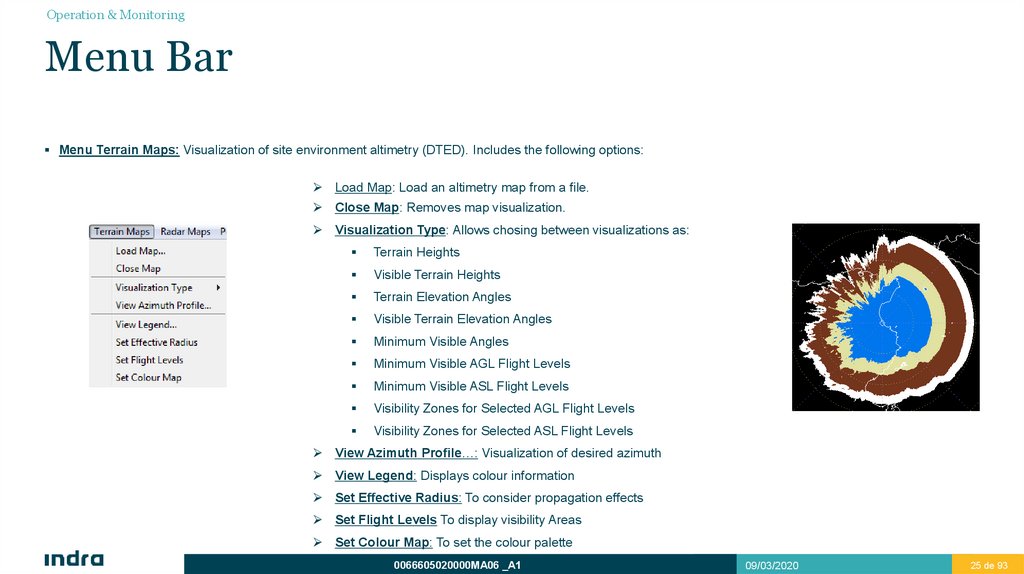
Menu Terrain Maps: Visualization of site environment altimetry (DTED). Includes the following options:
Load Map: Load an altimetry map from a file.
Close Map: Removes map visualization.
Visualization Type: Allows chosing between visualizations as:
Terrain Heights
Visible Terrain Heights
Terrain Elevation Angles
Visible Terrain Elevation Angles
Minimum Visible Angles
Minimum Visible AGL Flight Levels
Minimum Visible ASL Flight Levels
Visibility Zones for Selected AGL Flight Levels
Visibility Zones for Selected ASL Flight Levels
View Azimuth Profile…: Visualization of desired azimuth
View Legend: Displays colour information
Set Effective Radius: To consider propagation effects
Set Flight Levels To display visibility Areas
Set Colour Map: To set the colour palette
0066605020000MA06 _A1
09/03/2020
25 de 93
25
26.
Operation & MonitoringMenu Bar
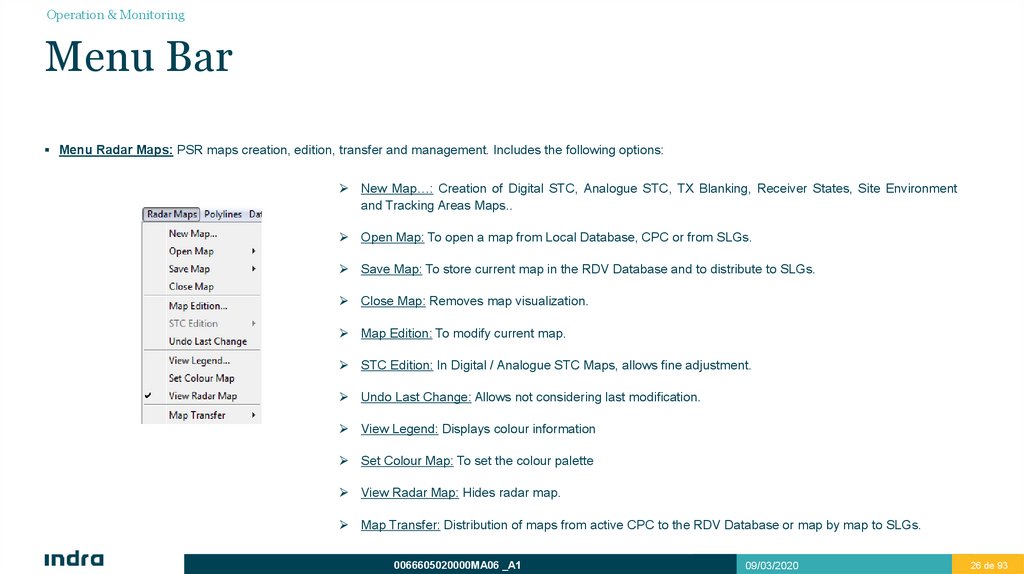
Menu Radar Maps: PSR maps creation, edition, transfer and management. Includes the following options:
New Map…: Creation of Digital STC, Analogue STC, TX Blanking, Receiver States, Site Environment
and Tracking Areas Maps..
Open Map: To open a map from Local Database, CPC or from SLGs.
Save Map: To store current map in the RDV Database and to distribute to SLGs.
Close Map: Removes map visualization.
Map Edition: To modify current map.
STC Edition: In Digital / Analogue STC Maps, allows fine adjustment.
Undo Last Change: Allows not considering last modification.
View Legend: Displays colour information
Set Colour Map: To set the colour palette
View Radar Map: Hides radar map.
Map Transfer: Distribution of maps from active CPC to the RDV Database or map by map to SLGs.
0066605020000MA06 _A1
09/03/2020
26 de 93
26
27.
Operation & MonitoringMenu Bar
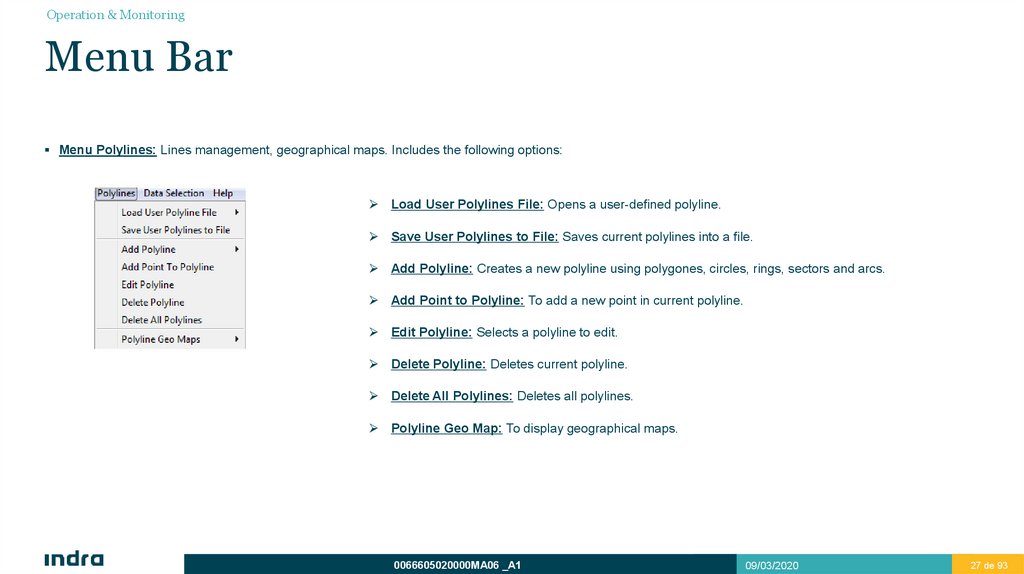
Menu Polylines: Lines management, geographical maps. Includes the following options:
Load User Polylines File: Opens a user-defined polyline.
Save User Polylines to File: Saves current polylines into a file.
Add Polyline: Creates a new polyline using polygones, circles, rings, sectors and arcs.
Add Point to Polyline: To add a new point in current polyline.
Edit Polyline: Selects a polyline to edit.
Delete Polyline: Deletes current polyline.
Delete All Polylines: Deletes all polylines.
Polyline Geo Map: To display geographical maps.
0066605020000MA06 _A1
09/03/2020
27 de 93
27
28.
Operation & MonitoringMenu Bar
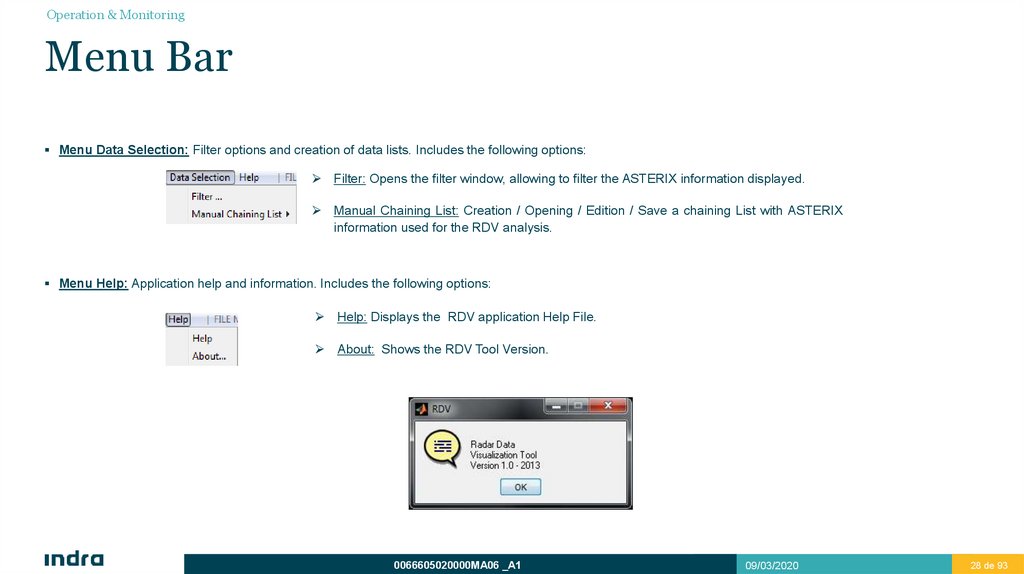
Menu Data Selection: Filter options and creation of data lists. Includes the following options:
Filter: Opens the filter window, allowing to filter the ASTERIX information displayed.
Manual Chaining List: Creation / Opening / Edition / Save a chaining List with ASTERIX
information used for the RDV analysis.
Menu Help: Application help and information. Includes the following options:
Help: Displays the RDV application Help File.
About: Shows the RDV Tool Version.
0066605020000MA06 _A1
09/03/2020
28 de 93
28
29.
Operation & MonitoringToolbar
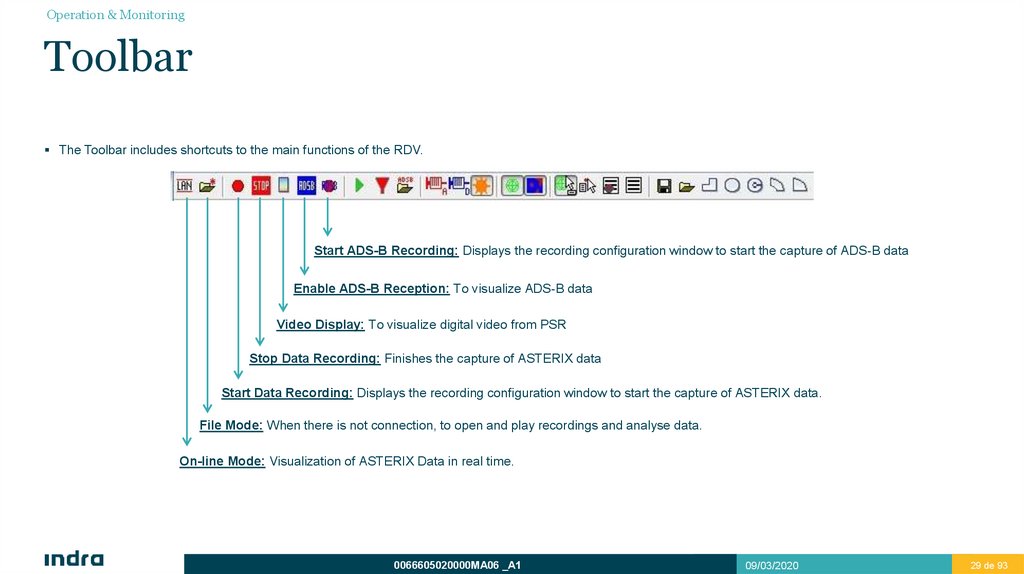
The Toolbar includes shortcuts to the main functions of the RDV.
Start ADS-B Recording: Displays the recording configuration window to start the capture of ADS-B data
Enable ADS-B Reception: To visualize ADS-B data
Video Display: To visualize digital video from PSR
Stop Data Recording: Finishes the capture of ASTERIX data
Start Data Recording: Displays the recording configuration window to start the capture of ASTERIX data.
File Mode: When there is not connection, to open and play recordings and analyse data.
On-line Mode: Visualization of ASTERIX Data in real time.
0066605020000MA06 _A1
09/03/2020
29 de 93
29
30.
Operation & MonitoringToolbar
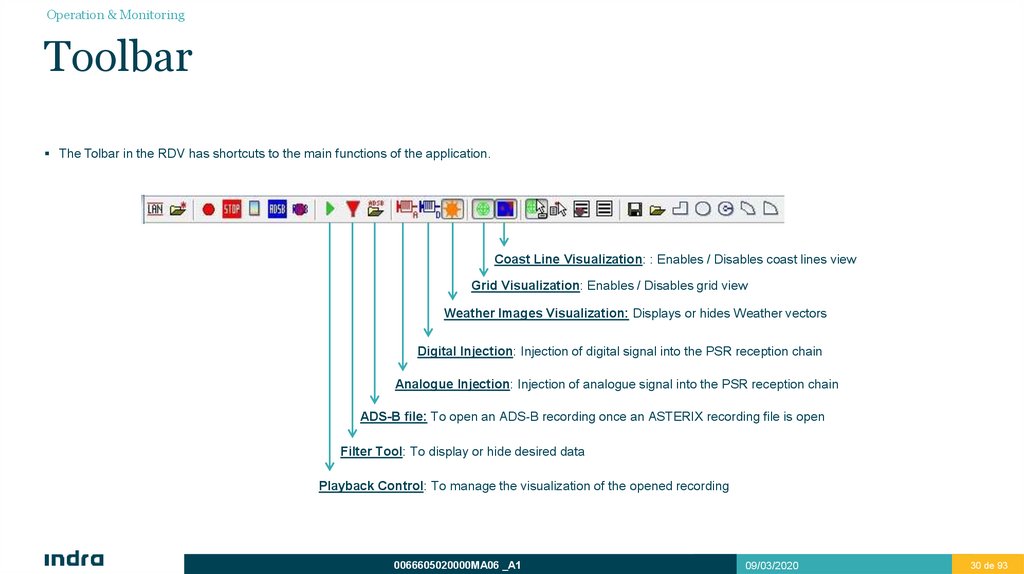
The Tolbar in the RDV has shortcuts to the main functions of the application.
Coast Line Visualization: : Enables / Disables coast lines view
Grid Visualization: Enables / Disables grid view
Weather Images Visualization: Displays or hides Weather vectors
Digital Injection: Injection of digital signal into the PSR reception chain
Analogue Injection: Injection of analogue signal into the PSR reception chain
ADS-B file: To open an ADS-B recording once an ASTERIX recording file is open
Filter Tool: To display or hide desired data
Playback Control: To manage the visualization of the opened recording
0066605020000MA06 _A1
09/03/2020
30 de 93
30
31.
Operation & MonitoringToolbar
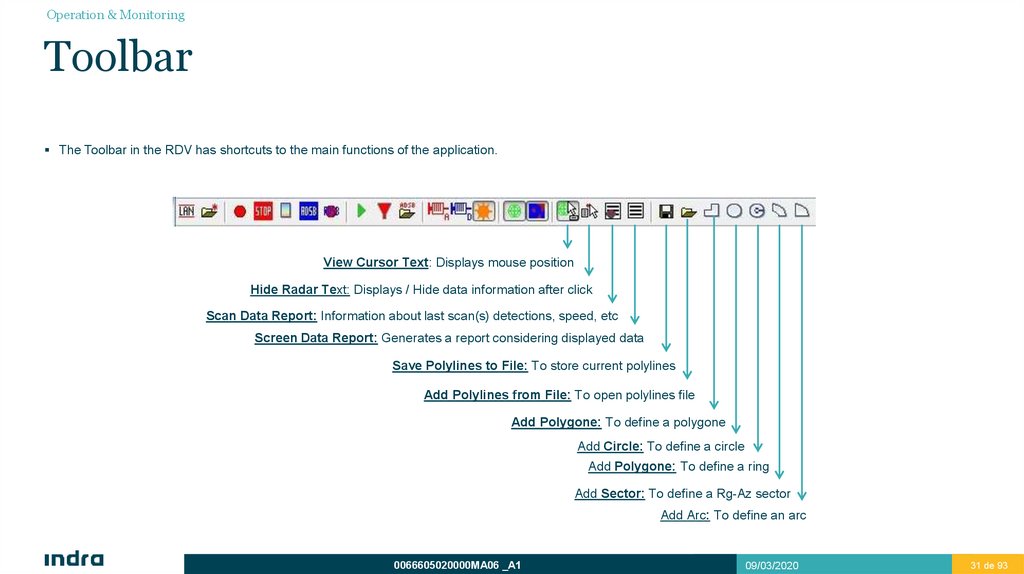
The Toolbar in the RDV has shortcuts to the main functions of the application.
View Cursor Text: Displays mouse position
Hide Radar Text: Displays / Hide data information after click
Scan Data Report: Information about last scan(s) detections, speed, etc
Screen Data Report: Generates a report considering displayed data
Save Polylines to File: To store current polylines
Add Polylines from File: To open polylines file
Add Polygone: To define a polygone
Add Circle: To define a circle
Add Polygone: To define a ring
Add Sector: To define a Rg-Az sector
Add Arc: To define an arc
0066605020000MA06 _A1
09/03/2020
31 de 93
31
32.
Operation ModeOperation Modes
On-Line Mode
File Mode
3
33.
Operation ModesOperation Modes
The RDV is able to work in two different modes:
On-line Mode.
When the RDV is connected to the Radar. Allows data display, capture of PSR data samples, digital video display, test signal injection, etc.
File Mode.
Opening a recording file. Allows recording playback, data analyses, etc.
0066605020000MA06 _A1
09/03/2020
33 de 93
33
34.
Operation ModesOn-Line Mode
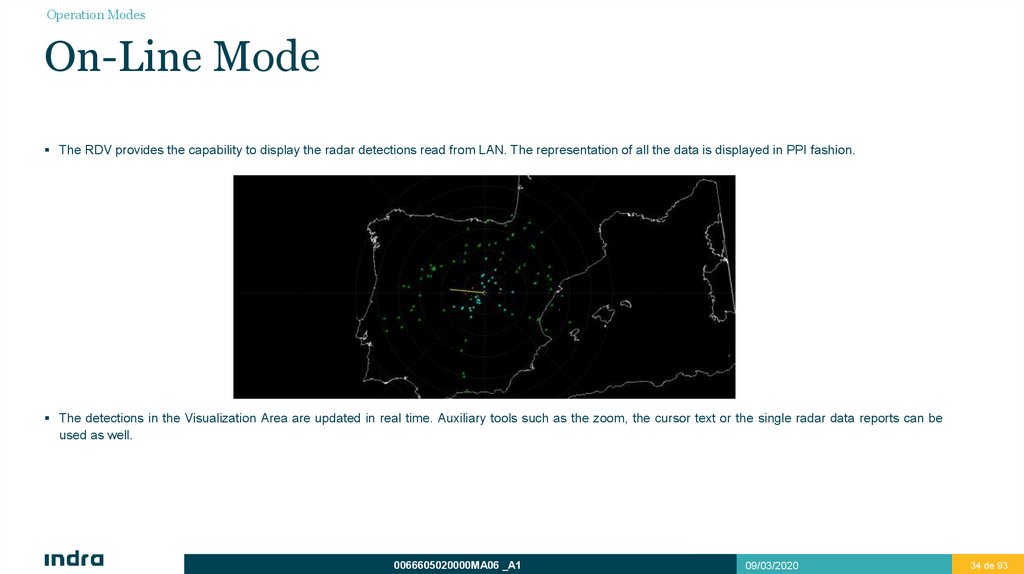
The RDV provides the capability to display the radar detections read from LAN. The representation of all the data is displayed in PPI fashion.
The detections in the Visualization Area are updated in real time. Auxiliary tools such as the zoom, the cursor text or the single radar data reports can be
used as well.
0066605020000MA06 _A1
09/03/2020
34 de 93
34
35.
Operation ModesOn-Line Mode
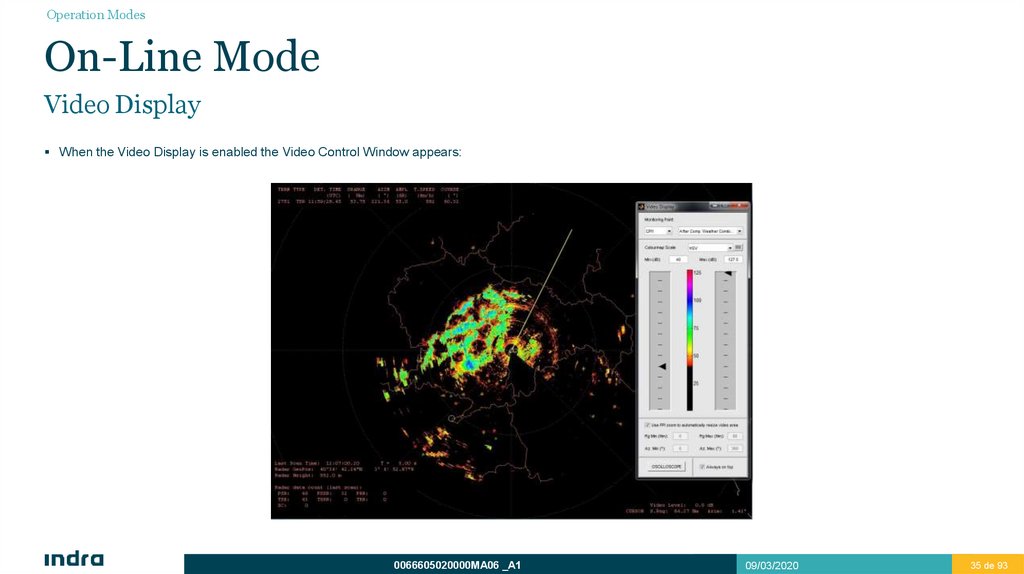
Video Display
When the Video Display is enabled the Video Control Window appears:
0066605020000MA06 _A1
09/03/2020
35 de 93
35
36.
Operation ModesOn-Line Mode
Video Display
By means the Video Display Tool, it is possible to select between different monitoring points, depending of chosen CPI (CPI1 or CPI2)
OFF
MTD0 to MTD7 (MTD5 in CPI2 selection) Filters
Max MTD0 to MTD7 (MTD5 in CPI2 selection)
Max MTD1 to MTD6 (MTD4 in CPI2 selection)
Max MTD2 to MTD5 (MTD3 in CPI2 selection)
Max MTD3/MTD4
Clutter Map Layer 0 to 3 (2 in CPI2 selection)
After Compression Target Low
After Compression Target High
After Compression Target Comb HL
After Compression Weather Low
After Compression Weather High
After Compression Comb. HL
Raw Video Target Low F1 / Raw Video Target Low F2
Raw Video Target High F1 / Raw Video Target High F2
Raw Video Weather Low F1 / Raw Video Weather Low F2
Raw Video Weather High F1/ Raw Video Weather High F2
Weather Filter 0 to 3
Weather SP Level Filter 0 to 3
Target Detections after RCFAR
Target Detections after CMCFAR
Target Detections after STC Dig.
Second Time Around Returns
Third Time Around Returns
0066605020000MA06 _A1
09/03/2020
36 de 93
36
37.
Operation ModesOn-Line Mode
Video Display
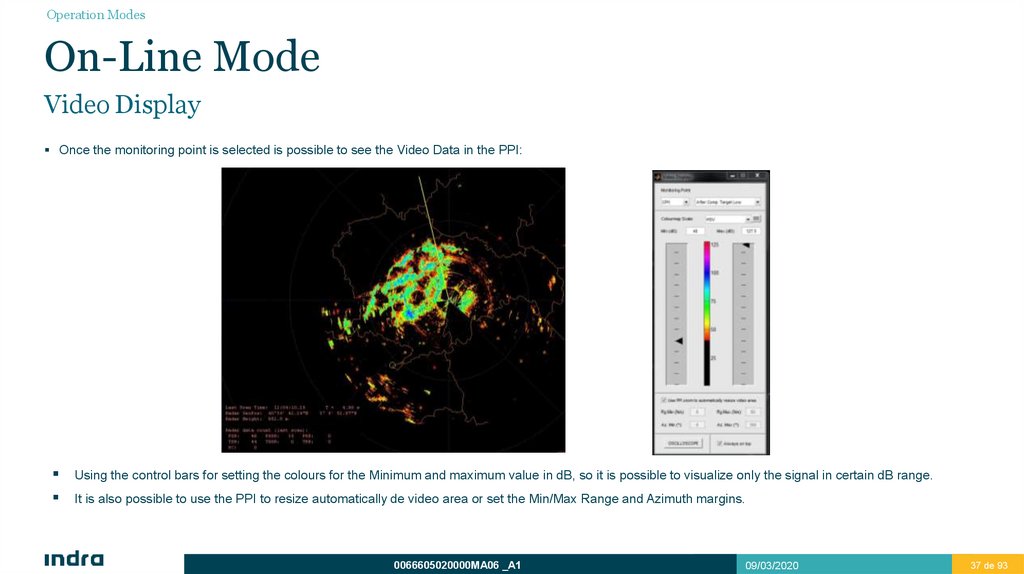
Once the monitoring point is selected is possible to see the Video Data in the PPI:
Using the control bars for setting the colours for the Minimum and maximum value in dB, so it is possible to visualize only the signal in certain dB range.
It is also possible to use the PPI to resize automatically de video area or set the Min/Max Range and Azimuth margins.
0066605020000MA06 _A1
09/03/2020
37 de 93
37
38.
Operation ModesOn-Line Mode
Video Display
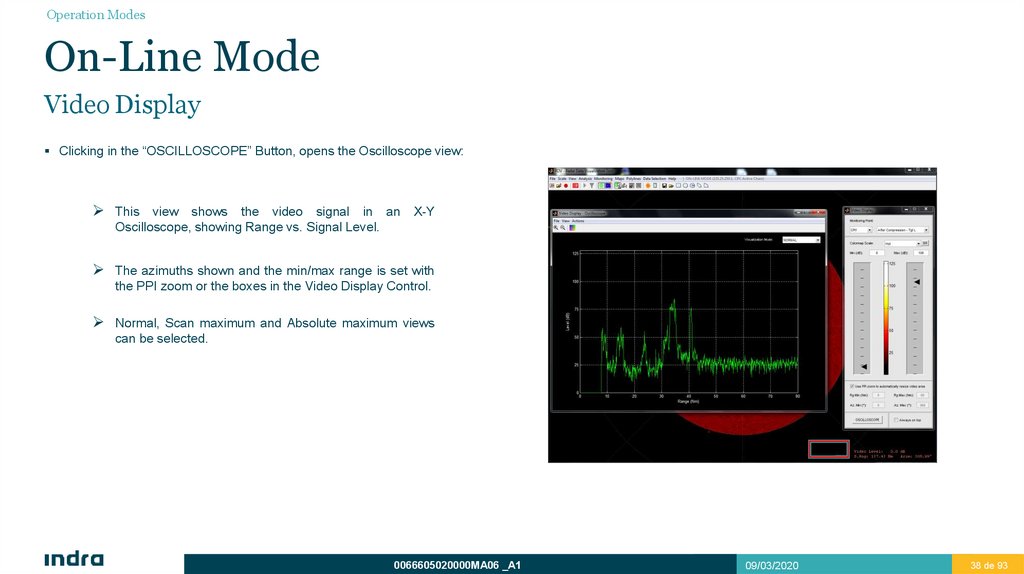
Clicking in the “OSCILLOSCOPE” Button, opens the Oscilloscope view:
This view shows the video signal in an X-Y
Oscilloscope, showing Range vs. Signal Level.
The azimuths shown and the min/max range is set with
the PPI zoom or the boxes in the Video Display Control.
Normal, Scan maximum and Absolute maximum views
can be selected.
0066605020000MA06 _A1
09/03/2020
38 de 93
38
39.
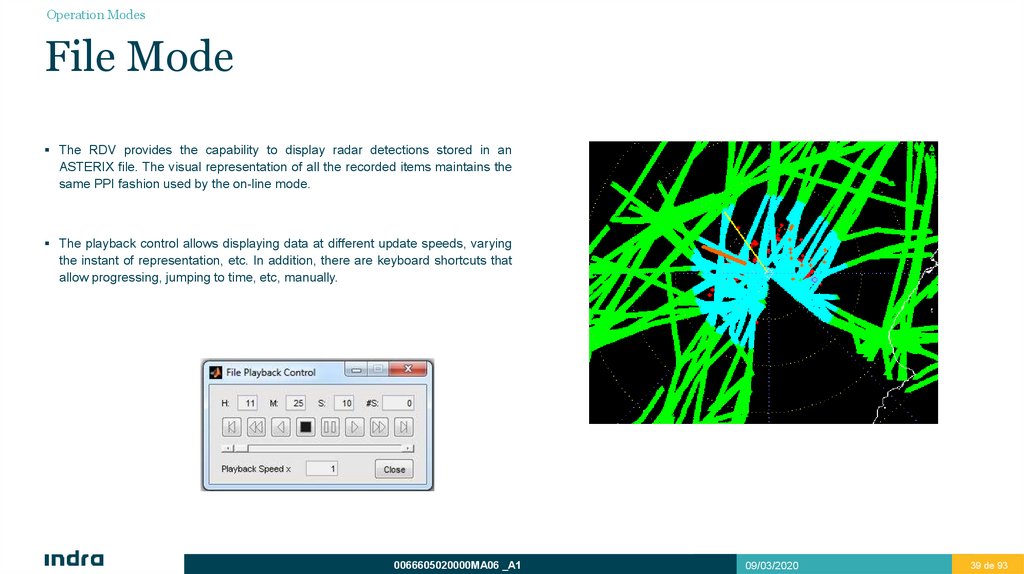
Operation ModesFile Mode
The RDV provides the capability to display radar detections stored in an
ASTERIX file. The visual representation of all the recorded items maintains the
same PPI fashion used by the on-line mode.
The playback control allows displaying data at different update speeds, varying
the instant of representation, etc. In addition, there are keyboard shortcuts that
allow progressing, jumping to time, etc, manually.
0066605020000MA06 _A1
09/03/2020
39 de 93
39
40.
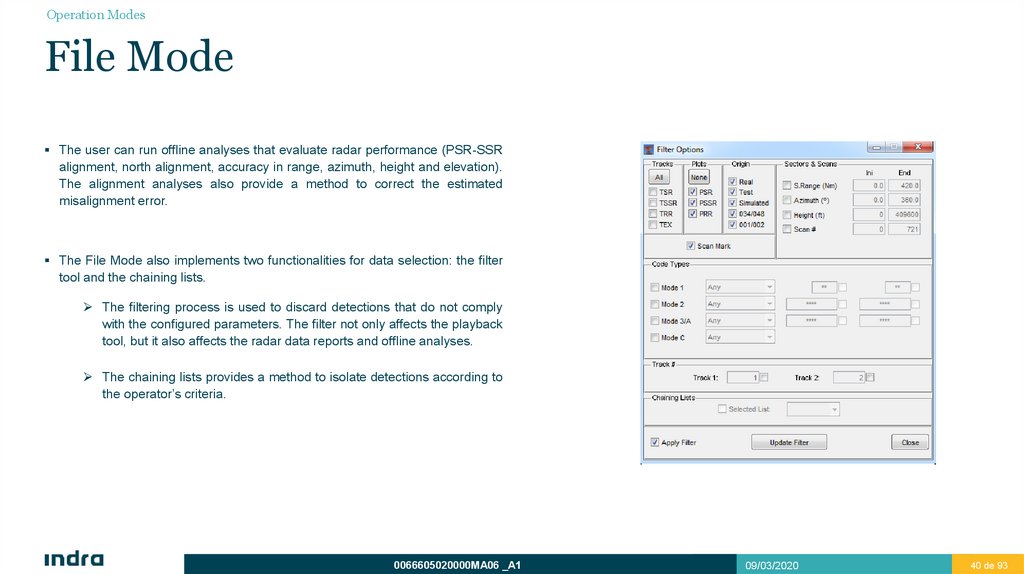
Operation ModesFile Mode
The user can run offline analyses that evaluate radar performance (PSR-SSR
alignment, north alignment, accuracy in range, azimuth, height and elevation).
The alignment analyses also provide a method to correct the estimated
misalignment error.
The File Mode also implements two functionalities for data selection: the filter
tool and the chaining lists.
The filtering process is used to discard detections that do not comply
with the configured parameters. The filter not only affects the playback
tool, but it also affects the radar data reports and offline analyses.
The chaining lists provides a method to isolate detections according to
the operator’s criteria.
0066605020000MA06 _A1
09/03/2020
40 de 93
40
41.
AnalysisPSR-SSR Range Alignment
North Alignment
Detection
Target Position Accuracy and Resolution
PSR Amplitude Profile
SSR Altitude Profile
Time Delay
4
42.
AnalysisPSR-SSR Range Alignment
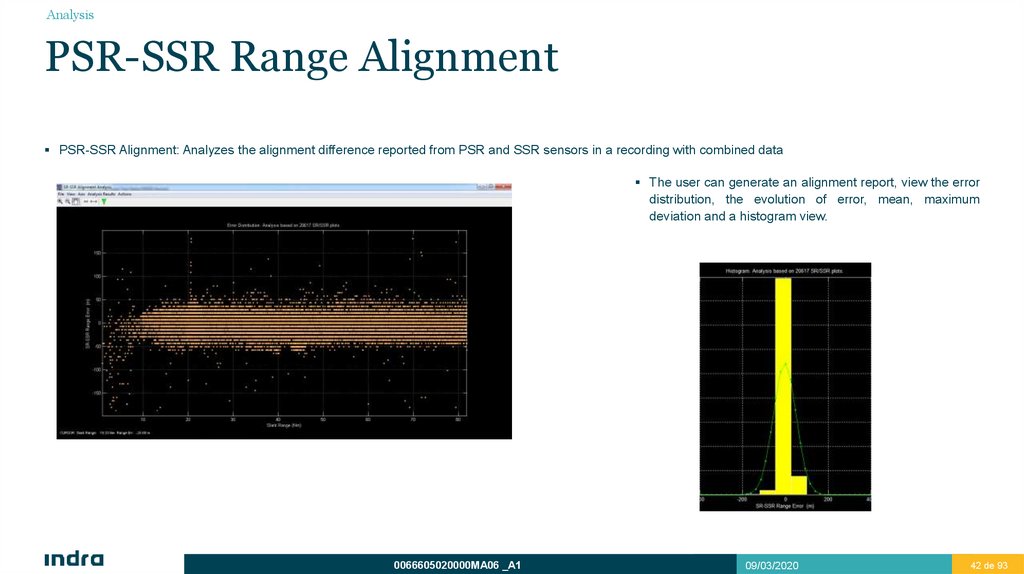
PSR-SSR Alignment: Analyzes the alignment difference reported from PSR and SSR sensors in a recording with combined data
The user can generate an alignment report, view the error
distribution, the evolution of error, mean, maximum
deviation and a histogram view.
0066605020000MA06 _A1
09/03/2020
42 de 93
42
43.
AnalysisNorth Alignment
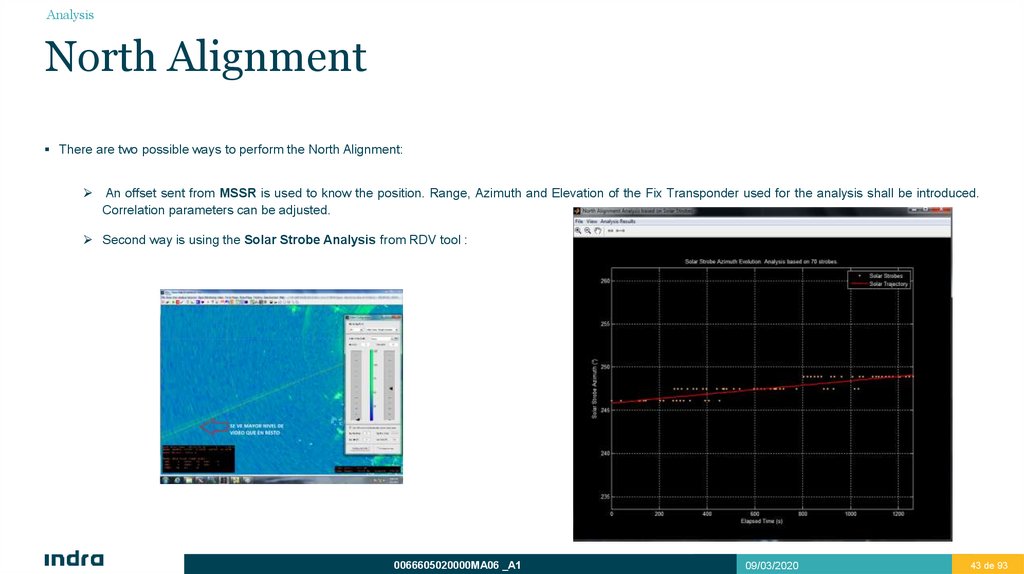
There are two possible ways to perform the North Alignment:
An offset sent from MSSR is used to know the position. Range, Azimuth and Elevation of the Fix Transponder used for the analysis shall be introduced.
Correlation parameters can be adjusted.
Second way is using the Solar Strobe Analysis from RDV tool :
0066605020000MA06 _A1
09/03/2020
43 de 93
43
44.
AnalysisDetection
The RDV analyses detection of a radar data chain previously created from a recording.
First it is necessary to create a new list from the Data Selection Menu.
Then, the analysis can be run.
0066605020000MA06 _A1
09/03/2020
44 de 93
44
45.
AnalysisDetection
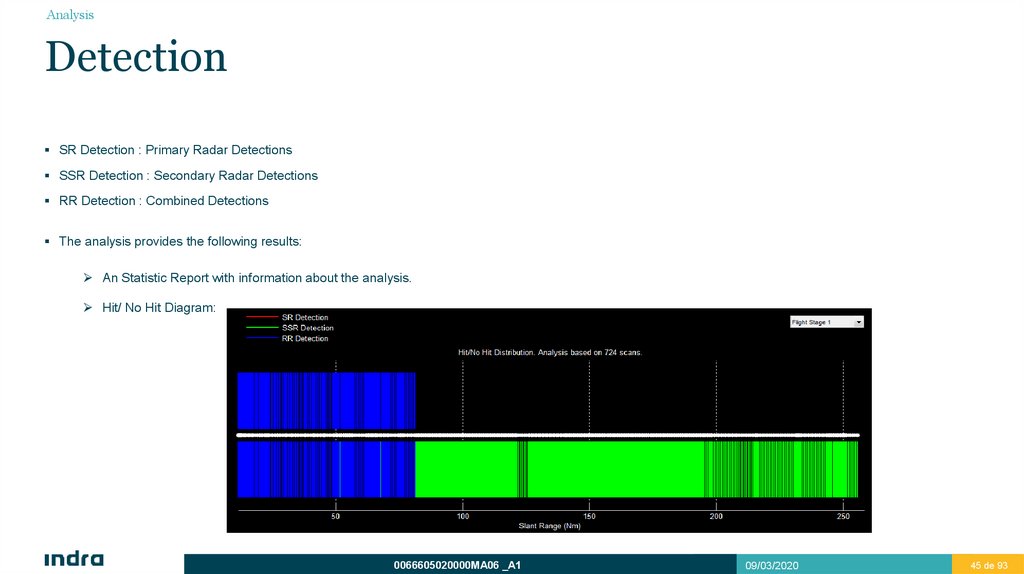
SR Detection : Primary Radar Detections
SSR Detection : Secondary Radar Detections
RR Detection : Combined Detections
The analysis provides the following results:
An Statistic Report with information about the analysis.
Hit/ No Hit Diagram:
0066605020000MA06 _A1
09/03/2020
45 de 93
45
46.
AnalysisDetection
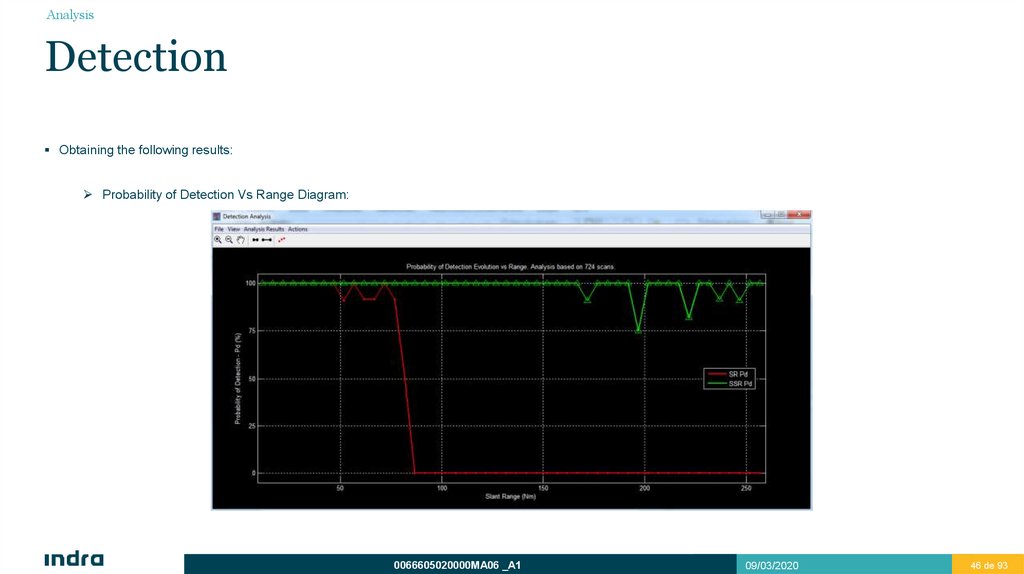
Obtaining the following results:
Probability of Detection Vs Range Diagram:
0066605020000MA06 _A1
09/03/2020
46 de 93
46
47.
AnalysisTarget Position Accuracy and Resolution
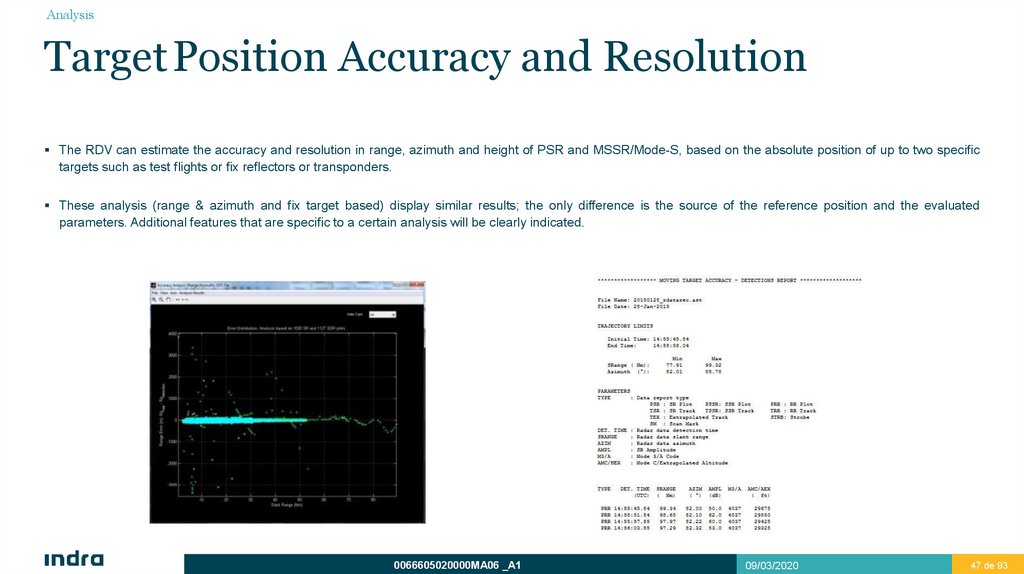
The RDV can estimate the accuracy and resolution in range, azimuth and height of PSR and MSSR/Mode-S, based on the absolute position of up to two specific
targets such as test flights or fix reflectors or transponders.
These analysis (range & azimuth and fix target based) display similar results; the only difference is the source of the reference position and the evaluated
parameters. Additional features that are specific to a certain analysis will be clearly indicated.
0066605020000MA06 _A1
09/03/2020
47 de 93
47
48.
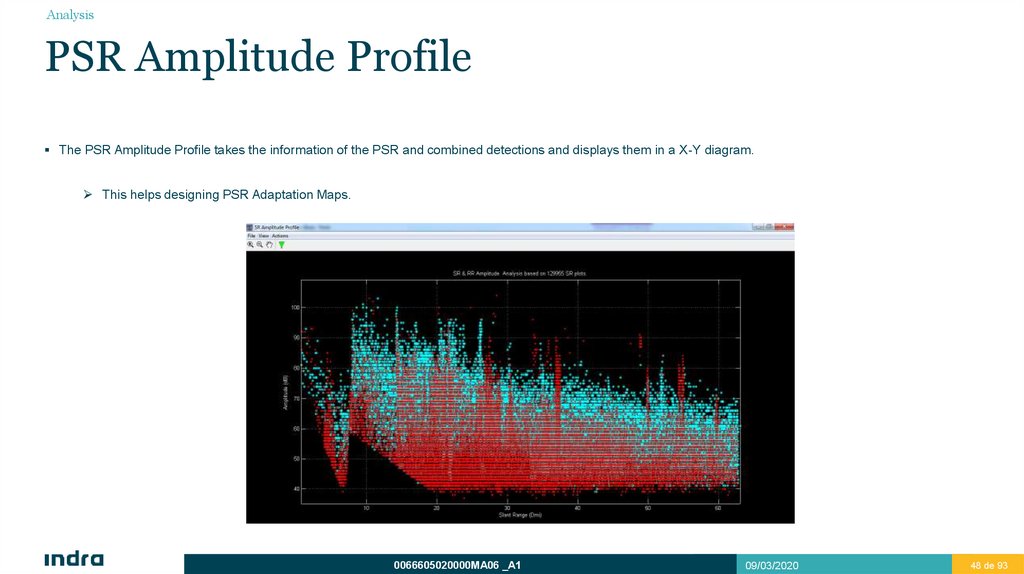
AnalysisPSR Amplitude Profile
The PSR Amplitude Profile takes the information of the PSR and combined detections and displays them in a X-Y diagram.
This helps designing PSR Adaptation Maps.
0066605020000MA06 _A1
09/03/2020
48 de 93
48
49.
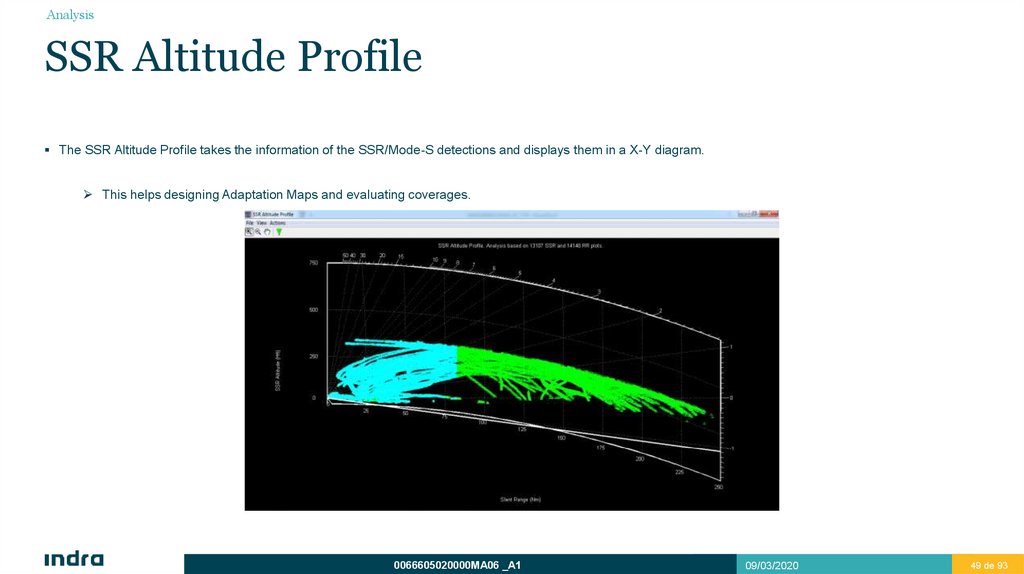
AnalysisSSR Altitude Profile
The SSR Altitude Profile takes the information of the SSR/Mode-S detections and displays them in a X-Y diagram.
This helps designing Adaptation Maps and evaluating coverages.
0066605020000MA06 _A1
09/03/2020
49 de 93
49
50.
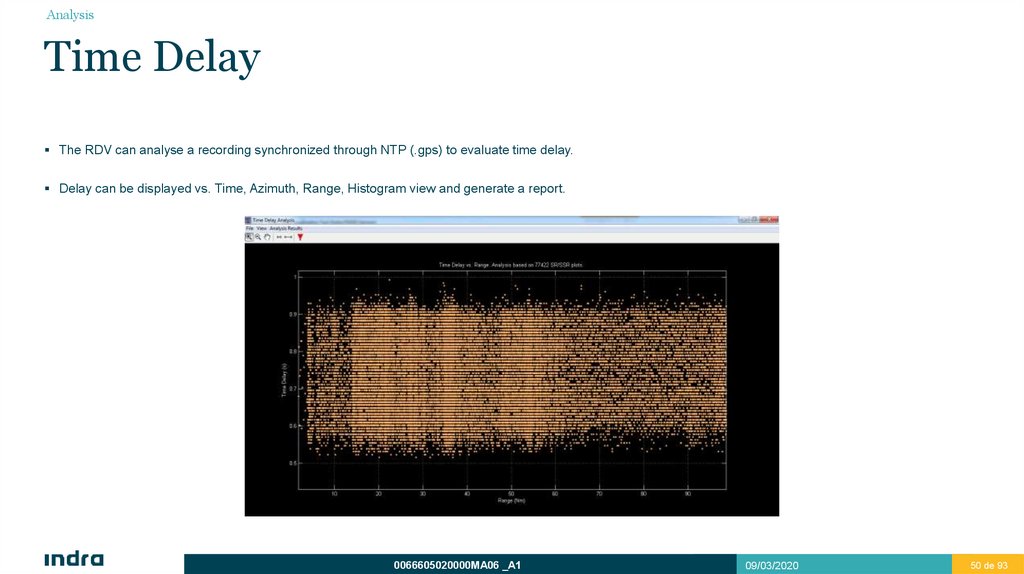
AnalysisTime Delay
The RDV can analyse a recording synchronized through NTP (.gps) to evaluate time delay.
Delay can be displayed vs. Time, Azimuth, Range, Histogram view and generate a report.
0066605020000MA06 _A1
09/03/2020
50 de 93
50
51.
RDV ManagementMaps
Functionalities
Map Modification Criteria
5
52.
RDV ManagementMaps
Optimization Maps
Processing maps
In addition to tilt selection and CFAR sensitivity values configuration, system optimization is strongly related with processing maps edition through RDV:
Processing Map
Main Edition Objective
Receiver Status Map
Configure High/Long Beam
Analog STC Map
RF Attenuation
Digital STC Map
Minimum Threshold for Target Detection
Site Environment Map
CFAR Processing Election
Tracking Zones Map
Special Areas
Transmission Blanking Map
Non Radiation Azimuths
0066605020000MA06 _A1
09/03/2020
52 de 93
52
53.
RDV ManagementMaps
Optimization Maps
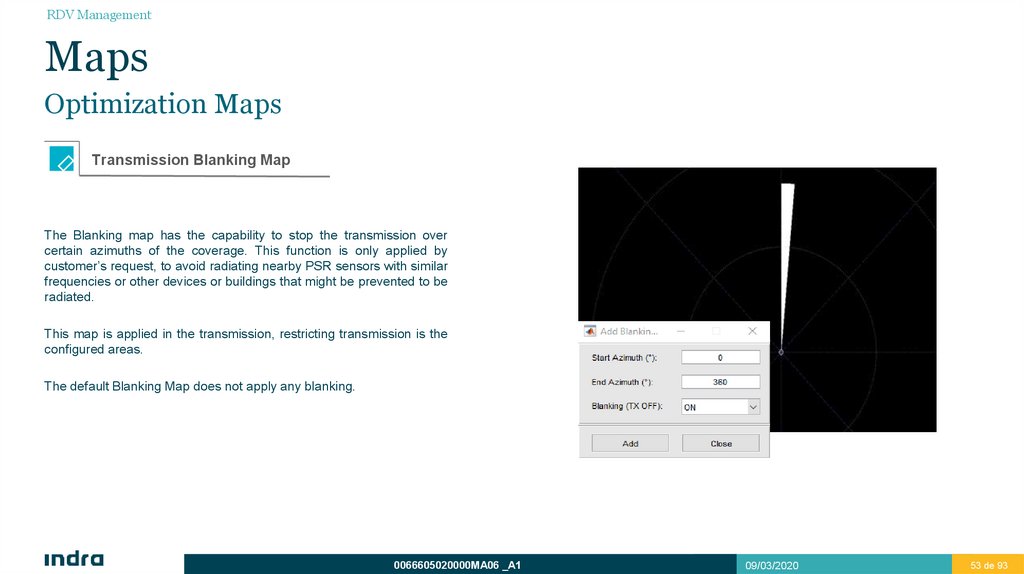
Transmission Blanking Map
The Blanking map has the capability to stop the transmission over
certain azimuths of the coverage. This function is only applied by
customer’s request, to avoid radiating nearby PSR sensors with similar
frequencies or other devices or buildings that might be prevented to be
radiated.
This map is applied in the transmission, restricting transmission is the
configured areas.
The default Blanking Map does not apply any blanking.
0066605020000MA06 _A1
09/03/2020
53 de 93
53
54.
RDV ManagementMaps
Optimization Maps
Analog STC Map
The analog STC Map is usually configured the first one by following the next tips:
Depending on the antenna rotation speed it must be configured an attenuation for the long pulse transmission in order to prevent failures in the
reception chain.
Several Signal Monitoring should be done in case of presence of RX Saturation. This monitoring will help in discovering the areas where Analog
STC should be increased to avoid that RX Saturation.
Once the long pulse is attenuated to avoid RX damage and there is no RX saturation the Analog STC Map is completed.
It is compulsory to analyze that the modification of the map does not affect the PD obtained before the modification.
0066605020000MA06 _A1
09/03/2020
54 de 93
54
55.
RDV ManagementMaps
Optimization Maps
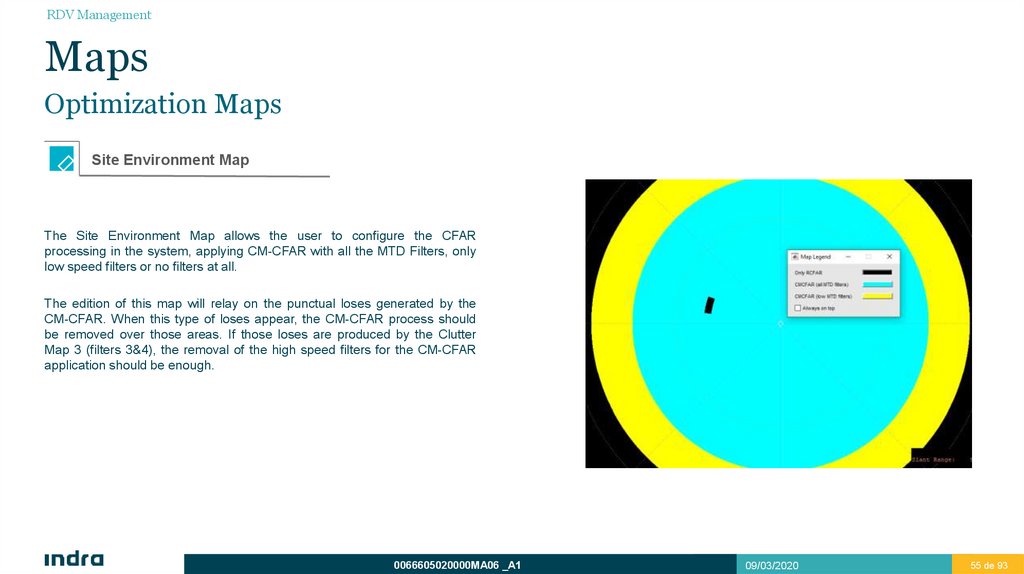
Site Environment Map
The Site Environment Map allows the user to configure the CFAR
processing in the system, applying CM-CFAR with all the MTD Filters, only
low speed filters or no filters at all.
The edition of this map will relay on the punctual loses generated by the
CM-CFAR. When this type of loses appear, the CM-CFAR process should
be removed over those areas. If those loses are produced by the Clutter
Map 3 (filters 3&4), the removal of the high speed filters for the CM-CFAR
application should be enough.
0066605020000MA06 _A1
09/03/2020
55 de 93
55
56.
RDV ManagementMaps
Optimization Maps
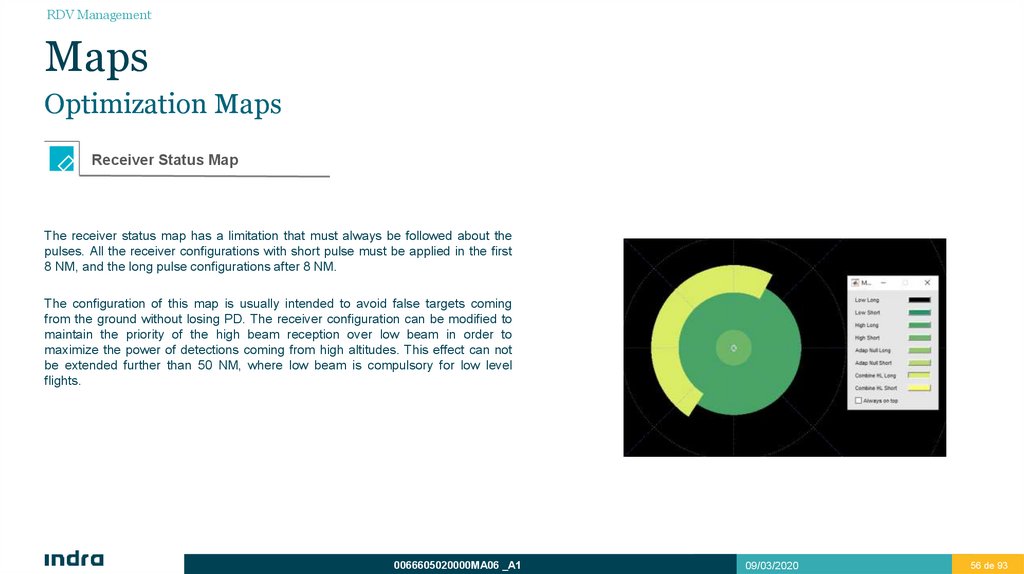
Receiver Status Map
The receiver status map has a limitation that must always be followed about the
pulses. All the receiver configurations with short pulse must be applied in the first
8 NM, and the long pulse configurations after 8 NM.
The configuration of this map is usually intended to avoid false targets coming
from the ground without losing PD. The receiver configuration can be modified to
maintain the priority of the high beam reception over low beam in order to
maximize the power of detections coming from high altitudes. This effect can not
be extended further than 50 NM, where low beam is compulsory for low level
flights.
0066605020000MA06 _A1
09/03/2020
56 de 93
56
57.
RDV ManagementMaps
Optimization Maps
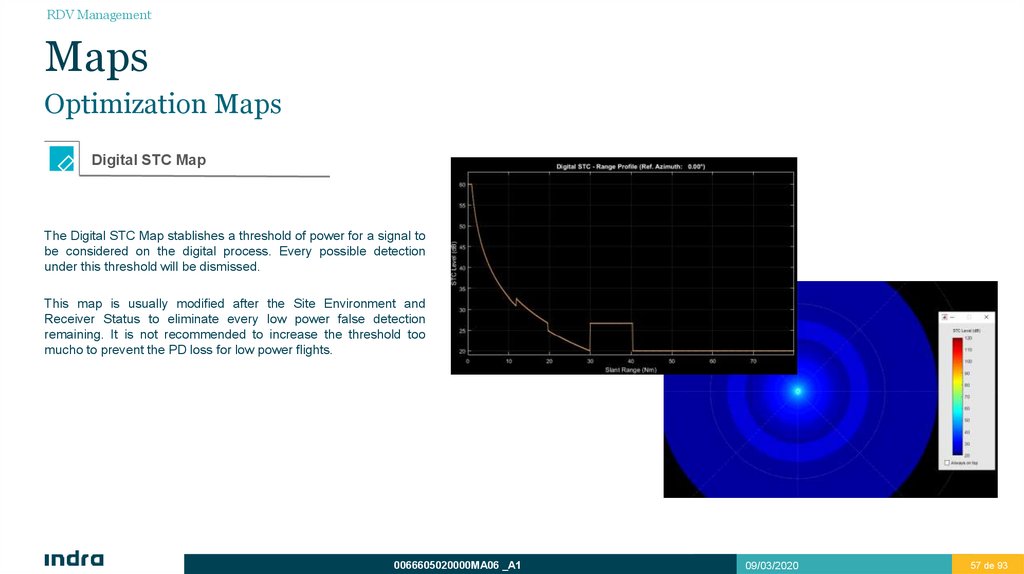
Digital STC Map
The Digital STC Map stablishes a threshold of power for a signal to
be considered on the digital process. Every possible detection
under this threshold will be dismissed.
This map is usually modified after the Site Environment and
Receiver Status to eliminate every low power false detection
remaining. It is not recommended to increase the threshold too
mucho to prevent the PD loss for low power flights.
0066605020000MA06 _A1
09/03/2020
57 de 93
57
58.
RDV ManagementMaps
Optimization Maps
Tracking Areas Map
The tracking areas map is used to create specific areas with special tracking
conditions, filtering detections by speed, course variation, acceleration… Several
parameters can be modified to filter chained plots with characteristics uncommon
for flying vehicles, such us speeds under a low threshold or over a high threshold,
sudden course variations, high acceleration…
Also, some areas with special treatments can be created, such as:
Non Automatic Initialization
Blanking
Reflections
0066605020000MA06 _A1
09/03/2020
58 de 93
58
59.
RDV ManagementMaps
Creating and Sending
RDV
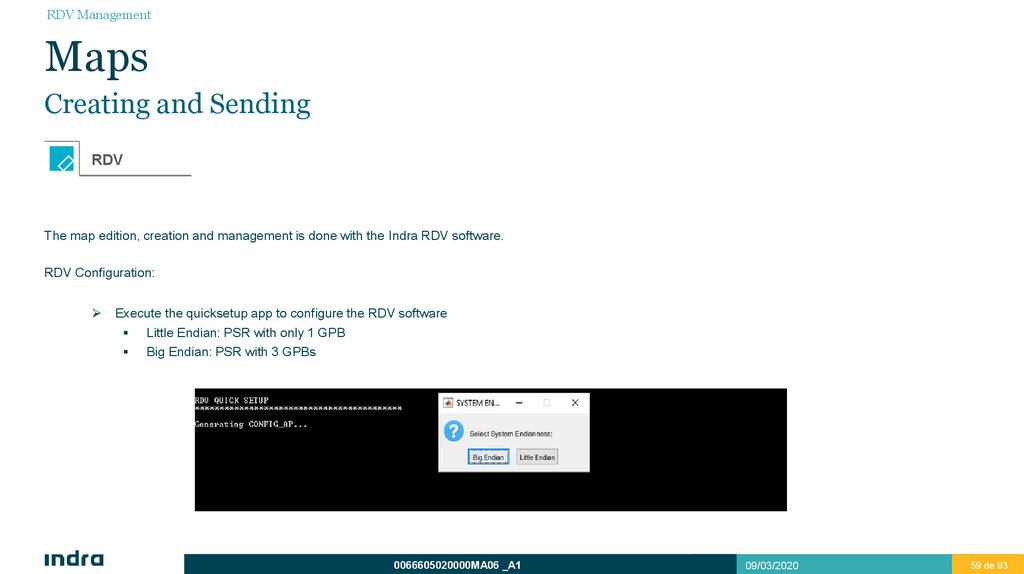
The map edition, creation and management is done with the Indra RDV software.
RDV Configuration:
Execute the quicksetup app to configure the RDV software
Little Endian: PSR with only 1 GPB
Big Endian: PSR with 3 GPBs
0066605020000MA06 _A1
09/03/2020
59 de 93
59
60.
RDV ManagementMaps
Creating and Sending
Create a New Map on RDV
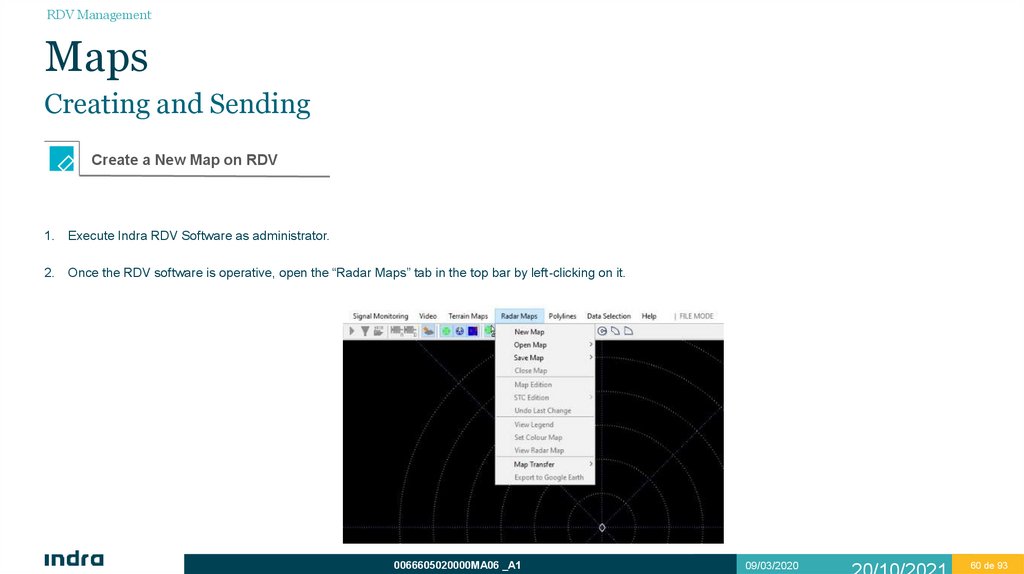
1. Execute Indra RDV Software as administrator.
2. Once the RDV software is operative, open the “Radar Maps” tab in the top bar by left-clicking on it.
0066605020000MA06 _A1
09/03/2020
60 de 93
60
61.
RDV ManagementMaps
Creating and Sending
Create a New Map on RDV
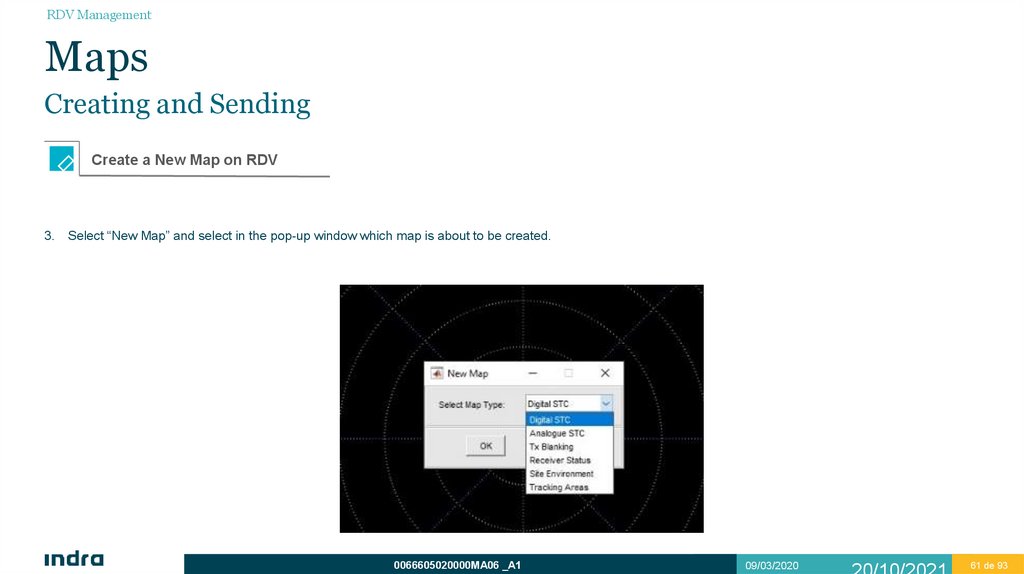
3. Select “New Map” and select in the pop-up window which map is about to be created.
0066605020000MA06 _A1
09/03/2020
61 de 93
61
62.
RDV ManagementMaps
Creating and Sending
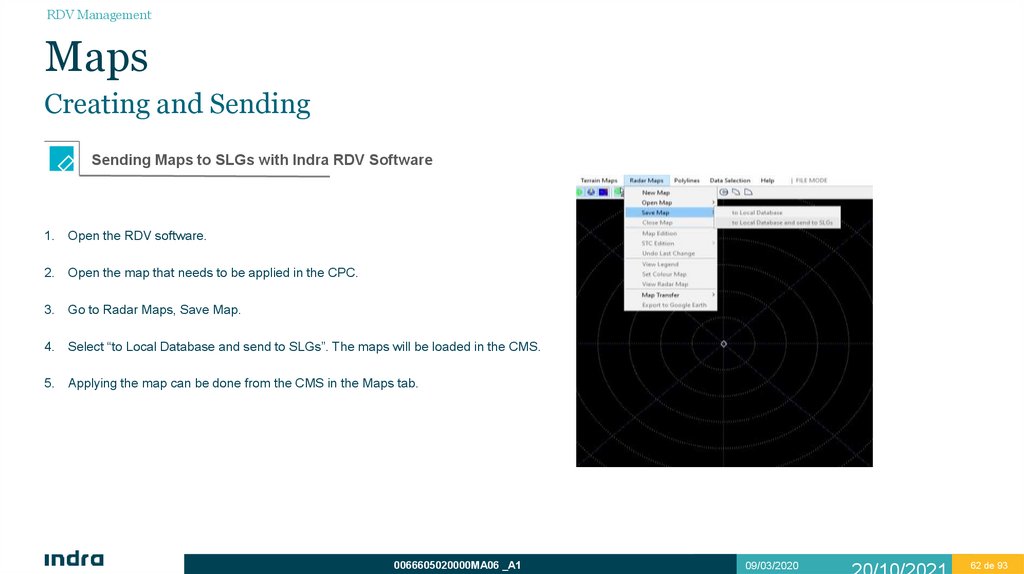
Sending Maps to SLGs with Indra RDV Software
1. Open the RDV software.
2. Open the map that needs to be applied in the CPC.
3. Go to Radar Maps, Save Map.
4. Select “to Local Database and send to SLGs”. The maps will be loaded in the CMS.
5. Applying the map can be done from the CMS in the Maps tab.
0066605020000MA06 _A1
09/03/2020
62 de 93
62
63.
RDVMonitoring
64.
RDV ManagementFunctionalities
RDV Monitoring
Signal Monitoring
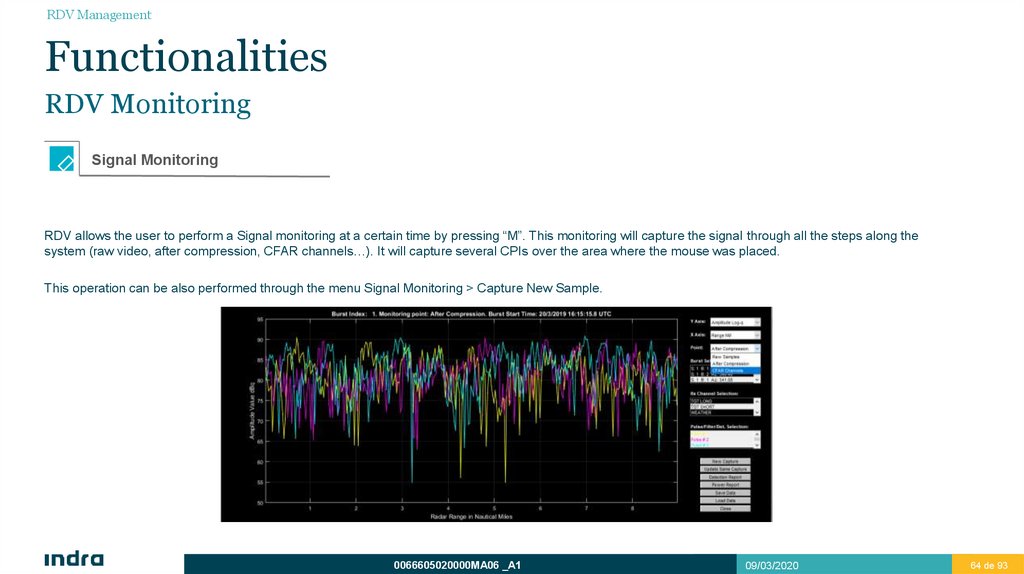
RDV allows the user to perform a Signal monitoring at a certain time by pressing “M”. This monitoring will capture the signal through all the steps along the
system (raw video, after compression, CFAR channels…). It will capture several CPIs over the area where the mouse was placed.
This operation can be also performed through the menu Signal Monitoring > Capture New Sample.
0066605020000MA06 _A1
09/03/2020
64 de 93
64
65.
RDV ManagementFunctionalities
RDV Monitoring
Signal Monitoring
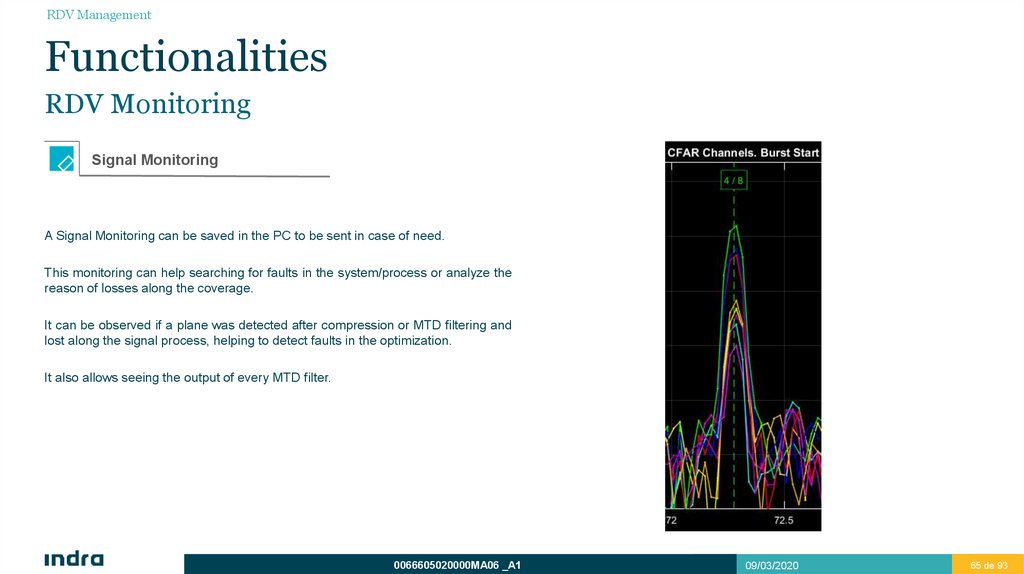
A Signal Monitoring can be saved in the PC to be sent in case of need.
This monitoring can help searching for faults in the system/process or analyze the
reason of losses along the coverage.
It can be observed if a plane was detected after compression or MTD filtering and
lost along the signal process, helping to detect faults in the optimization.
It also allows seeing the output of every MTD filter.
0066605020000MA06 _A1
09/03/2020
65 de 93
65
66.
RDV ManagementFunctionalities
RDV Monitoring
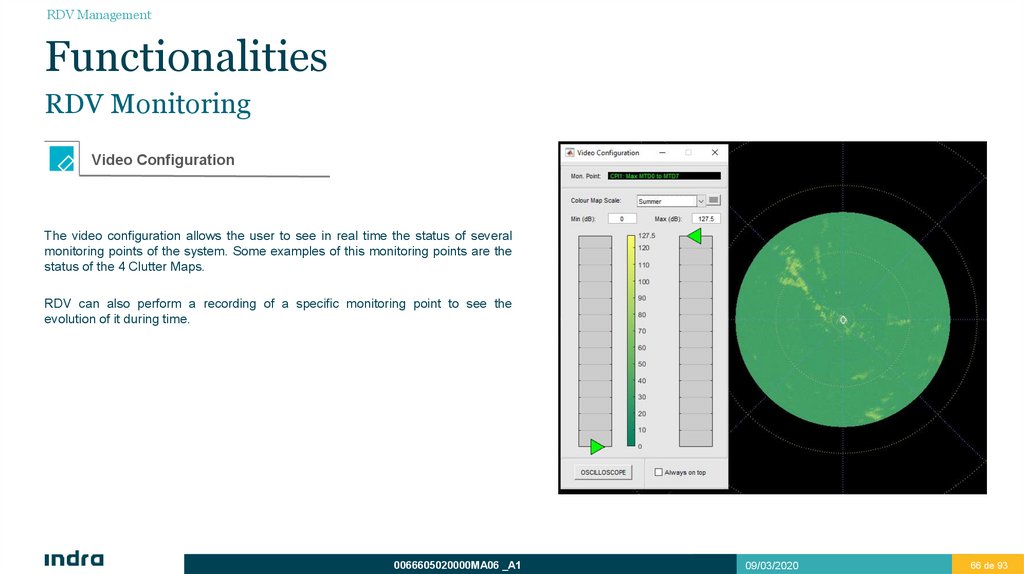
Video Configuration
The video configuration allows the user to see in real time the status of several
monitoring points of the system. Some examples of this monitoring points are the
status of the 4 Clutter Maps.
RDV can also perform a recording of a specific monitoring point to see the
evolution of it during time.
0066605020000MA06 _A1
09/03/2020
66 de 93
66
67.
RDV ManagementFunctionalities
Analysis & Backups
Analysis of the PSR2D performance
To analyze a system’s performance it is needed a recording of several hours. To perform a recording Indra provides several tools such as:
ASTTools
RDV (also used for the analysis of the recording)
VR3000
0066605020000MA06 _A1
09/03/2020
67 de 93
67
68.
RDV ManagementFunctionalities
Analysis & Backups
Analysis of the PSR2D performance
To analyze a recording it is used the RDV and the SASS-C / Verif combined.
The SASS-C / Verif is used to obtain the global recording’s results such as PD, number of false targets per scan or accuracy.
The RDV is used to detect the conflictive areas, punctual losses, false target appearance areas etc.
The RDV has filters and shortcuts to move though the recording easily and observe only the desired situations, which are explained in the following pages.
0066605020000MA06 _A1
09/03/2020
68 de 93
68
69.
RDV ManagementFunctionalities
Analysis & Backups
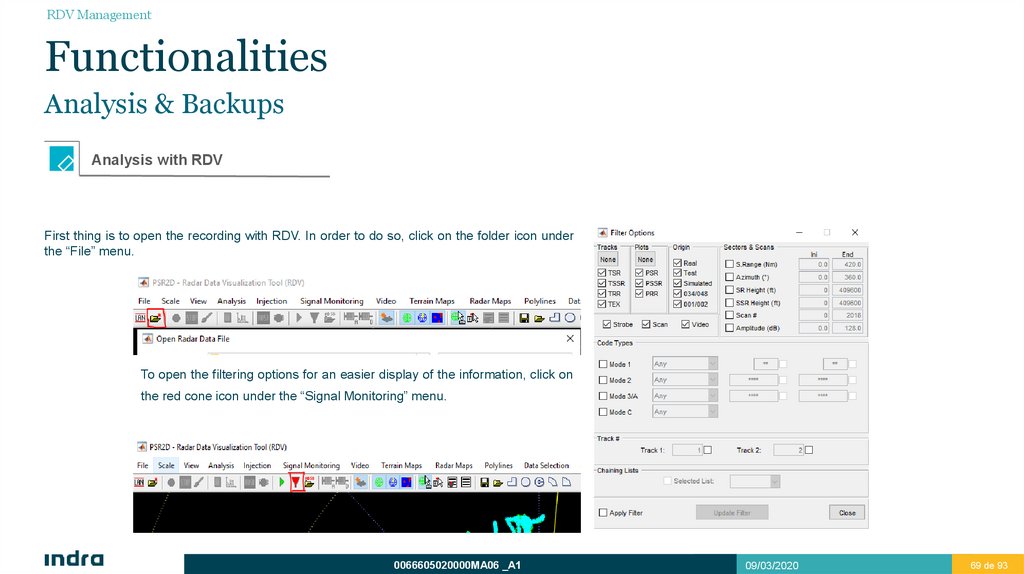
Analysis with RDV
First thing is to open the recording with RDV. In order to do so, click on the folder icon under
the “File” menu.
To open the filtering options for an easier display of the information, click on
the red cone icon under the “Signal Monitoring” menu.
0066605020000MA06 _A1
09/03/2020
69 de 93
69
70.
RDV ManagementFunctionalities
Analysis & Backups
RDV Shortcuts
The following shortcuts allow the user to navigate faster through the recording:
“E” : The recording will go straight to the last scan.
“H”: The historic of the detections from the selected time to the beginning of the recording will be displayed.
“T”: When a detection is manually selected, will place the time of the recording at the moment of the detection.
“Q” & “A”: will run the recording one scan before (“Q”) or after (“A”) the actual scan.
For example, to see the hole recording historic, press “E” and then “H”. This function is very useful when looking for specific areas such as losing areas of
false detection areas.
0066605020000MA06 _A1
09/03/2020
70 de 93
70
71.
RDV ManagementFunctionalities
Analysis & Backups
RDV Analysis
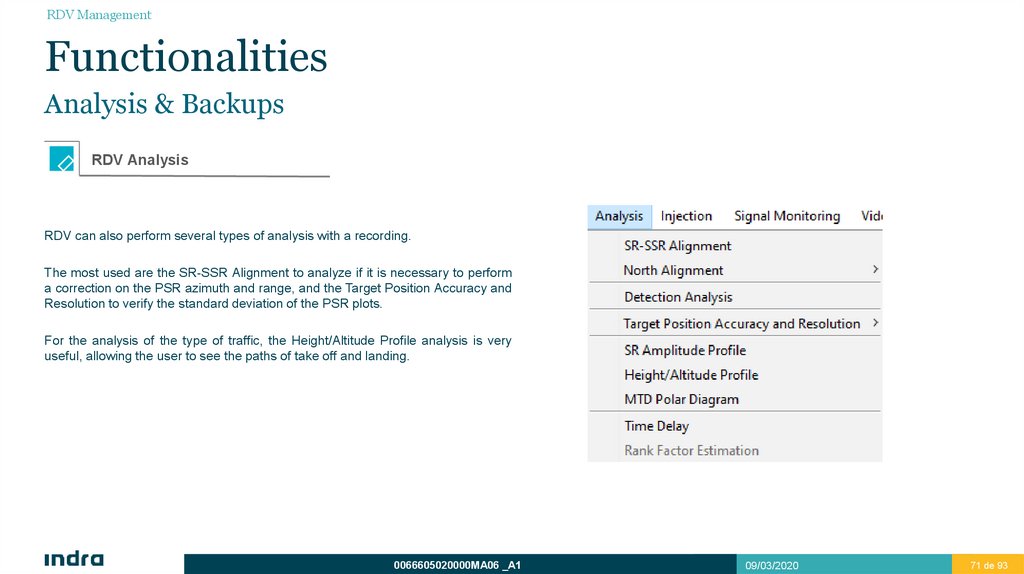
RDV can also perform several types of analysis with a recording.
The most used are the SR-SSR Alignment to analyze if it is necessary to perform
a correction on the PSR azimuth and range, and the Target Position Accuracy and
Resolution to verify the standard deviation of the PSR plots.
For the analysis of the type of traffic, the Height/Altitude Profile analysis is very
useful, allowing the user to see the paths of take off and landing.
0066605020000MA06 _A1
09/03/2020
71 de 93
71
72.
RDV ManagementFunctionalities
Analysis & Backups
RDV Maps Backup
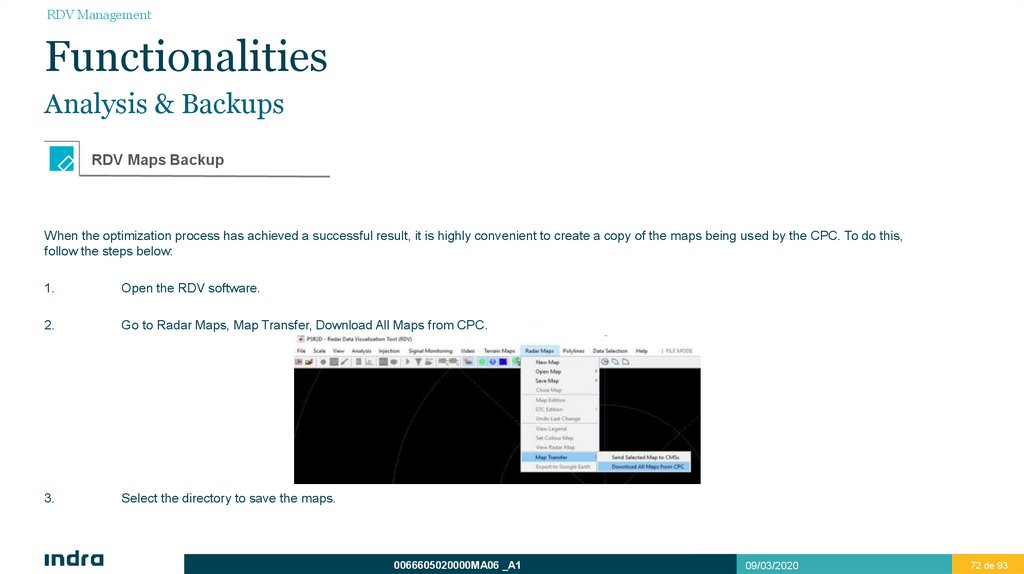
When the optimization process has achieved a successful result, it is highly convenient to create a copy of the maps being used by the CPC. To do this,
follow the steps below:
1.
Open the RDV software.
2.
Go to Radar Maps, Map Transfer, Download All Maps from CPC.
3.
Select the directory to save the maps.
0066605020000MA06 _A1
09/03/2020
72 de 93
72
73.
RDV ManagementMap Modification Criteria
Blanking Map
Modification Criteria and Edition Process
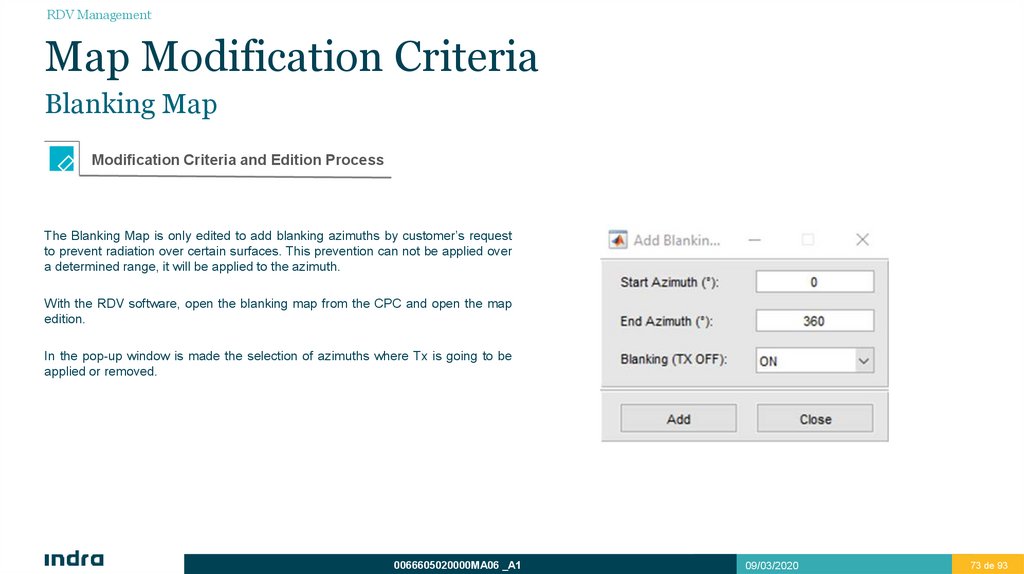
The Blanking Map is only edited to add blanking azimuths by customer’s request
to prevent radiation over certain surfaces. This prevention can not be applied over
a determined range, it will be applied to the azimuth.
With the RDV software, open the blanking map from the CPC and open the map
edition.
In the pop-up window is made the selection of azimuths where Tx is going to be
applied or removed.
0066605020000MA06 _A1
09/03/2020
73 de 93
73
74.
RDV ManagementMap Modification Criteria
Site Environment Map
Modification Criteria
The modification of this map is related with a low Pd issue. If the default map is applied and there are several losses over a certain area, that area should be
analyzed.
If the area has very high clutter levels, the CM-CFAR with all filters should remain applied.
If it is an area with moderate clutter levels, the CM-CFAR should be modified to apply only the low speed filters.
If the area does not have relevant noise levels, the CM-CFAR can be removed and leave only R-CFAR.
0066605020000MA06 _A1
09/03/2020
74 de 93
74
75.
RDV ManagementMap Modification Criteria
Site Environment Map
Edition Process
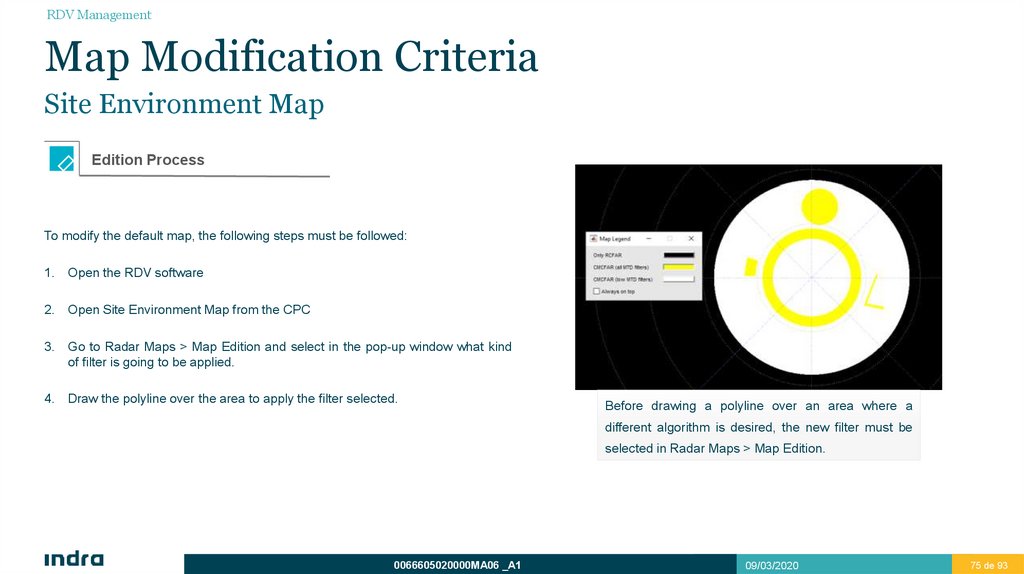
To modify the default map, the following steps must be followed:
1. Open the RDV software
2. Open Site Environment Map from the CPC
3. Go to Radar Maps > Map Edition and select in the pop-up window what kind
of filter is going to be applied.
4. Draw the polyline over the area to apply the filter selected.
Before drawing a polyline over an area where a
different algorithm is desired, the new filter must be
selected in Radar Maps > Map Edition.
0066605020000MA06 _A1
09/03/2020
75 de 93
75
76.
Maps Modification CriteriaAnalog STC Map
77.
RDV ManagementMap Modification Criteria
Analog STC Map
Modification Criteria
This map is not usually modified, because the Indra PSR sensor has other methods to avoid false target over certain areas. Nevertheless, in some cases of
big false target appearance, the Analog STC Map can be modified to increase the attenuation over a certain range to prevent this false targets. For example,
in big cities with multiple sources of clutter, the STC attenuation can be increased to prevent the vast majority of those false targets caused by the city clutter.
The use of this map is also related with avoiding the RX saturation in specific areas. Areas with specially high clutter can saturate the RX with many incoming
false targets. If this incoming clutter is unstable, the CM-CFAR will not filter it, ant the use of the Analog STC Map will be compulsory.
All the false targets will never be eliminated only with the Analog STC Map edition, because increasing the attenuation at very high levels to prevent all false
targets will cause the loss of several real targets.
0066605020000MA06 _A1
09/03/2020
77 de 93
77
78.
RDV ManagementMap Modification Criteria
Analog STC Map
Edition Process
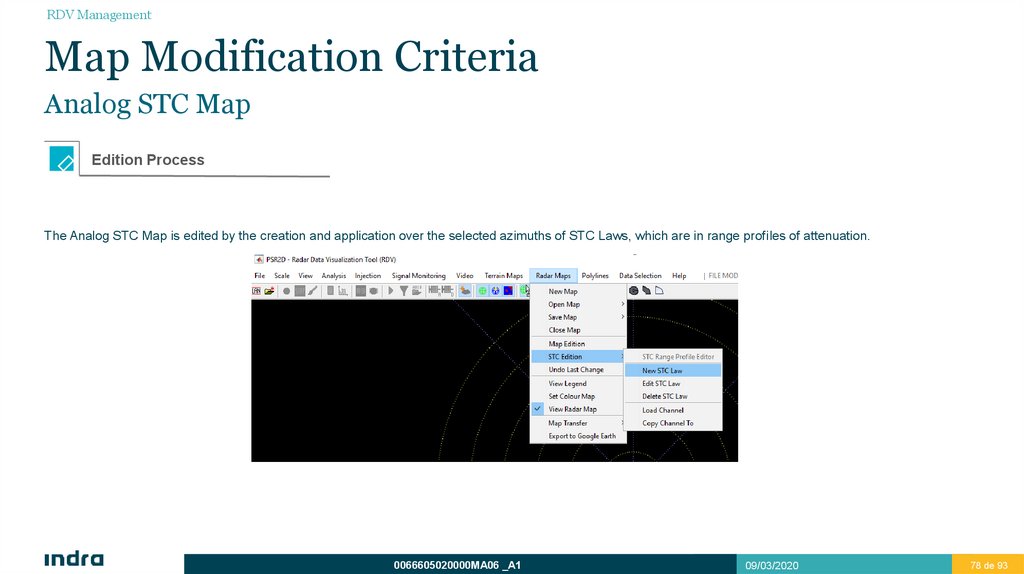
The Analog STC Map is edited by the creation and application over the selected azimuths of STC Laws, which are in range profiles of attenuation.
0066605020000MA06 _A1
09/03/2020
78 de 93
78
79.
RDV ManagementMap Modification Criteria
Analog STC Map
Edition Process
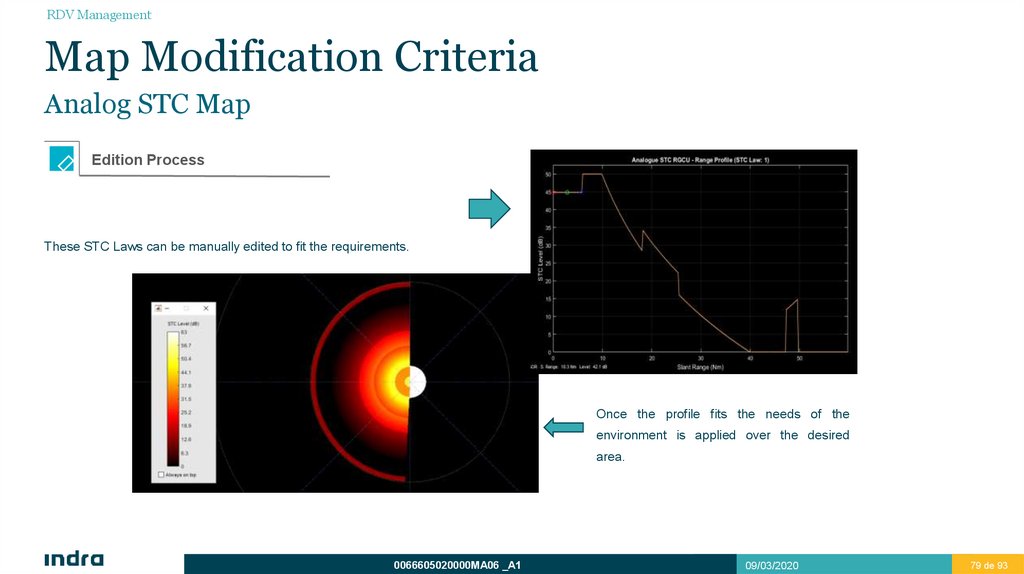
These STC Laws can be manually edited to fit the requirements.
Once the profile fits the needs of the
environment is applied over the desired
area.
0066605020000MA06 _A1
09/03/2020
79 de 93
79
80.
RDV ManagementMap Modification Criteria
Receiver Status Map
Modification Criteria
The Receiver Status Map usually stays as default. In some circumstances of loses, the range of the high beam might be increased in certain azimuths. If the PSR
sensor is the approach radar of an airport, the map might be modified to receive the approach path with the Low Beam instead of the High Beam, depending on the
angle of the approximation and the height of the flight.
If there is a big presence of high altitude flights and low traffic of low altitude in certain areas, it can be considered to increase the range of the high beam, even until
60 NM.
In case of presence of wind turbines, it must be applied the Adapt. Null option over the area. This will reduce radically the interferences produced by the wind
turbines.
The Combined HL configuration allows the radar to process both the high level flights and the low level aircrafts, combining the power obtained by both beams.
0066605020000MA06 _A1
09/03/2020
80 de 93
80
81.
RDV ManagementMap Modification Criteria
Receiver Status Map
Edition Process
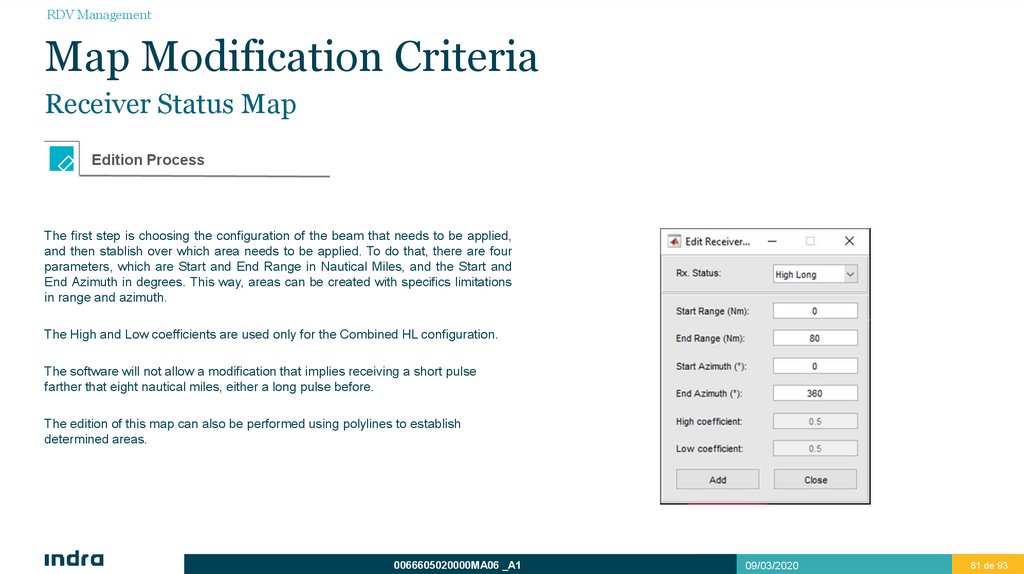
The first step is choosing the configuration of the beam that needs to be applied,
and then stablish over which area needs to be applied. To do that, there are four
parameters, which are Start and End Range in Nautical Miles, and the Start and
End Azimuth in degrees. This way, areas can be created with specifics limitations
in range and azimuth.
The High and Low coefficients are used only for the Combined HL configuration.
The software will not allow a modification that implies receiving a short pulse
farther that eight nautical miles, either a long pulse before.
The edition of this map can also be performed using polylines to establish
determined areas.
0066605020000MA06 _A1
09/03/2020
81 de 93
81
82.
RDV ManagementMap Modification Criteria
Digital STC Map
Modification Criteria
The Digital STC Map is meant to stablish thresholds for those areas with high clutter that surpasses the CFAR filtering.
As the CM-CFAR is constantly adapting, all the areas with a constant level of clutter will be compensated by the CM-CFAR, but the areas with sudden
changes on the clutter level will not be filtered by the CM-CFAR. For this reason this areas should be covered with a digital STC threshold. This areas can be
roads for example, with low traffic. A car with high Doppler speed will not be filtered by the CM-CFAR and will appear as a false target, but stablishing a
threshold over that road, only targets with a high power will appear.
0066605020000MA06 _A1
09/03/2020
82 de 93
82
83.
RDV ManagementMap Modification Criteria
Digital STC Map
Edition Process
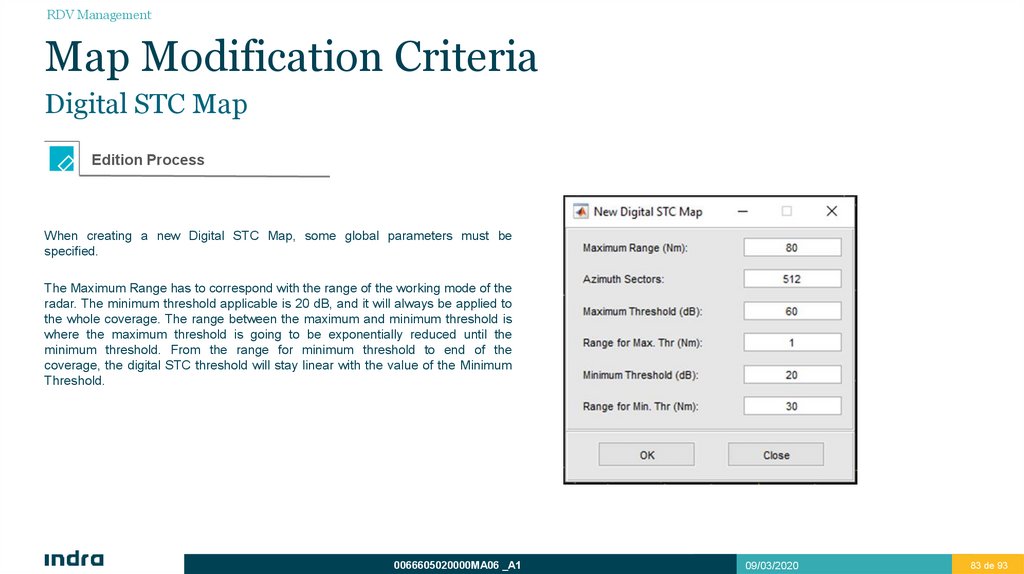
When creating a new Digital STC Map, some global parameters must be
specified.
The Maximum Range has to correspond with the range of the working mode of the
radar. The minimum threshold applicable is 20 dB, and it will always be applied to
the whole coverage. The range between the maximum and minimum threshold is
where the maximum threshold is going to be exponentially reduced until the
minimum threshold. From the range for minimum threshold to end of the
coverage, the digital STC threshold will stay linear with the value of the Minimum
Threshold.
0066605020000MA06 _A1
09/03/2020
83 de 93
83
84.
RDV ManagementMap Modification Criteria
Digital STC Map
Edition Process
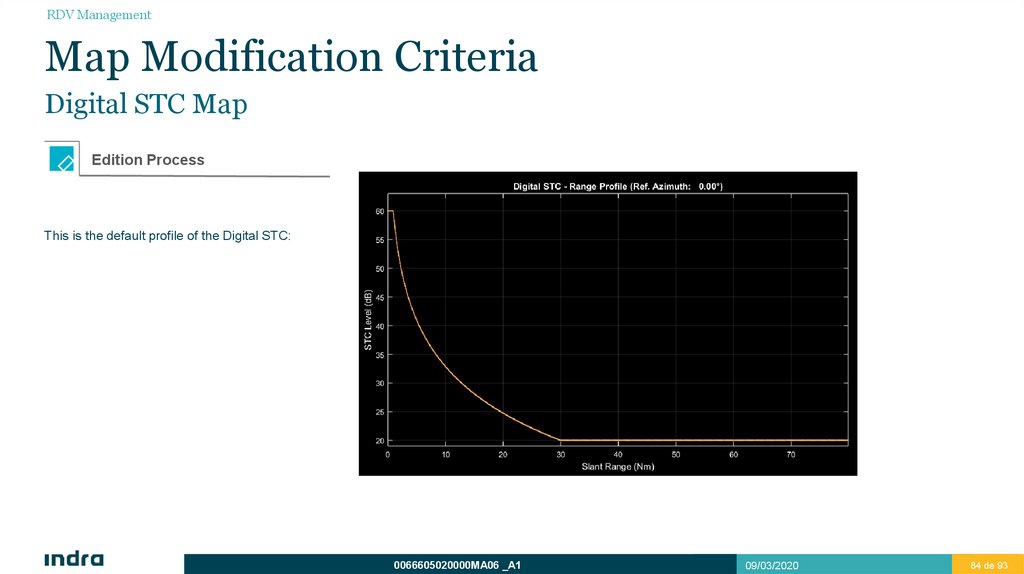
This is the default profile of the Digital STC:
0066605020000MA06 _A1
09/03/2020
84 de 93
84
85.
RDV ManagementMap Modification Criteria
Digital STC Map
Edition Process
Once this parameters have been set (in case of editing the map opened from the CPC, this parameters have already been set), press OK. This will be the
basic threshold applied over the coverage. To add specific areas with different thresholds:
1. Go to Radar Maps, Map Edition.
2. In the pop-up window stablish the desired threshold for the area that it is about to be created.
3. Draw the desired areas with the specified threshold using the polylines.
4. If the desired threshold for another area, repeat the steps to modify the threshold before drawing the area.
5. The threshold can not be modified for a painted area. In case that threshold has to be modified, the area must be drawn again with the desired threshold.
0066605020000MA06 _A1
09/03/2020
85 de 93
85
86.
RDV ManagementMap Modification Criteria
Digital STC Map
Edition Process
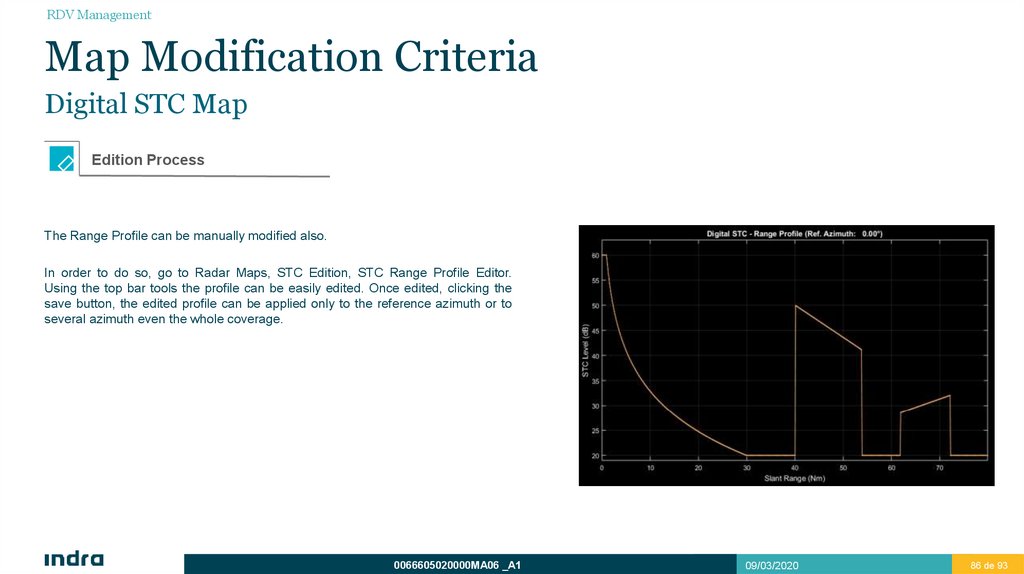
The Range Profile can be manually modified also.
In order to do so, go to Radar Maps, STC Edition, STC Range Profile Editor.
Using the top bar tools the profile can be easily edited. Once edited, clicking the
save button, the edited profile can be applied only to the reference azimuth or to
several azimuth even the whole coverage.
0066605020000MA06 _A1
09/03/2020
86 de 93
86
87.
Map Modification CriteriaDigital STC Map
Edition Process
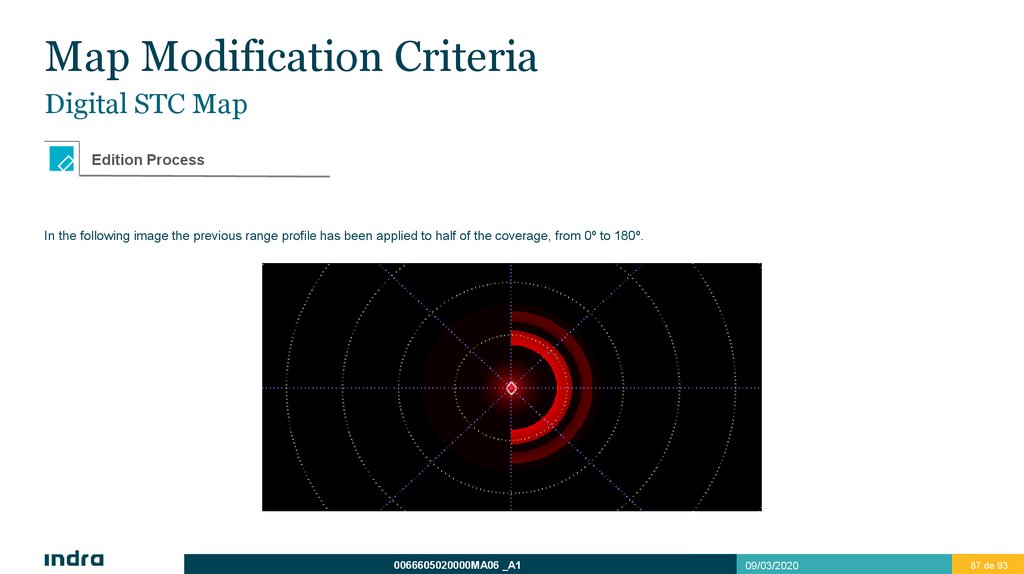
In the following image the previous range profile has been applied to half of the coverage, from 0º to 180º.
0066605020000MA06 _A1
09/03/2020
87 de 93
87
88.
RDV ManagementMap Modification Criteria
Tracking Zones Map
Modification Criteria
The application of the different possibilities in the Tracking zones is based on several conditions. As this map is the last one in being processed in the digital
signal processing, it is also going to be edited the last one. The purpose of this edition is to remove the false targets with special conditions (high speed,
reflections…) that remain after all the digital processing of the signal.
The type of area applied depends on the type of false targets over that area.
NTF zones can be applied in areas where the visibility is compromised and planes take off in that area. The take off is always more difficult to detect, so it
can be considered to apply a NTF zone to have a better detection.
NAI zones are very used in the optimization process. These zones are especially useful in areas of good detection and high traffic with false targets. The
NAI will eliminate all the false targets over the area. Another interesting use of the NAI zones is to eliminate radial false targets.
0066605020000MA06 _A1
09/03/2020
88 de 93
88
89.
Map Modification CriteriaTracking Zones Map
Modification Criteria
The type of area applied depends on the type of false targets over that area.
PB and TB zones are very uncommon to use. In some rare cases, demanded by the customer, it might be possible to add this blanking zones over
specific areas, like the taxi roads of the landing track, to avoid the detection of plots or tracks.
Angel zones are applied over areas that eventually have sudden appearance of false plots. This effect usually happens at sunrise and sunset.
NONE zones does not have any of the previous filters, but applies the filtering parameters of speed and angle. This type of zone is applied through areas
that contain false targets with low speed, like cars, or ships. The parameters of modification depends of the undesired targets over that certain area.
0066605020000MA06 _A1
09/03/2020
89 de 93
89
90.
RDV ManagementMap Modification Criteria
Tracking Zones Map
Edition Process
To edit this map there are several tips to count on:
Several Configuration sets can be previously prepared with different parameters of speed, angle and acceleration. This will allow the user to determine
every zone’s parameters easily.
All the editable parameters are always applied regarding of the type of zone (NAI, NONE, PB…). When a tracking area is defined, the Configuration Set is
selected with or without a specific type of algorithm.
0066605020000MA06 _A1
09/03/2020
90 de 93
90
91.
RDV ManagementMap Modification Criteria
Tracking Zones Map
Edition Process
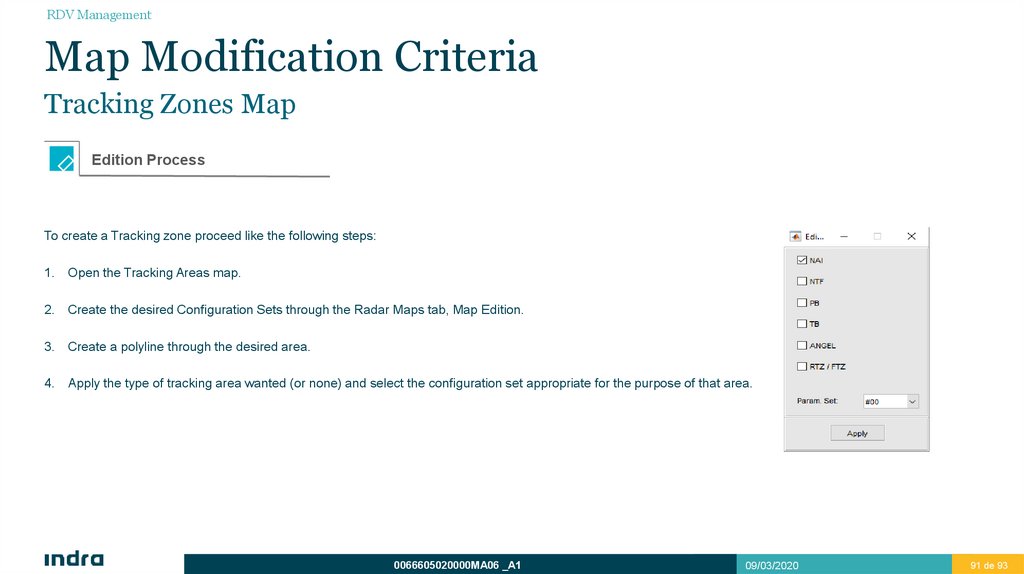
To create a Tracking zone proceed like the following steps:
1. Open the Tracking Areas map.
2. Create the desired Configuration Sets through the Radar Maps tab, Map Edition.
3. Create a polyline through the desired area.
4. Apply the type of tracking area wanted (or none) and select the configuration set appropriate for the purpose of that area.
0066605020000MA06 _A1
09/03/2020
91 de 93
91
92.
RDV ManagementMap Modification Criteria
Tracking Zones Map
Edition Process
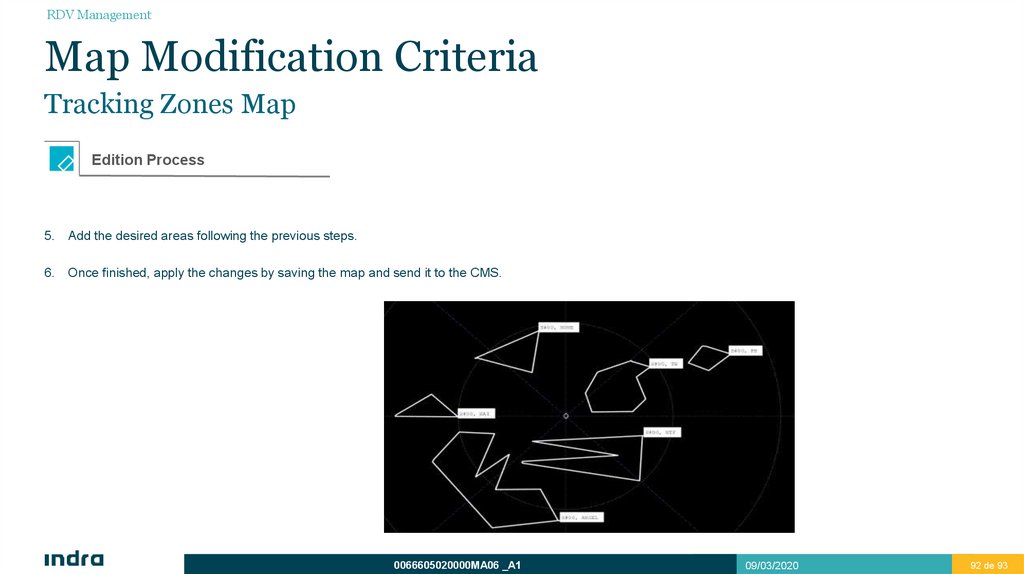
5. Add the desired areas following the previous steps.
6. Once finished, apply the changes by saving the map and send it to the CMS.
0066605020000MA06 _A1
09/03/2020
92 de 93
92