


 software
Similar presentations:

 in MS power bi. DAX functions")


")


Dashboard Spec Aspen Sales Force
1. Dashboard Spec Sales_Force_SSD_Daily_Dashboard
2. Log in details for new server
REMOTE DESKTOP LOGINIP: 41.76.209.124
Username: OWLAFRICA2\Administrator
Password: nBvU392@
MSSQL SERVER LOGIN + JASPER DATASET CONNECTION
Username: sa
Password: nBvU392@
3.
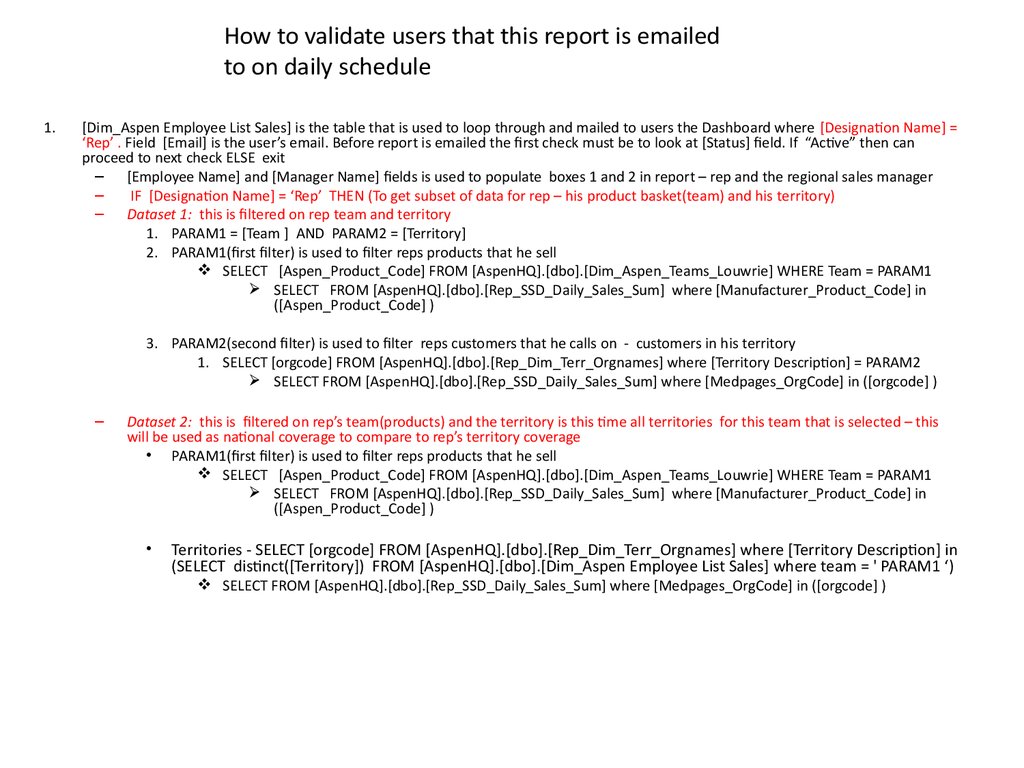
How to validate users that this report is emailedto on daily schedule
1.
[Dim_Aspen Employee List Sales] is the table that is used to loop through and mailed to users the Dashboard where [Designation Name] =
‘Rep’ . Field [Email] is the user’s email. Before report is emailed the first check must be to look at [Status] field. If “Active” then can
proceed to next check ELSE exit
– [Employee Name] and [Manager Name] fields is used to populate boxes 1 and 2 in report – rep and the regional sales manager
–
IF [Designation Name] = ‘Rep’ THEN (To get subset of data for rep – his product basket(team) and his territory)
– Dataset 1: this is filtered on rep team and territory
1. PARAM1 = [Team ] AND PARAM2 = [Territory]
2. PARAM1(first filter) is used to filter reps products that he sell
SELECT [Aspen_Product_Code] FROM [AspenHQ].[dbo].[Dim_Aspen_Teams_Louwrie] WHERE Team = PARAM1
SELECT FROM [AspenHQ].[dbo].[Rep_SSD_Daily_Sales_Sum] where [Manufacturer_Product_Code] in
([Aspen_Product_Code] )
3. PARAM2(second filter) is used to filter reps customers that he calls on - customers in his territory
1. SELECT [orgcode] FROM [AspenHQ].[dbo].[Rep_Dim_Terr_Orgnames] where [Territory Description] = PARAM2
SELECT FROM [AspenHQ].[dbo].[Rep_SSD_Daily_Sales_Sum] where [Medpages_OrgCode] in ([orgcode] )
–
Dataset 2: this is filtered on rep’s team(products) and the territory is this time all territories for this team that is selected – this
will be used as national coverage to compare to rep’s territory coverage
• PARAM1(first filter) is used to filter reps products that he sell
SELECT [Aspen_Product_Code] FROM [AspenHQ].[dbo].[Dim_Aspen_Teams_Louwrie] WHERE Team = PARAM1
SELECT FROM [AspenHQ].[dbo].[Rep_SSD_Daily_Sales_Sum] where [Manufacturer_Product_Code] in
([Aspen_Product_Code] )
Territories - SELECT [orgcode] FROM [AspenHQ].[dbo].[Rep_Dim_Terr_Orgnames] where [Territory Description] in
(SELECT distinct([Territory]) FROM [AspenHQ].[dbo].[Dim_Aspen Employee List Sales] where team = ' PARAM1 ‘)
SELECT FROM [AspenHQ].[dbo].[Rep_SSD_Daily_Sales_Sum] where [Medpages_OrgCode] in ([orgcode] )
4.
1Date: 14 Oct 2016
Sales Force Sales In Dashboard
CUSTOMER GROUP
SALES CURRENT
MONTH OCT 2016
SALES CURRENT
MONTH OCT 2016
Current Month Sales Trend Indep - East Rand : Basket : Independent 1
SALES TOTAL
2
PHCY - CLICKS
Sales R 2 653
5 out of 7
9
Rep: Jonny Depp
Indep - East Rand : Basket : Independent
1
14
3
PHCY – Dis chem
Sales R 2 653
5 out of 7
CURRENT MONTH MAY 2016
R 22 653 10
5
50 K
40 K
Oct 16
Sep 16
30 K
# NUM SKU
MAY 2016
11
120 out of 130
20 K
10 K
Ind Pharm
1 Oct 16
Sales R 2 653
4 out of 7
2 Oct 16
3 Oct 16
GROWTH TOTAL SALES
MAY 2016 Vs. PREVIOUS
MONTH
10 %
Pharmacy Medirite
Sales R 2 653
5 out of 7
6
4 Oct 16
5 Oct 16
6 Oct 16
GROWTH # Customers
MAY 2016 Vs. PREVIOUS
MONTH
7
7 Oct 16
8 Oct 16
# NUM CUSTOMERS
MAY 2016 in territory
GROWTH # SKU’s
MAY 2016 Vs. PREVIOUS
MONTH
12
115 Out of 300
8
-10 %
10 %
14
National Sales Trend Vs Indep - East Rand Basket :Independent 1
1077
MIL
Hosp Netcare
107
MIL
Sales R 2 653
5 out of 8
40 K
10
MIL
13
30 K
National
Aug 16
20 K
10 K
JAN
FEB
MAR
APR
JUN
JUL
AUG
SEP
OCT
NOV
DEC
5.
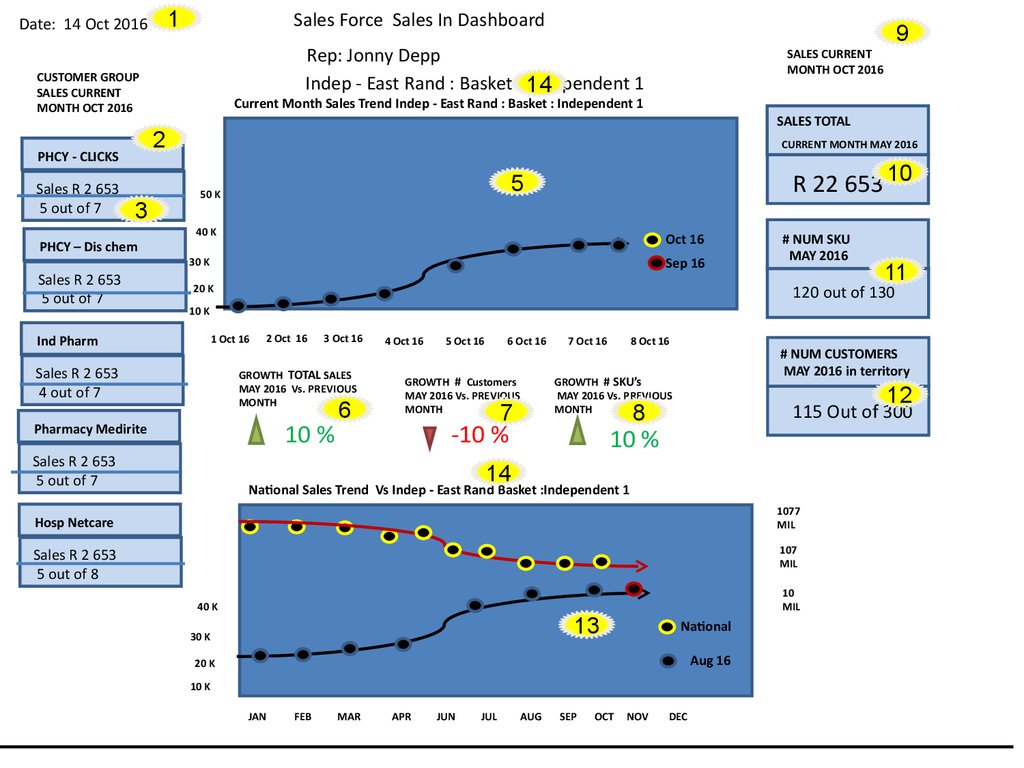
Dashboard page one data information1. Display the date that the report is generated
2. Dataset 1 - SELECT sum([LineTotal]) FROM [AspenHQ].[dbo].[Rep_SSD_Daily_Sales_Sum] where [Tran_YearMonths] = Max([Tran_YearMonths]) and Group By [ASPEN CLASSIFICATION] – display underneat each other
3. Dataset 2 - SELECT count(distinct Medpages_OrgCode) FROM [Rep_SSD_Daily_Sales_Monthly_Sum]
where [Tran_YearMonths] = Max([Tran_YearMonths]) and Group By [ASPEN CLASSIFICATION] – The total amount of pharmacies : SELECT count(distinct Medpages_OrgCode) FROM [Rep_SSD_Daily_Sales_Monthly_Sum] – is to get the total amount of pharmacies in this group – this selection is on whole
year – dataset 2
4.
5. Dataset 1 – Line Chart - SELECT sum([LineTotal]) FROM [AspenHQ].[dbo].[Rep_SSD_Daily_Sales_Sum] where [Tran_YearMonths] = Max([Tran_YearMonths]) – to display latest months sales totals per day. X axis is the days of latest or current month
6. Dataset 1 – % Sales growth- SELECT sum([LineTotal]) FROM [AspenHQ].[dbo].[Rep_SSD_Daily_Sales_Sum] where [Tran_YearMonths] = Max([Tran_YearMonths]) – to get latest months sales totals then compare to total sales from previous month with same amount of days. For instance today is the 14 th – I
can only compare up to 14 th of previous month to get accurate growth %
7. Dataset 1 – % customer growth- SELECT count(distinct [Medpages_OrgCode]) FROM [AspenHQ].[dbo].[Rep_SSD_Daily_Sales_Sum] where [Tran_YearMonths] = Max([Tran_YearMonths]) – to get latest months customer count then compare to customer count from previous month with same amount of
days. For instance today is the 14 th – I can only compare up to 14 th of previous month to get accurate growth %
8. Dataset 1 – % product growth- SELECT count(distinct [Manufacturer_Product_Code]) FROM [AspenHQ].[dbo].[Rep_SSD_Daily_Sales_Sum] where [Tran_YearMonths] = Max([Tran_YearMonths]) – to get latest months product count then compare to product count from previous month with same amount of
days. For instance today is the 14 th – I can only compare up to 14 th of previous month to get accurate growth %
9. Dataset 1 – select max(Tran_YearMonths) to display latest month in header in text box type
10. Dataset 1 - SELECT sum([LineTotal]) FROM [AspenHQ].[dbo].[Rep_SSD_Daily_Sales_Sum] where Tran_YearMonths = max(Tran_YearMonths) – to display latest months sales total
11. Dataset 1 - SELECT count(distinct([Manufacturer_Product_Code])) FROM [AspenHQ].[dbo].[Rep_SSD_Daily_Sales_Sum] where Tran_YearMonths = max(Tran_YearMonths) to get count of customers for the max day. Then SELECT count([Manufacturer_Product_Code]) FROM [AspenHQ].[dbo].
[Rep_SSD_Daily_Sales_Sum] to get total products
6.
Dashboard page one data information12. Dataset 1 - SELECT count(distinct([Manufacturer_Product_Code])) FROM [AspenHQ].[dbo].[Rep_SSD_Daily_Sales_Sum] where
Tran_YearMonths = max(Tran_YearMonths) to get count of customers for the max month. Then SELECT count([Manufacturer_Product_Code])
FROM [AspenHQ].[dbo].[Rep_SSD_Daily_Sales_Sum] to get total customers
13. Dataset 1 - SELECT count(distinct( Medpages_OrgCode)) FROM [AspenHQ].[dbo].[Rep_SSD_Daily_Sales_Sum] where Tran_YearMonths =
max(Tran_YearMonths ) to get count of customers for the max Month. Then SELECT count( Medpages_OrgCode) FROM [AspenHQ].[dbo].
[Rep_SSD_Daily_Sales_Sum] to get total customers
14. Dataset 2 –SELECT sum([LineTotal]) FROM [AspenHQ].[dbo].[Rep_SSD_Daily_Sales_Sum] where Tran_YearMonths >= 201601 – to display
years data per month sales total – THIS IS ON REPS TEAM AND TERRITORY. The top line is National coverage – show all territories but same
team as rep – Filter on team
7.
Date: 4 May 2016Indep - East Rand : Basket : Independent 1
# Customers group performance last 3 months
1
3
4
6
5
2
8.
Dashboard page one data information1.
2.
3.
4.
Dataset 2 – Display list of [ASPEN CLASSIFICATION] groups that are in the territory. Sort 4.
Dataset 2 – Display month names of last 3 months as headers of columns
Dataset 2 - SELECT count distinct ([Medpages_OrgCode]) FROM [AspenHQ].[dbo].[Rep_SSD_Daily_Sales_Monthly_Sum
Dataset 2 - SELECT sum(LineTotal) FROM [AspenHQ].[dbo].[Rep_SSD_Daily_Sales_Monthly_Sum] where product
= ‘ product‘ and
last 3 months total
5. Dataset 2 - SELECT sum(LineTotal) FROM [AspenHQ].[dbo].[Rep_SSD_Daily_Sales_Monthly_Sum] where product
= ‘ product‘ and
group by month to display month – last 3
4. Dataset 2 - select sum(line total) FROM [AspenHQ].[dbo].[Rep_SSD_Daily_Sales_Monthly_Sum for latest month per group
9.
Date: 4 May 2016Indep - East Rand : Basket : Independent 1
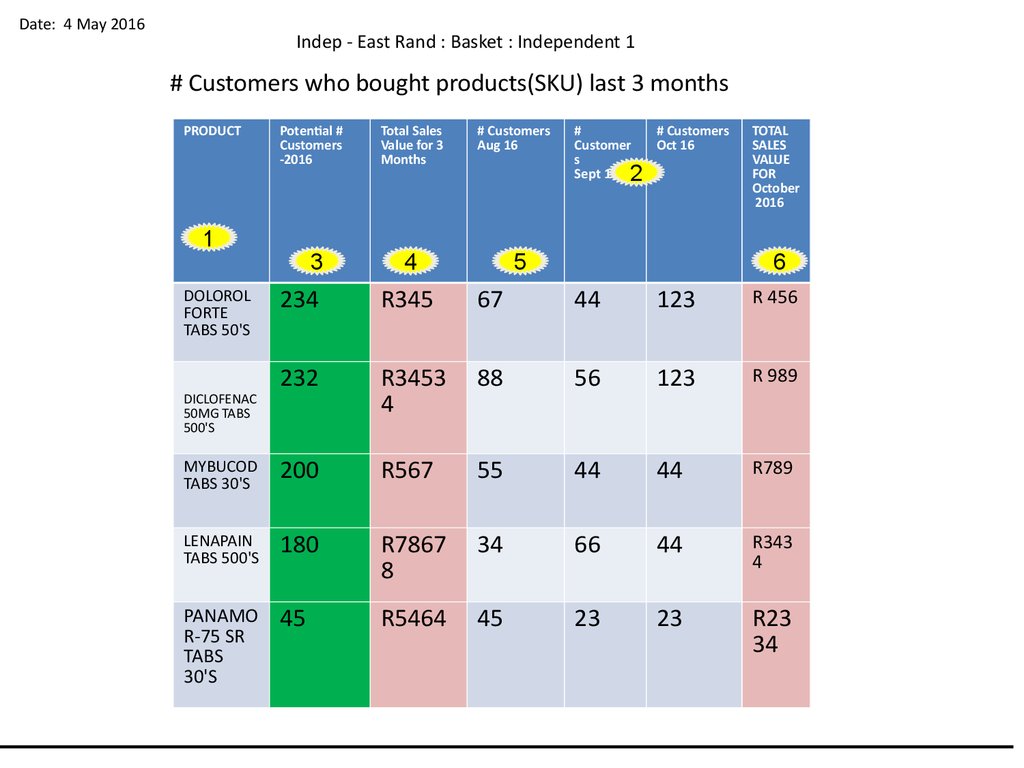
# Customers who bought products(SKU) last 3 months
PRODUCT
Potential #
Customers
-2016
1
3
Total Sales
Value for 3
Months
# Customers
Aug 16
#
Customer
s
Sept 16
# Customers
Oct 16
2
4
5
TOTAL
SALES
VALUE
FOR
October
2016
6
234
R345
67
44
123
R 456
232
R3453
4
88
56
123
R 989
MYBUCOD
TABS 30'S
200
R567
55
44
44
R789
LENAPAIN
TABS 500'S
180
R7867
8
34
66
44
R343
4
PANAMO
R-75 SR
TABS
30'S
45
R5464
45
23
23
R23
34
DOLOROL
FORTE
TABS 50'S
DICLOFENAC
50MG TABS
500'S
10.
Dashboard page one data information1.
2.
3.
4.
Dataset 2 – Display list of products that the reps team sell. This will be the team parameter. Sort 4.
Dataset 2 – Display month names of last 3 months as headers of columns
Dataset 2 - SELECT count distinct ([Medpages_OrgCode]) FROM [AspenHQ].[dbo].[Rep_SSD_Daily_Sales_Monthly_Sum
Dataset 2 - SELECT sum(LineTotal) FROM [AspenHQ].[dbo].[Rep_SSD_Daily_Sales_Monthly_Sum] where product
= ‘ product‘ and
last 3 months total
5. Dataset 2 - SELECT sum(LineTotal) FROM [AspenHQ].[dbo].[Rep_SSD_Daily_Sales_Monthly_Sum] where product
= ‘ product‘ and
group by month to display month – last 3
4. Dataset 2 - select sum(line total) FROM [AspenHQ].[dbo].[Rep_SSD_Daily_Sales_Monthly_Sum for latest month per group
11.
Date: 4 May 2016Indep - East Rand : Basket : Independent 1
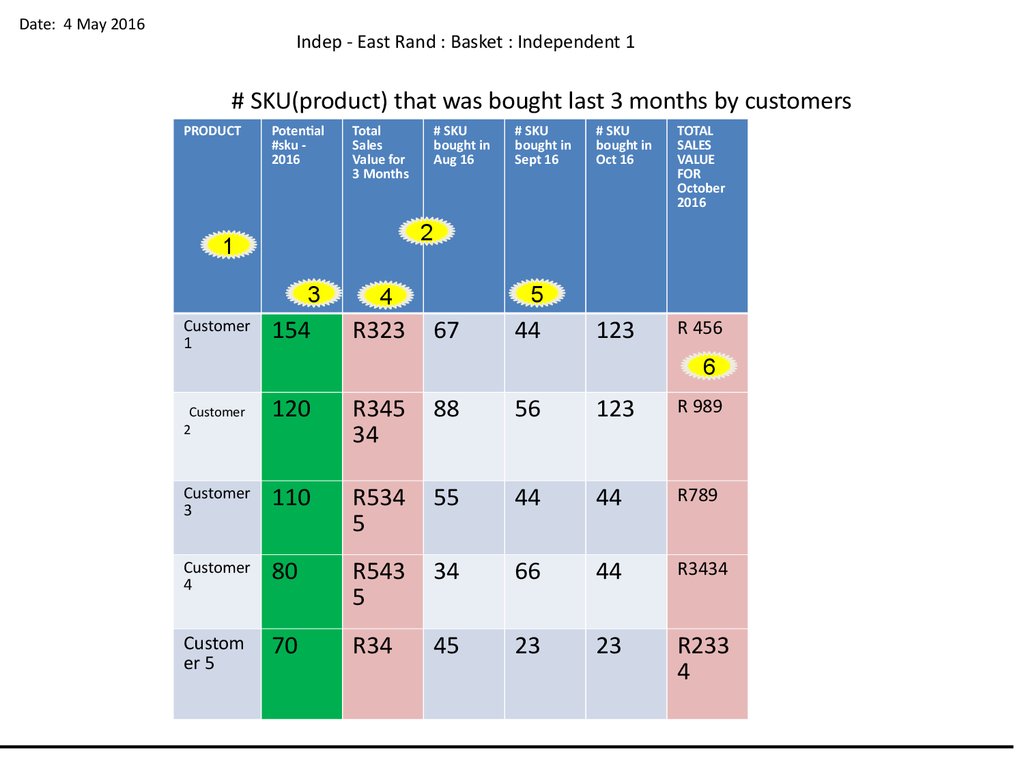
# SKU(product) that was bought last 3 months by customers
PRODUCT
Potential
#sku 2016
Total
Sales
Value for
3 Months
# SKU
bought in
Sept 16
# SKU
bought in
Oct 16
TOTAL
SALES
VALUE
FOR
October
2016
123
R 456
2
1
3
Customer
1
# SKU
bought in
Aug 16
154
5
4
R323
67
44
6
120
R345
34
88
56
123
R 989
Customer
3
110
R534
5
55
44
44
R789
Customer
4
80
R543
5
34
66
44
R3434
Custom
er 5
70
R34
45
23
23
R233
4
Customer
2
12.
Dashboard page one data information1.
2.
3.
4.
Dataset 2 – Display list of customers that is in the reps territory. This will be the territory parameter. Sort 4.
Dataset 2 – Display month names of last 3 months as headers of columns
Dataset 2 - SELECT count distinct ([Manufacturer_Product_Code]) FROM [AspenHQ].[dbo].[Rep_SSD_Daily_Sales_Monthly_Sum
Dataset 2 - SELECT sum(LineTotal) FROM [AspenHQ].[dbo].[Rep_SSD_Daily_Sales_Monthly_Sum] where product
= ‘ product‘ and
last 3 months total
5. Dataset 2 - SELECT count distinct ([Manufacturer_Product_Code]) FROM [AspenHQ].[dbo].[Rep_SSD_Daily_Sales_Monthly_Sum]
where product
= ‘ product‘ and group by month to display month – last 3
4. Dataset 2 - select sum(line total) FROM [AspenHQ].[dbo].[Rep_SSD_Daily_Sales_Monthly_Sum for latest month per group
13.
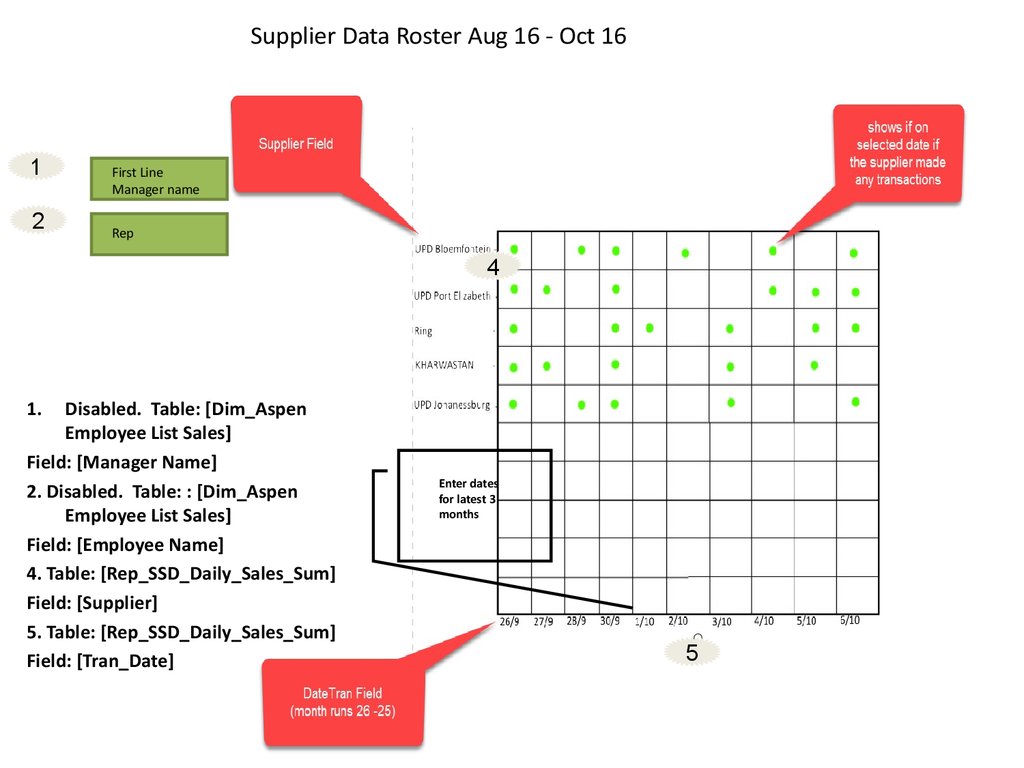
Supplier Data Roster Aug 16 - Oct 161
2
First Line
Manager name
Rep
4
1.
Disabled. Table: [Dim_Aspen
Employee List Sales]
Field: [Manager Name]
2. Disabled. Table: : [Dim_Aspen
Employee List Sales]
Field: [Employee Name]
4. Table: [Rep_SSD_Daily_Sales_Sum]
Field: [Supplier]
5. Table: [Rep_SSD_Daily_Sales_Sum]
Field: [Tran_Date]
Enter dates
for latest 3
months
5