


")

:")
")
")


 allows to work with RARE events (<0.05%)")


-by conventional flow cytometry and IFC")


")

")


")

- An Ongoing Revolution in Cell Biology")

")
")


 optical configurations and fluorescent channels")


")
")


")
 (Torrezas et al, 2015)")
")

")

 to 8-colors immunophenotyping (external staining) with Imagestream X Mark II")
")

 (Ploppa et al, 2011)")

 biology
Similar presentations:


")


Modern Methods in Cell Biology
1. Modern Methods in Cell Biology
Flow cytometryImaging cytometry
2. Approaches to problems in cell biology
Biochemistry-You can define a enzyme reaction (protein) andthen try to figure what does it, when, where and under what
control
Genetics- You can make a mutation and then try to figure out
what you mutated (knock-out; conditional knock-out, siRNA
etc)
Cell Biology- You can visualize a process and try to
understand it- for instance cell division was one of the earliest
Today- there are no distinctions. You cannot be just one thing,
or be knowledgable about one thing. You need to take
integrated appoaches to problems using the appropriate tools
when needed. If you limit your approach, you limit your
science
3. Resolution of instruments in cellular biology
Resolution describes the minimal distance of two points that can be distinguished.Picture taken from http://microscopy.fsu.edu/primer/anatomy/numaperture.html
4. Resolution of instruments in cell biology (2 objects)
Visible light is 400-700nmDry lens(0.5NA), green(530nm
light)=0.65µm=650nm
for oil lens (1.4NA) UV light (300nm) =
0.13µm
for electron microscope
l=0.005nm but NA 0.01 so =30-50nm
Conventional flow cytometer > 300 nm
Imaging flow cytometer – 300nm scatter
5. Sizes of objects
Eukaryotic cell- 20µmProcaryotic cell-1-2µm
nucleus of cell-3-5µm
mitochondria/chloroplast- 1-2µm
ribosome20-30nm
protein- 2-100nm
Exosome – 40-100 nm
Microparticle – 100-1000 nm
6. Basic info expected from flow cytometry experiment (2 cellular populations):
.• Whether a cell of interest
is positive or negative for a
given marker?
Separation of positive and negative
cellular populations
7. Analysis of Cellular subpopulations by different methods (How many parameters to measure?)
• Conventional flow cytometry -4---12---18 fluorescentparameters+ 2-3 light scattering parameters (FSC-A, FSC-H,
FSC-W, SSC-A, SSC-H, SSC-W); fluorescence: mean
fluorescent intensity (MFI)
• CYTOF (mass-cytometry) 50 fluorescent parameters
• Imaging Flow Cytometry (Imagestream X Mark II)
Bright Field+SSC+10 fluorescent channels x
~ 200 morphological parameters > 2,000 parameters
8. Speed and Statistics (How fast? How precise?)
• Microscopy (20x-100x objective) – 20-100cells/per slide or well – subjective factor;
• High-throughput microscopy (20x objective)
• Conventional flow cytometry 3-25,000
events/sec
• Imagestream –high-throughput microscopy
In Flow or Imaging flow cytometry: up to
5,000 events/sec with 20x-60x objectives
9. Zeno’s paradox
10. STATISTICS: How many cells we really need to count?
11. It depends from heterogeneity of cell population, % of antigen expression etc etc
12. File size for Imagestream imaging flow cytometer –up to 100,000 events (cell images) allows to work with RARE events (<0.05%)
File size for Imagestream imaging flowcytometer –up to 100,000 events (cell
images) allows to work with RARE events
(<0.05%)
Conventional flow cytometer > 10,000,000
cell events
. per file
13. Basic Flow Cytometer
How does it work?Fluidics (stream)
Optics/excitation
sources
Electronics
Fluidics
Hydrodynamic focusing
of sample stream within
a sheath fluid
Sheath fluid needs
similar refractive index
as sample fluid
For sorting: electolyte
solution
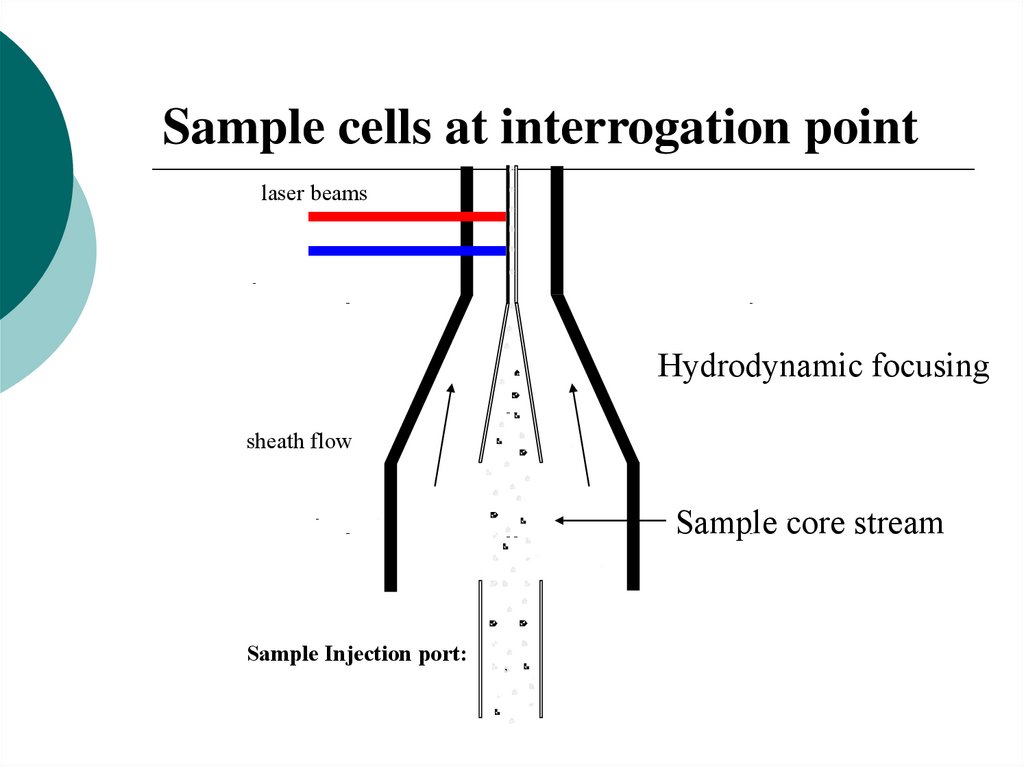
14.
Sample cells at interrogation pointlaser beams
Hydrodynamic focusing
sheath flow
Sample core stream
Sample Injection port:
15. Optics:Light Sources
LightAmplification
by the
Stimulated
Emission
of
Radiation
s
Can provide a single wavelength
of light
Can provide from milliwatts to
watts of light
Can be unexpensive, air-cooled
units or expensive, water-cooled
units
Provide coherent light at uniform
wavelength, phase,polarity
Can be tightly focused
Arc Lamps:
Provide mixture of wavelengths
that must be filtered to receive
desirable wavelength;
Provides miliwatts of light
Unexpensive air-cooled units
Provide uncoherent light
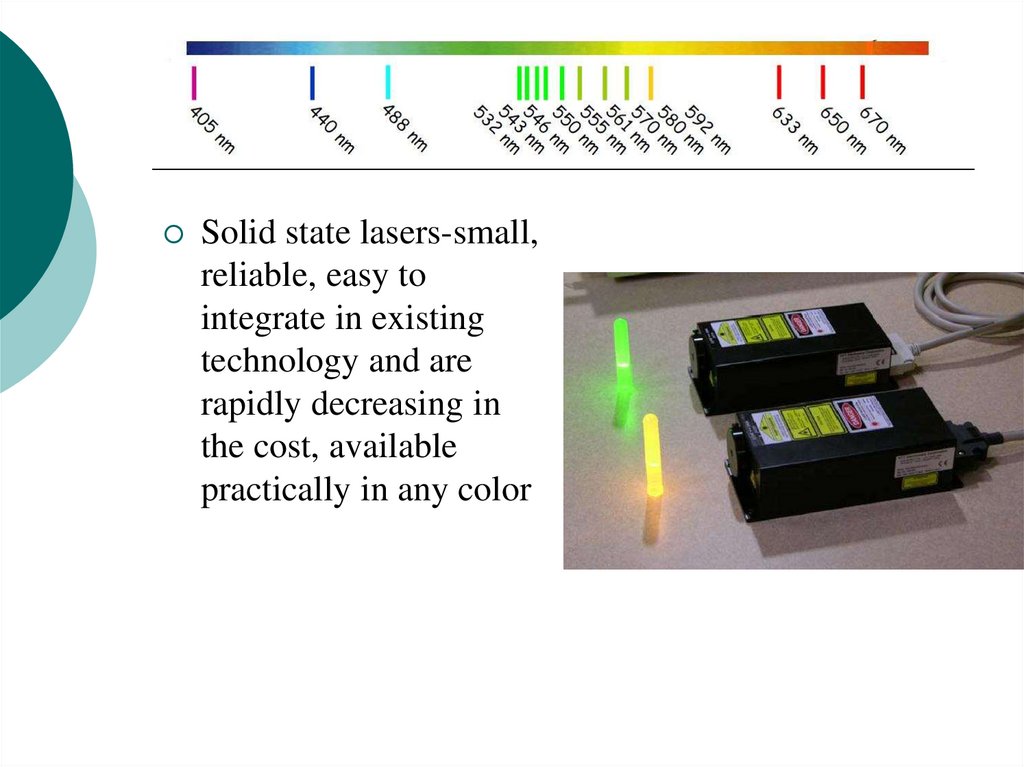
16.
Solid state lasers-small,reliable, easy to
integrate in existing
technology and are
rapidly decreasing in
the cost, available
practically in any color
17. Multiple lasers in modern flow cytometer
LSRFortessa5 lasers
LSR2 7 lasers
Stratedigm
4 lasers
Influx…
6 lasers
18. FACS Aria sorter
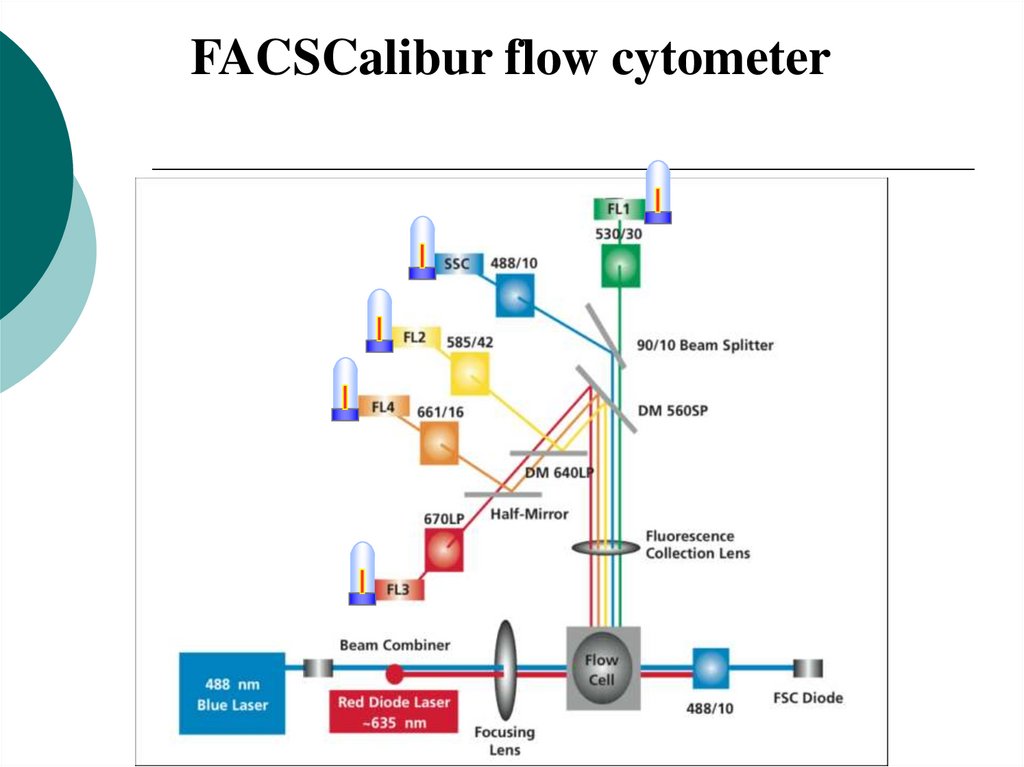
19.
FACSCalibur flow cytometer20. Optics: Forward Scatter Channel/Side Scatter Channel
FSC influenced by particle size and shape;Allows the computer discriminate between particulate matter
of minimal size and elctronical or optical noise; used as
threshold;
SSC(90o –side scatter)-is also influenced by size, but also by
surface structure,”granularity”;
Combination of FSC and SSC allows live/dead cell gating and
gives some information on size and structure
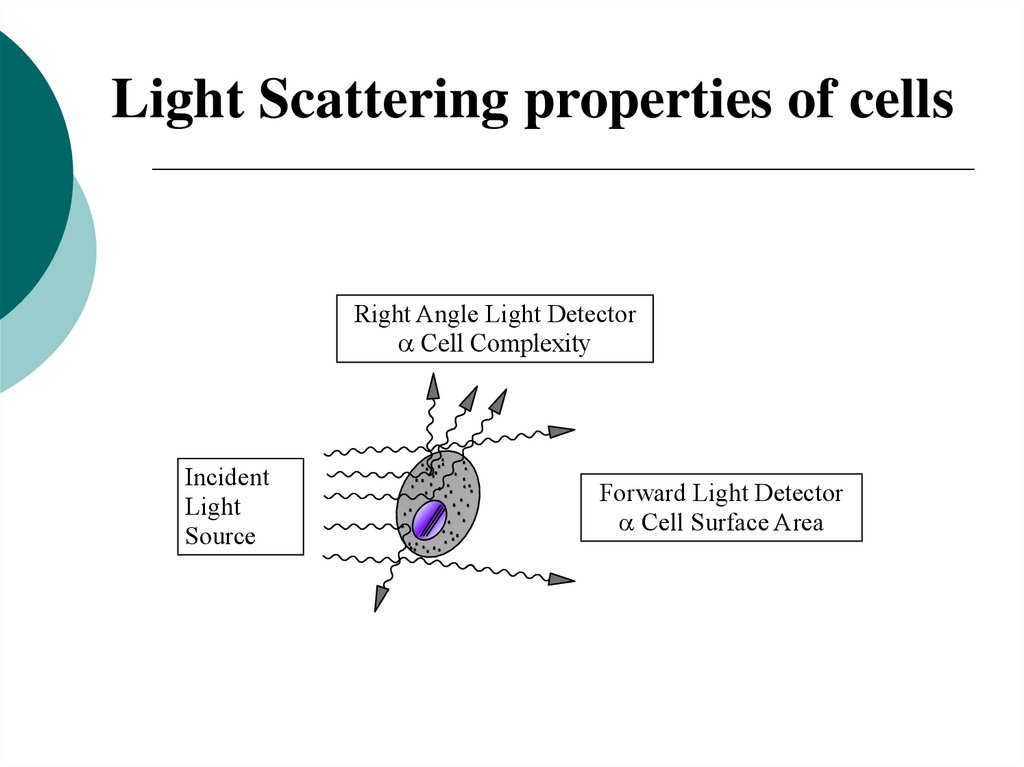
21.
Light Scattering properties of cellsRight Angle Light Detector
Cell Complexity
Incident
Light
Source
Forward Light Detector
Cell Surface Area
22.
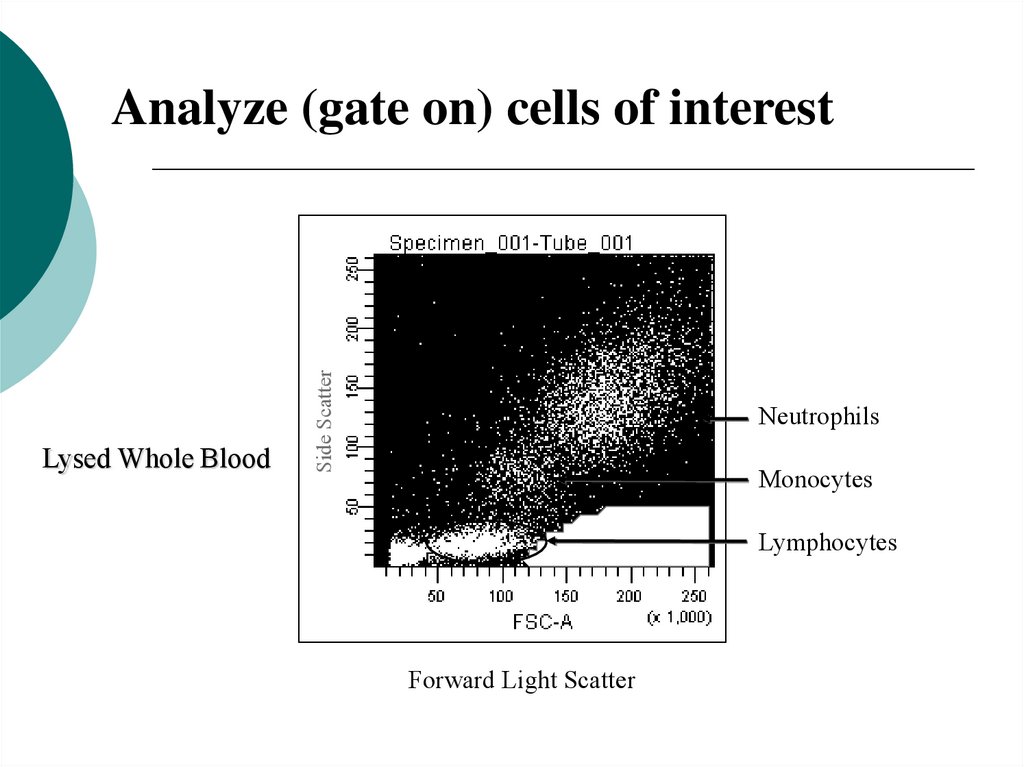
Lysed Whole BloodSide Scatter
Analyze (gate on) cells of interest
Neutrophils
Monocytes
Lymphocytes
Forward Light Scatter
23.
24. Scatter (Size parameter)-by conventional flow cytometry and IFC
Barteneva et al, BBA Reviews on Cancer 2013, 1836: 105-12225. Principle of fluorescence
Principle of Fluorescence1. Energy is absorbed by the atom which
becomes excited.
2. The electron jumps to a higher energy level.
3. Soon, the electron drops back to the ground
state, emitting a photon (or a packet of light) the atom is fluorescing.
26. FLUORESCENT methods in the research laboratory
• State-of-the art Fluorescent Microscopy and ConfocalMicroscopy
• High dimensional Flow Cytometry (FACSAria, CYFLEX etc)
• High speed FACS-based cell sorting
• ...
• High-throughput single-cell analysis
• Super-Resolution microscopy
• Imaging Flow Cytometry-high-dimensional analysis of
correlations between cellular fluorescence and cellular
morphology
27. Advantages of fluorescent methods
• Highly sensitive method (high resolution)• Highly sophisticated fluorescent probes (multi-)
– Fluorescent dyes that accumulate in different cellular
compartments or are sensitive to pH, ion gradients
– Fluorescently tagged antibodies to specific cell features
– Endogenously expressed fluorescent proteins
» Really endogenous
NADH/FAD: enzymes involved in ATP production
structural proteins: collagen/elastin
amino-acids: tryptophan/tyrosine
» After gene modification
Green fluorescent protein and variants
28. FLUORESCENT dyes are typically composed of ring structures
29. Absorption and Emission Spectra of some traditional fluorophores
30. Fluorescence Stoke’s shift
• Fluorescence emission peak wavelength is red-shiftedwith respect to absorption peak wavelength
• This shift may vary typically from 5 to more than 100 nm,
depending on the electronic structure of the molecule
31. USE OF FLUORESCENT DYES
Labeling of proteins - antibodies,streptavidin
Labeling of nucleic acids – DNA, RNA
Labeling cell membranes and organells,
mitotracker,
lysotracker, rhodamine ceramide (Golgi
complex)
Sensors: pH, membrane potential, redox
potential
Quenching and dequenching reactions
32. FITC (Fluorescein isothiocyanate)
-Because of the large difference in molecularweight between FITC (389 Da)
and immunoglobulin proteins (150,000 Da), simple
gel filtration procedures are sufficient to separate
free (unreacted) dye from FITC-labelled antibody
Fluorescein isothiocyanate is a yellow-green colored low molecular weight dye
which couples to proteins via reaction with primary amine groups at high pH.
FITC is excitable at 488nm, close to its absorption maximum at 494nm,
and produces maximum fluorescence emission around 520nm
33. Phycobiliproteins- The phycobiliproteins are 'antenna' pigments used by some classes of plants to increase the efficiency of
photosynthesis by collecting light energy at wavelengths over which chlorophyll absorbs poorly.PE=phycoerythrin-
extracted from Corralina officinalis
R-PE - R symbolises its red-algal origin – it is a bright orange-red colored protein,
with a molecular weight of 250 kDa and containing 34 chromophore prosthetic groups.
-With absorption maxima at 492 and 565nm it is excitable by the 488nm argon-ion laser,
and has emission maxima around 578nm
34. APC(allophycocyanin)
Rod-and-core structure of cyanobacterial phycobilisome. Left-hand diagram shows stacks ofhexameric phycocyanin complexes comprising the rods. The right-hand diagram shows
phycoerythrin- and phycocyanin-containing rods, with a three-cylinder core consisting of
APC and APC-B. [Adapted from AN Glazer. Phycobilisome: a macromolecular complex
optimized for light energy transfer. Biochemica et Biophysica Acta, 1984, p29-51]
APC and allophycocyanin-B constitute the core of the phycobilisome, with other biliproteins
constituting the rods. Light energy is transmitted down the rods to the core,
then to chlorophyll which is embedded in the 'thylakoid' membranes of the photosynthetic chloroplasts.
The normal sequence of energy transfer is:
phycoerythrin - phycocyanin - allophycocyanin - allophycocyanin B - chlorophyll a
35. ALEXA family:brighter, more photostable, less environmental sensitive
36. Quantum Dot-conjugated antibody
37. Quantum Dots advantages
• Extremly photostable• Narrow emission spectrum, hence small
spectral overlap
• Broad absorption spectrum ( disadvantage at
some situations-excited by all standard lasers)
• Capacity for multiplexing
38. QDots Brightness
Brightness Index=Extinction Coefficient x Quantum Yield/100039. How do we get fluorescent probes into cells
Kill the cell and make the membranepermeable
Live cells
Diffusion: some can cross membrane
Microinjection- stick and tiny needle through
membrane
Trauma: rip transient holes in membrane by
mechanical shear (scrape loading) or electrical
pulse (electroporation)
Lipid vesicles that can fuse with membrane
Transfect with fluorescent protein vector
40. How to load cells (microscopy)
• .41. Immunofluorescent staining of proteins in fixed/dead cells
You can purify almost any protein from the cell(Biochemistry)
Make an antibody to it by injecting it into a rabbit
or mouse (primary antibody)
Use the antibody to bind to the protein in the
fixed cell
Fixed cells can be made permeable so
antibodies can get into interior
Use a fluorescent “secondary antibody” (antirabbit or mouse) to localize the primary antibody
Amplify secondary label (tyramide etc)
42. Green Fluorescent Protein (GFP)- An Ongoing Revolution in Cell Biology
Protein from fluorescent jellyfishThe protein is fluorescent
Now cloned, sequenced and X-ray structure known
If you express it in a cell, the cell is now fluorescent!
Use a liver promoter to drive gene expression, and you get a fluorescent liver! All
cells in the liver make GFP which fills the cytoplasm with fluorescence.
Liver specific promoter
DNA
GFP gene
Protein on Liver
GFP
Fuse the DNA sequence of a protein to the DNA sequence of GFP and the cell
will express it and make a fusion protein which has two domains. Wherever that
protein is in the cell, you will see fluorescence!
Liver protein gene
GFP gene
Liver protein
GFP protein
Allows you to do live cell dynamic localization of specific proteins
DNA
Protein
43. Discovery of fluorescent proteins
44. Evrogen proteins (Lukianov Lab)
45. Conventional flow cytometry (Example: scattering+5 colors)
40004000
10
2000
1000
<PE-A>: CD138
FSC-W
3000
2000
1000
96.9
37.8
1000
2000
FSC-A
3000
4000
0
1000
2000
FSC-H
3000
5
0.2
10
2
31.5
102
103
104
<PE-Texas Red-A>: B220
0
105
B220
13.8
104
100
100
80
80
3
% of Max
10
% of Max
14
60
2
25.9
0.34
59.1
20
20
4.34
0
0
26.8
0
IgD
0 10
2
3
10
10
<PE-Cy7-A>: IgM
4
10
60
40
40
10
IgM
3
4000
FSC-H
10
10
dump
0
FSC-W
0
104
0
0
<Violet1-A>: Lin
SSC-A
3000
5
5
0
NP
102
103
104
<APC-A>: NP
105
0
CD38
102
103
104
<APC-Cy7-A>: CD38
105
46.
9 colors: Murine Hematopoietic Stem Cells Sort from TransplantObjective: To serially transplant subpopulations of hematopoietic stem cells (HSC’s) Cell surface phenotype of
HSC: Ckit+ Sca1+ CD34+ Flk2+ Lin-. Donor Mouse was CD45.2: Recipient Mouse: CD45.1 CD150 gates for the HSC
compartment defined as follows: Slam Neg: ckit+sca1+ CD34+ Flk2+ Slam Low: ckit+ Sca1- CD34- Flk2-, Slam High: Ckit+
Sca1+ CD34- Flk2- above Slam Low gate.
Approximate size
<Alexa Fluor 700-A>: cd45-2
200K
104
FSC-H
150K
10
80%
103
100K
102
103
32%
102
50K
99%
0
53%
104
104
3
Donor and Host live, lin105
105
<PE-Texas Red-A>: live
105
SSC-A
Live and lineage negative
Doublet Discrimination
250K
102
0
41%
0
0
0
50K
100K
150K
200K
250K
0
50K
100K
FSC-A
200K
0 102
250K
<PE-A>: Flk2
104
10
0 102
10
53.1
102
102
0
0
0
39.5
6.88
0 10
3
10
4
10
5
10
<PerCP-Cy5-5-A>:sca1
0 102
103
104
<FITC-A>: CD34
105
105
Stain:
6.12
102
2
104
Donor live, lin- ckit+ sca1+ flk2- cd34+
CD150 High low and neg
103
3
103
<PE-Cy7-A>: cd45-1
104
104
3
105
105
105
0.81
104
<APC-A>: slam
105
103
<Pacific Orange-A>: lin
Donor live, linckit+ sca1+ flk2- cd34+
Donor live, linckit+ sca1+
<APC-Cy7-A>: ckit
150K
FSC-A
0
50K
100K
150K
FSC-A
200K
250K
Viable- PI, Lineage-CD3,
CD8, CD4,IL7R , Gr1,
Mac1, B220, Ter119:
Biotin- Pacific Orange,
Cd45.2: APC-Cy5.5,
CD45.1: Pe-Cy7, CkitAPC-780, Sca1- PerCpCy5.5, Flk2- PE, CD34FITC, CD150/Slam: APC
Isabel Beerman/PCMM
47. Imaging flow cytometers provide alternative for cellular analysis and characterization
48. Imagestream 100 imaging flow cytometer
49.
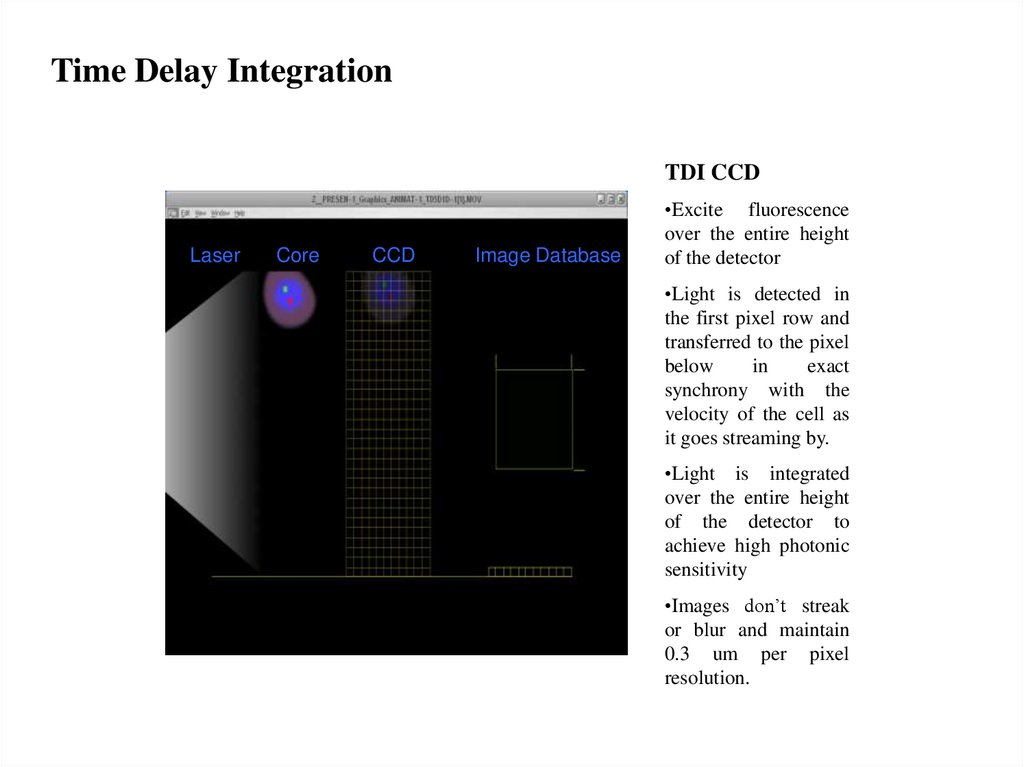
Time Delay IntegrationTDI CCD
Laser
Core
CCD
Image Database
•Excite fluorescence
over the entire height
of the detector
•Light is detected in
the first pixel row and
transferred to the pixel
below
in
exact
synchrony with the
velocity of the cell as
it goes streaming by.
•Light is integrated
over the entire height
of the detector to
achieve high photonic
sensitivity
•Images don’t streak
or blur and maintain
0.3 um per pixel
resolution.
50. Imagestream X Mark II
x60 objective; higher acquisition speed; 10 fluorescent channels; +561 nm laser51. Imagestream X Mark II
Amnis Inc52. Imagestream (s) optical configurations and fluorescent channels
Adapted from A.Filby, 201553. Cellular analysis by conventional Flow Cytometry
• Traditional markers to define cell populations(human, rat, mouse)
• Relies on fluorescence-based analysis; no
morphological parameters (only sizeparameter)
54. Standard approach to verify FACS-defined cellular subset:cell sorting+microscopy
From Becher et al, Nature Immunology, 201455. Limitations of FACS sorting/microscopy approach
• Purity of sorted subpopulation (never 100%)-can be 85% orless for some sorted subsets
• Difficult or not possible to sort/perform microscopy on low
expressing (<1%) and rare cell (<0.1%) populations
• Manipulations related to cell sorting may induce maturation
and activation of cell subsets (e.g. DC), leading to negative
impact on outcome of experiment
• Viability and/or fluorescence of sorted cells can be affected
• Cells can be not identifiable by morphology
• Advanced spectral compensation not available in microscopy
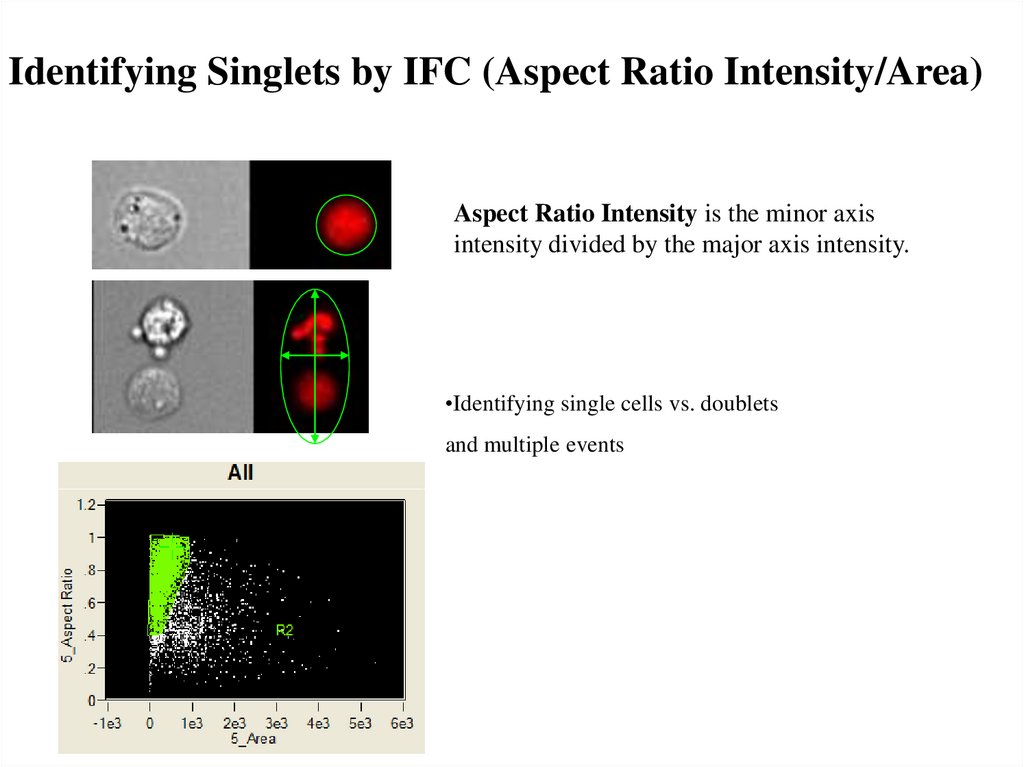
56.
Identifying Singlets by IFC (Aspect Ratio Intensity/Area)Aspect Ratio Intensity is the minor axis
intensity divided by the major axis intensity.
•Identifying single cells vs. doublets
and multiple events
57. Shape parameters in defining erythroid sickle anemia cells (Samsel, McCoy Jr, 2016)
58. Size/Shape distribution analysis (Aphanizomenon sp. Cells, our data)
59. Fluorescence-based analysis by Imagestream
• DNA/RNA dyes (PI, Sytox Blue, SYTOXGreen etc)
• Lipid dyes (DiO, DiA, BODIPY family_
• Fluorochrome-tagged Annexin V
• Fluorescently-tagged probes-fluorescent
probes (GFP and others) and/or or lectins
• AUTOFLUORESCENCE as a parameter
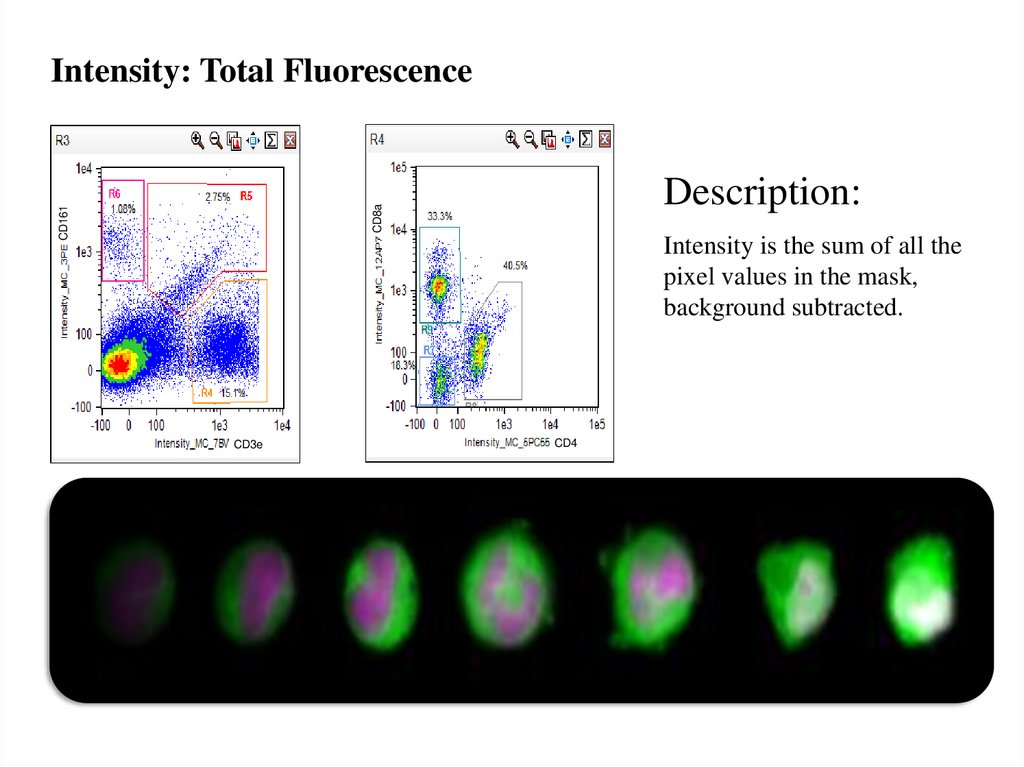
60.
Intensity: Total FluorescenceCD161
CD8a
Description:
Intensity is the sum of all the
pixel values in the mask,
background subtracted.
CD3e
CD4
61. Quantification of Toxoplasma gondii
Muskavitch et al, 200862. Number of ingested by neutrophils S. aureus bacteria (Ploppa et al, 2011)
63. Counting of Leishmania donovani (% infected cells and #parasites/cell) (Torrezas et al, 2015)
64. Internalization of CSFE-stained N.gonorrhoeae bacteria (Smirnov et al, 2015)
65. Human PBMC -morphology
(from B.Hall)66. Spectral Compensation (Imagestream 100, Amnis Corp)
Post-acquisitionSingle color control
compensation
samples used
is applied
to calculate
to images
a 6x6
on
matrix.
a pixel by pixel basis in IDEAS.
SSC
Brightfield
AMNIS CORPORATION-Compensation
FITC
PE
PE-Alexa610
Draq5
67. Spectral compensation is assymetric
68. From 3-4 colors for images (microscopy) to 8-colors immunophenotyping (external staining) with Imagestream X Mark II
CD3+ T-cells; CD4+ helper T-cells; CD16+granulocytes; CD19+ B-cells;CD14+ monocytes; CD123+ pDC/basophils; Nuclear morphology
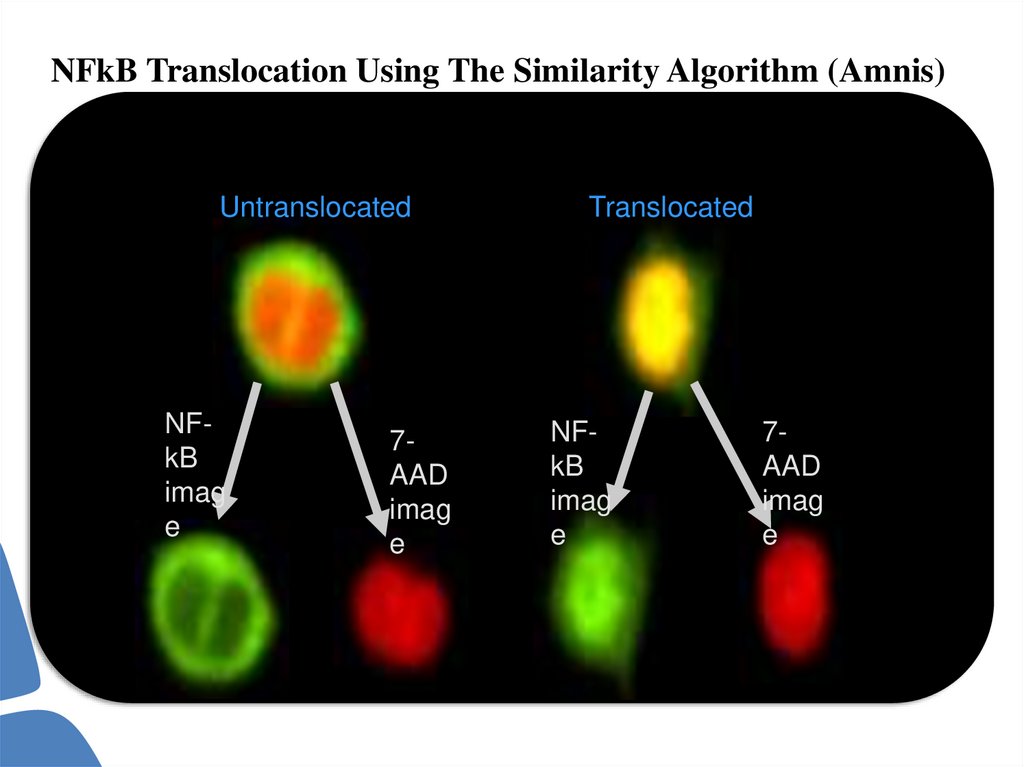
69.
NFkB Translocation Using The Similarity Algorithm (Amnis)Untranslocated
NFkB
imag
e
7AAD
imag
e
Translocated
NFkB
imag
e
7AAD
imag
e
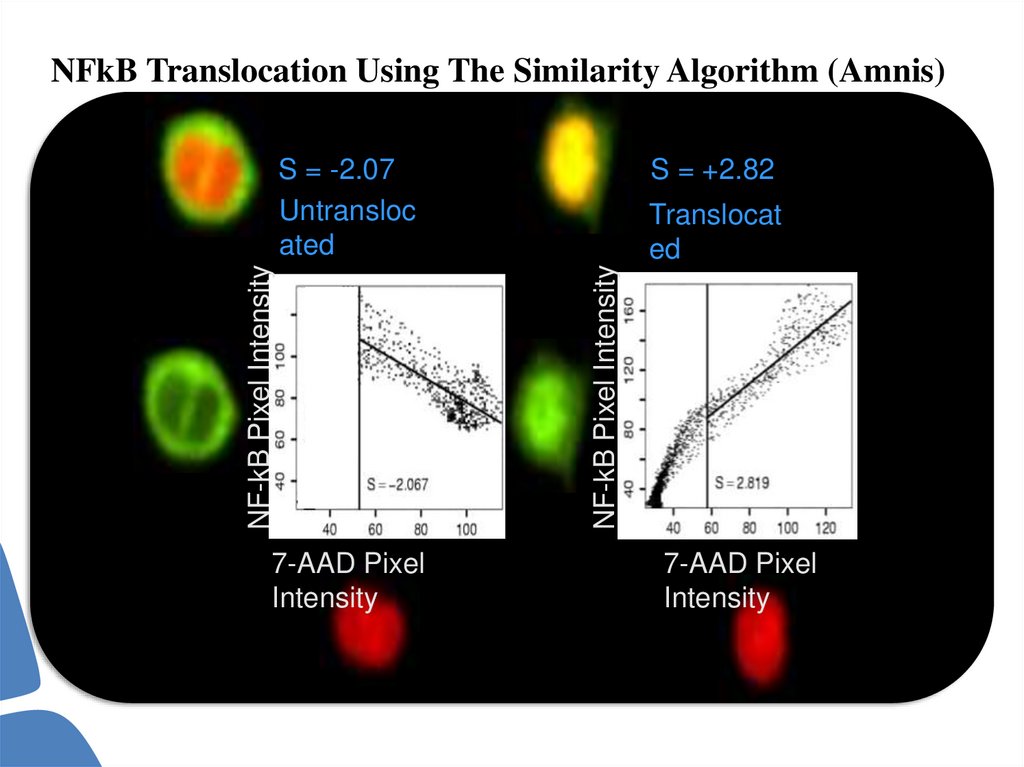
70.
NFkB Translocation Using The Similarity Algorithm (Amnis)7-AAD Pixel
Intensity
S = +2.82
Translocat
ed
NF-kB Pixel Intensity
NF-kB Pixel Intensity
S = -2.07
Untransloc
ated
7-AAD Pixel
Intensity
71. Bystander MFs have impaired NFkappaBeta translocation to the nucleus (Torrez et al, 2015)
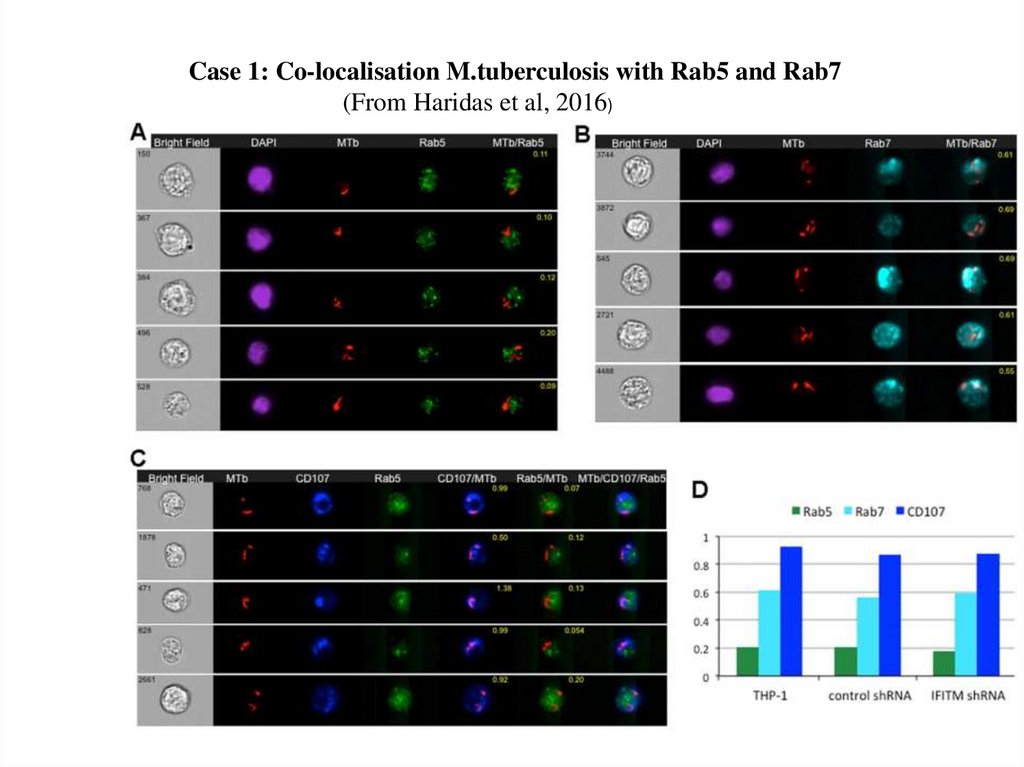
72. Co-localisation
73.
Case 1: Co-localisation M.tuberculosis with Rab5 and Rab7(From Haridas et al, 2016)
74. Co-localisation of S.aureus/dihydroethidium (oxidative burst in human whole blood) (Ploppa et al, 2011)
75. Nuclear fragmentation/caspase activity
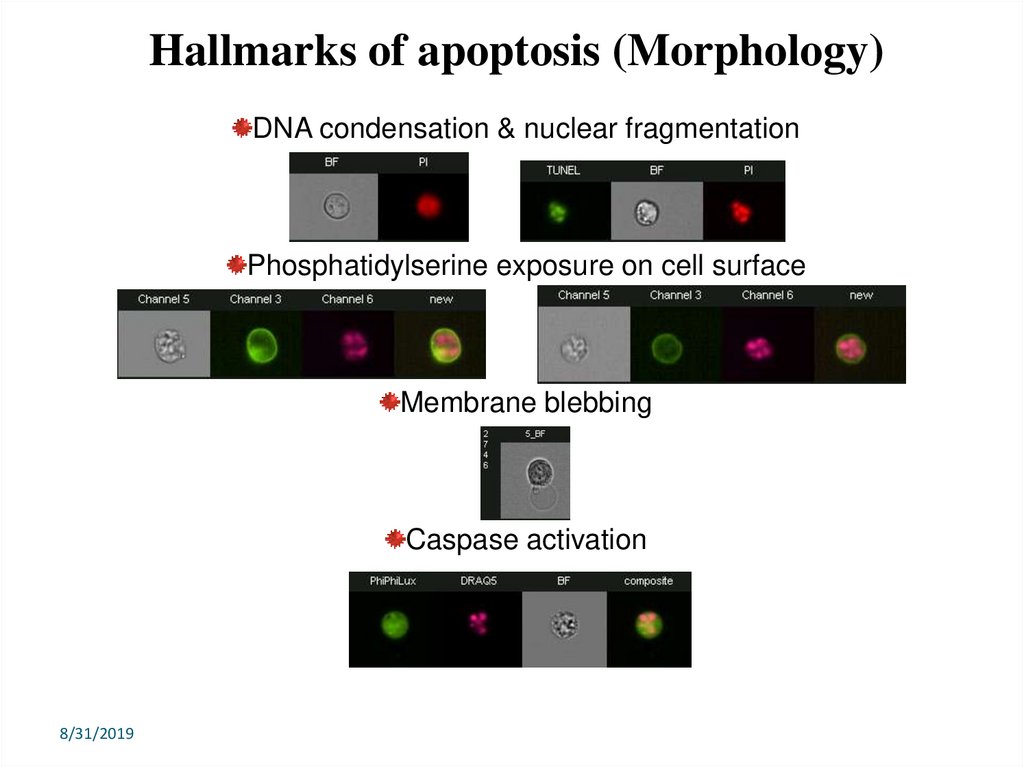
76.
Hallmarks of apoptosis (Morphology)DNA condensation & nuclear fragmentation
Phosphatidylserine exposure on cell surface
Membrane blebbing
Caspase activation
8/31/2019