


 finance
Similar presentations:


")

Financial and Economic Analysis
1. Financial and Economic Analysis
FINANCIAL ANDECONOMIC ANALYSIS
Chapter 3
2.
■ Financial analysis is the study of the main indicators of the financial condition andfinancial performance of an organization in order to make management, investment
and other decisions by interested parties.
3.
■ Financial analysis includes analysis of the assets and liabilities of the organization,its solvency, liquidity, financial results and financial stability, analysis of asset
turnover (business activity). Financial analysis allows to identify such important
aspects as the possible probability of bankruptcy. Financial analysis is an integral
part of such specialists as auditors, appraisers
4. The main components of the financial - economic analysis of the enterprise are
The main components of the financial economic analysis of the enterprise are■ accounting analysis;
■ horizontal analysis;
■ vertical analysis;
■ trend analysis;
■ calculation of financial ratios.
5.
■ Horizontal analysis is comparing reporting indicators with indicators of previousperiods.
■ Vertical analysis is carried out in order to identify the proportion of individual
reporting items in the total final indicator and then compare the result with the data
of the previous period.
■ The trend analysis is based on the calculation of the relative deviations of the
reporting indicators for a number of years from the level of the base year.
6. Calculation of financial ratios
calculation offinancial ratios
indicators for
which standard
values are defined
non-normed
indicators
7. Altman Z-score
■ The Z-score formula for predicting bankruptcy was published in 1968 by Edward I.Altman
■ The formula may be used to predict the probability that a firm will go
into bankruptcy within two years
8.
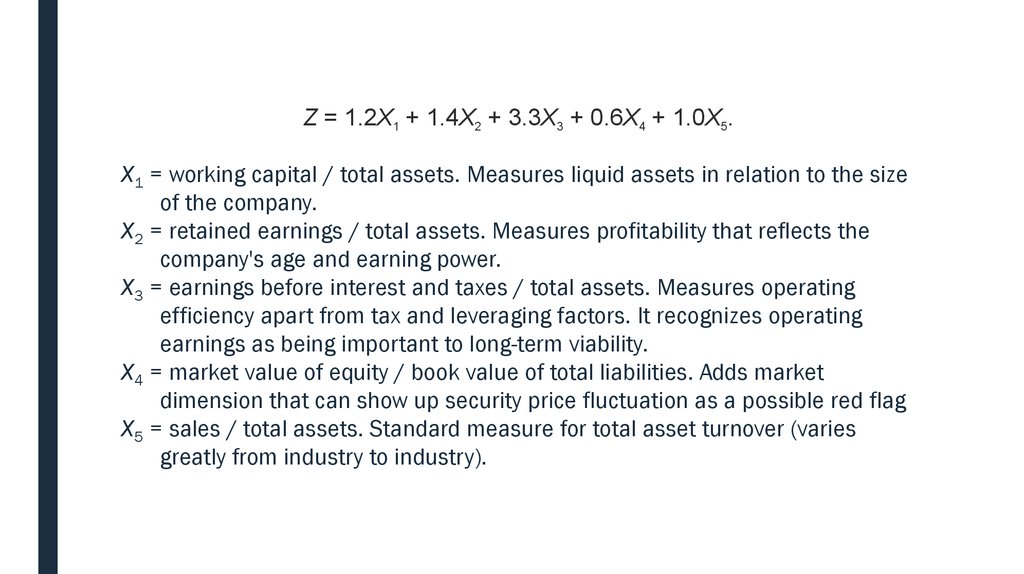
Z = 1.2X1 + 1.4X2 + 3.3X3 + 0.6X4 + 1.0X5.X1 = working capital / total assets. Measures liquid assets in relation to the size
of the company.
X2 = retained earnings / total assets. Measures profitability that reflects the
company's age and earning power.
X3 = earnings before interest and taxes / total assets. Measures operating
efficiency apart from tax and leveraging factors. It recognizes operating
earnings as being important to long-term viability.
X4 = market value of equity / book value of total liabilities. Adds market
dimension that can show up security price fluctuation as a possible red flag
X5 = sales / total assets. Standard measure for total asset turnover (varies
greatly from industry to industry).
9. Z-score estimated for non-manufacturers & emerging markets
Z-score estimated for nonmanufacturers & emerging marketsZ = 6.56X1 + 3.26X2 + 6.72X3 + 1.05X4
Z = 3.25 + 6.56X1 + 3.26X2 + 6.72X3 + 1.05X4 (emerging markets)
■ X1 = (current assets − current liabilities) / total assets
■ X2 = retained earnings / total assets
■ X3 = earnings before interest and taxes / total assets
■ X4 = book value of equity / total liabilities
10. Zones of discriminations
■ Z > 2.6 – “Safe” Zone, low probability of bankruptcy■ 1.1 < Z < 2.6 – “Grey” Zone, border state, the probability of bankruptcy is not high,
but not excluded;
■ Z < 1.1 – “Distress” Zone, there is a probability of bankruptcy of the enterprise
11. Z-score estimated for manufacturing enterprises
Z′ = 0.717X1 + 0.847X2 + 3.107X3 + 0.420X4 + 0.998X5■ X1 = (current assets − current liabilities) / total assets
■ X2 = retained earnings / total assets
■ X3 = earnings before interest and taxes / total assets
■ X4 = book value of equity / total liabilities
■ X5 = sales / total assets
12. Zones of discrimination:
■ Z′ > 2.9 – “Safe” Zone■ 1.23 < Z′ < 2.9 – “Grey” Zone
■ Z′ < 1.23 – “Distress” Zone
13. Commonly-used financial ratios can be divided into the following five categories.
Commonly-used financial ratios can bedivided into the following five categories.
■ Liquidity or Solvency Ratios
■ Financial Leverage or Debt Ratios
■ Asset Efficiency or Turnover Ratios
■ Profitability Ratios
■ Market Value Ratios
14. 3.3 Solvency analysis
■ The solvency of an enterprise is the ability of a company to pay itslong-term debt and the interest on that debt.
■ Solvency is one of the key features of a normal (sustainable) financial
position of an enterprise. Solvency ratios, as a part of financial ratio
analysis, help the business owner determine the chances of the firm's
long-term survival
15. The solvency of the company consists of two factors:
1. Availability ofassets
2. The degree of
liquidity of assets
16.
■ In the analysis of the first factor, the organization has net assets (equity).■ If the organization has negative net assets, i.e. If there is no equity capital, then in
principle it cannot pay off all of its obligations. Such an organization can be solvent
in the short term, rely on current debts, but in the long term, there is a high
probability of bankruptcy.
17.
■ If an organization has positive net assets, this does not indicate its good solvency.■ It is necessary to analyze the second factor - liquidity of assets.
■ A situation may arise where there is a discrepancy between the liquidity of the
assets and the forthcoming maturity of the liability.
■ For example, an enterprise, on the one hand, has a large share of non-current
assets that are more difficult to realize (low-liquid assets), on the other, a large
proportion of short-term liabilities. In this scenario, there may come a time when the
organization does not have enough money to pay off current liabilities.
18.
■ There are several different solvency ratios, some of them technicaland of use primarily to auditors or corporate analysts, others easily
assessed and of interest to professional accountants, business
owners and shareholders alike. A few of these basic solvency ratios
are:
■ 1) The Total Debt/Total Assets Ratio measures how much of the firm's
asset base is financed using debt.
19.
2) The Equity Ratio explains how much of the company is owned by itsinvestors.
The Equity Ratio = total equity / total assets.
It answers a basic, but very important question: if the company goes out
of business after it pays all liabilities how much will be left for its
investors.
In general, higher equity ratios are typically favorable for companies. This
is usually the case for several reasons.
-
Higher investment levels by shareholders shows potential
shareholders that the company is worth investing in since so many
investors are willing to finance the company.
-
A higher ratio also shows potential creditors that the company is more
sustainable and less risky to lend future loans.
20.
■ The Equity Ratio = 100000/150000 = 0,67■ As you can see, ratio is .67. This means that investors rather than debt
are currently funding more assets. 67 percent of the company’s
assets are owned by shareholders and not creditors. Depending on
the industry, this is a healthy ratio.
21.
3) Interest Earned measures a company's ability meet its long-term debtobligations. It's calculated by dividing corporate income before interest
and income taxes (commonly abbreviated EBIT) by interest expense
related to long-term debt.
■ Earnings before interest and taxes ÷ Interest expense = Times interest
earned
The ratio is commonly used by lenders to ascertain whether a
prospective borrower can afford to take on any additional debt. The ratio
is calculated by comparing the earnings of a business that are available
for use in paying down the interest expense on debt, divided by the
amount of interest expense.
22.
■ A ratio of less than one indicates that a business may not be in aposition to pay its interest obligations, and so is more likely to default
on its debt. A much higher ratio is a strong indicator that the ability to
service debt is not a problem for a borrower.
23.
■ The solvency of the company in terms of asset liquidity is analyzed by means ofspecial financial ratios - liquidity ratios:
■ Cash ratio. Compares the amount of cash and investments to short-term liabilities.
This ratio excludes any assets that might not be immediately convertible into cash,
especially inventory.
■ Quick ratio. Same as the cash ratio, but includes accounts receivable as an asset.
This ratio explicitly avoids inventory, which may be difficult to convert into cash.
■ Current ratio. Compares all current assets to all current liabilities. This ratio includes
inventory, which is not especially liquid, and which can therefore mis-represent the
liquidity of a business.
24. 3.4 Financial Leverage Ratios to Measure the Solvency of the Business
■ These ratios compare the overall debt load of a company to its assetsor equity, showing how much of the company assets below to
shareholders vs. creditors.
■ If shareholders own more assets, the company is said to be less
leveraged.
■ If creditors own a majority of assets, the company is said to be highly
leveraged.
■ Clearly, financial leverage ratios help management and investors to
understand how risk level of the capital structure of a company.