


 finance
Similar presentations:

")


Financial statement analysis
1. Financial Statement Analysis
12ePRINCIPLES OF FINANCIAL ACCOUNTING
24e
PRINCIPLES OF ACCOUNTING
2e
Chapter 17
ACCOUNTING PRINCIPLES
Using excel for Success
Prepared by: C. Douglas Cloud
Prepared
Professorby:
Emeritus
C. Douglas
of Accounting
Cloud
Professor
Pepperdine
Emeritus
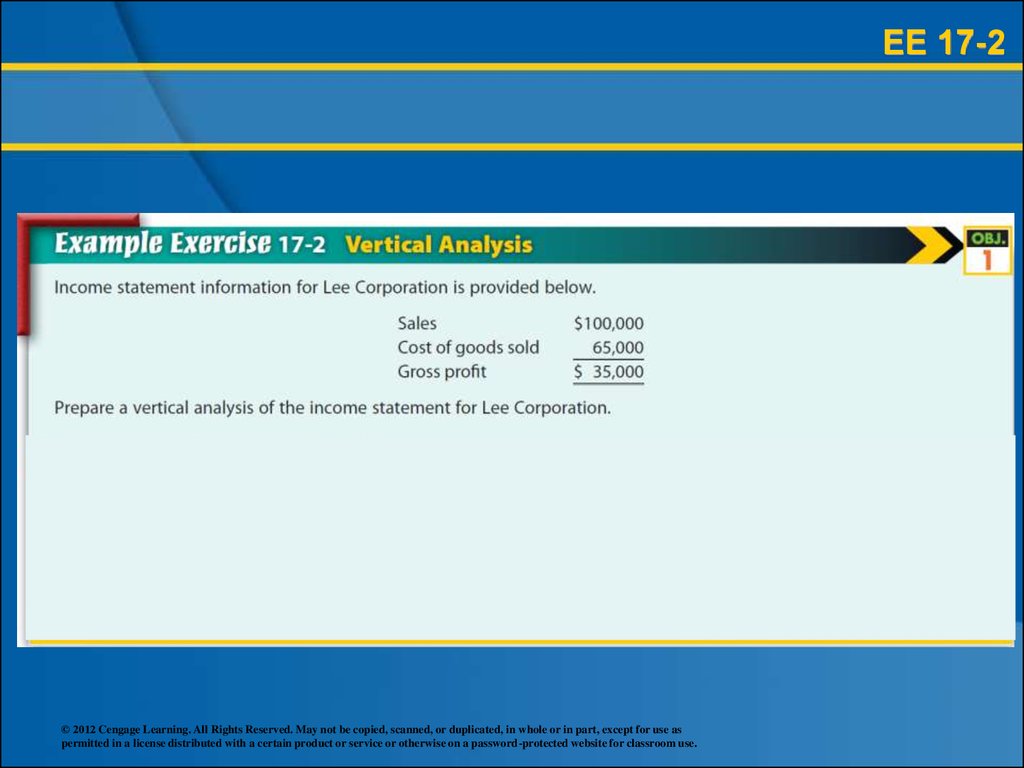
University
of Accounting
Pepperdine University
© 2012 Cengage Learning. All Rights Reserved. May not be copied, scanned, or duplicated, in whole or in part, except for use as
permitted
in a license
distributed
with aReserved.
certain product
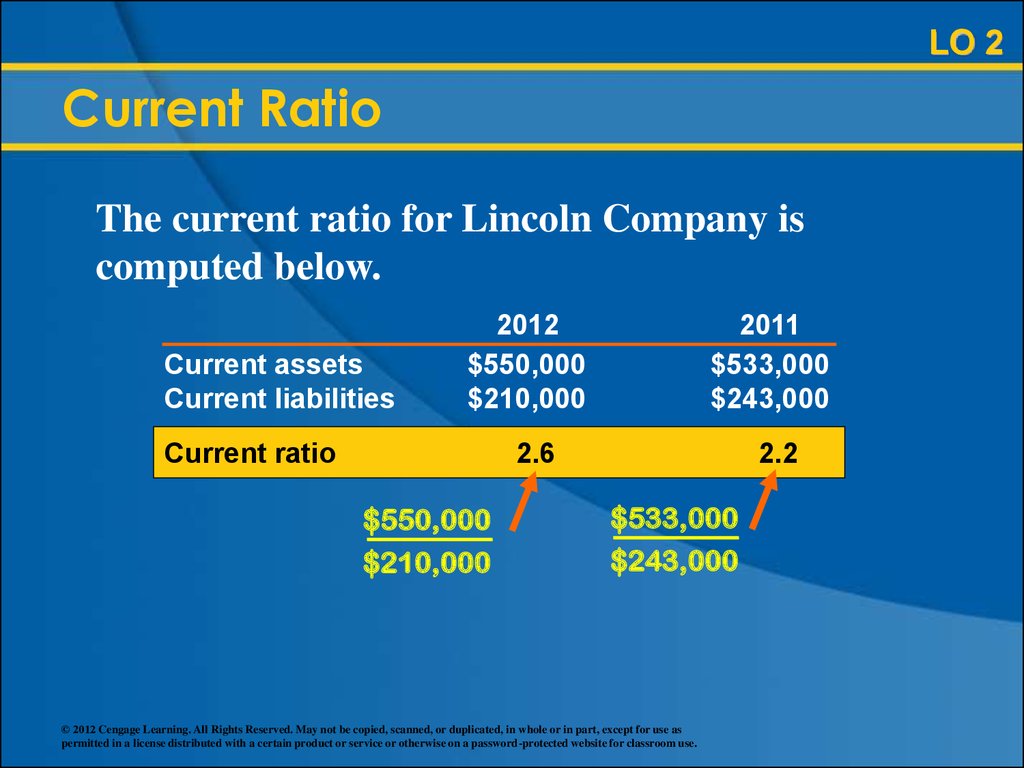
or be
service
or otherwise
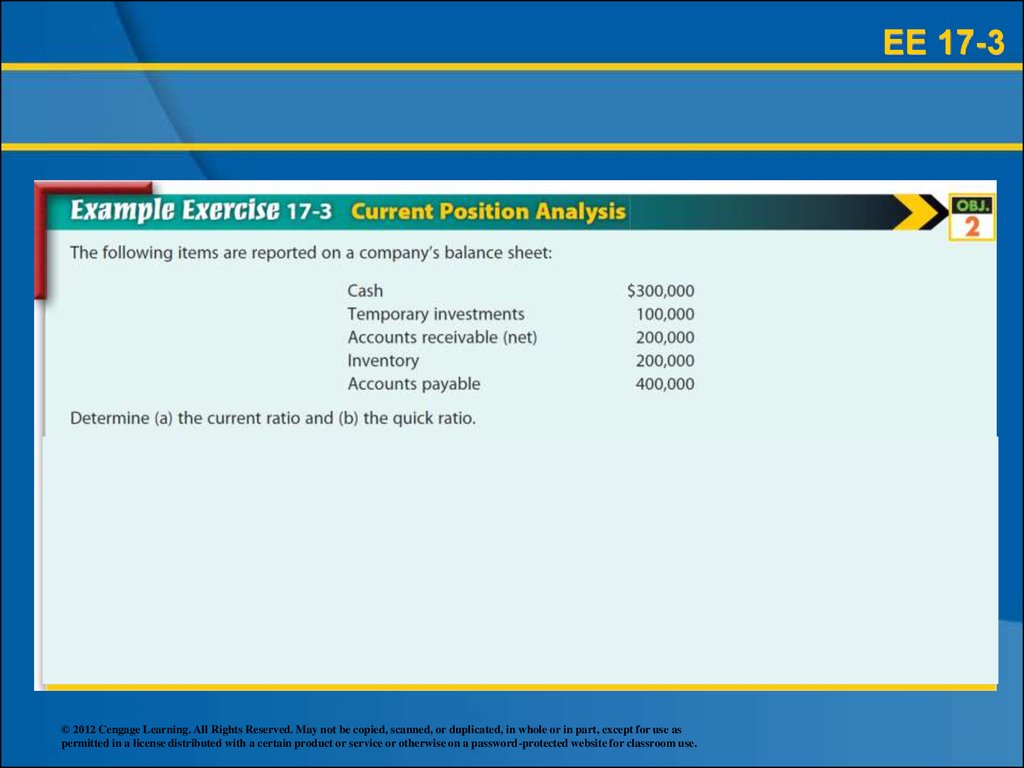
onduplicated,
a password-protected
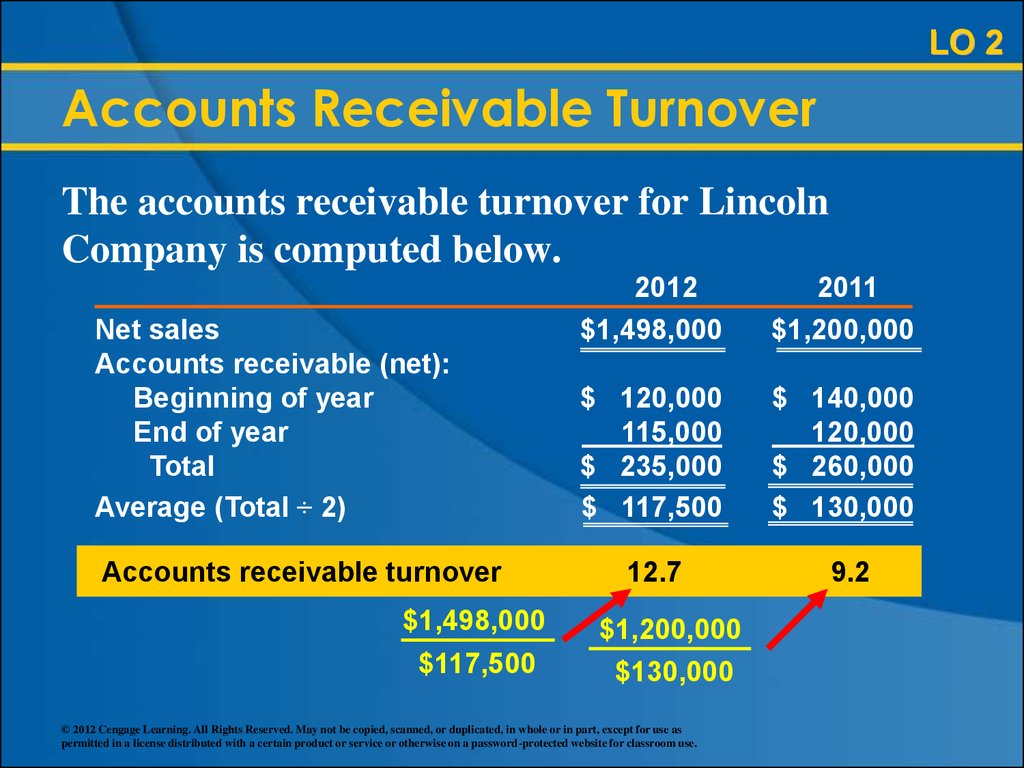
classroom
© 2012 Cengage
Learning.
All Rights
May not
copied,
scanned, or
in whole or website
in part, for
except
for use use.
as
permitted in a license distributed with a certain product or service or otherwise on a password-protected website for classroom use.
Reeve Warren Duchac
2. Learning Objectives
1. Describe basic financial statementanalytical methods.
2. Use financial statement analysis to assess
the solvency of a business.
3. Use financial statement analysis to assess
the profitability of a business.
4. Describe the contents of corporate annual
reports.
© 2012 Cengage Learning. All Rights Reserved. May not be copied, scanned, or duplicated, in whole or in part, except for use as
permitted in a license distributed with a certain product or service or otherwise on a password-protected website for classroom use.
3. Learning Objective 1
1. Describe basic financial statementanalytical methods.
© 2012 Cengage Learning. All Rights Reserved. May not be copied, scanned, or duplicated, in whole or in part, except for use as
permitted in a license distributed with a certain product or service or otherwise on a password-protected website for classroom use.
4. Basic Analytical Methods
LO 1Basic Analytical Methods
Users analyze a company’s financial
statements using a variety of analytical
methods. Three such methods are as
follows:
Horizontal analysis
Vertical analysis
Common-sized statements
© 2012 Cengage Learning. All Rights Reserved. May not be copied, scanned, or duplicated, in whole or in part, except for use as
permitted in a license distributed with a certain product or service or otherwise on a password-protected website for classroom use.
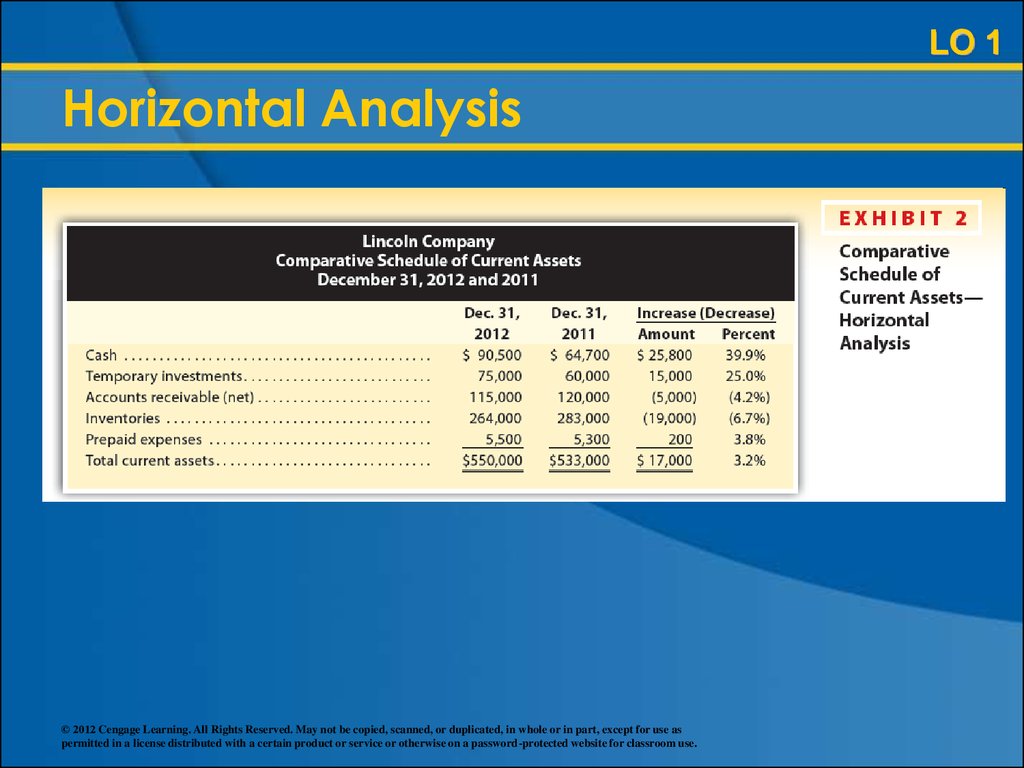
5. Horizontal Analysis
LO 1Horizontal Analysis
The percentage analysis of increases and
decreases in related items in comparative
financial statements is called horizontal
analysis.
© 2012 Cengage Learning. All Rights Reserved. May not be copied, scanned, or duplicated, in whole or in part, except for use as
permitted in a license distributed with a certain product or service or otherwise on a password-protected website for classroom use.
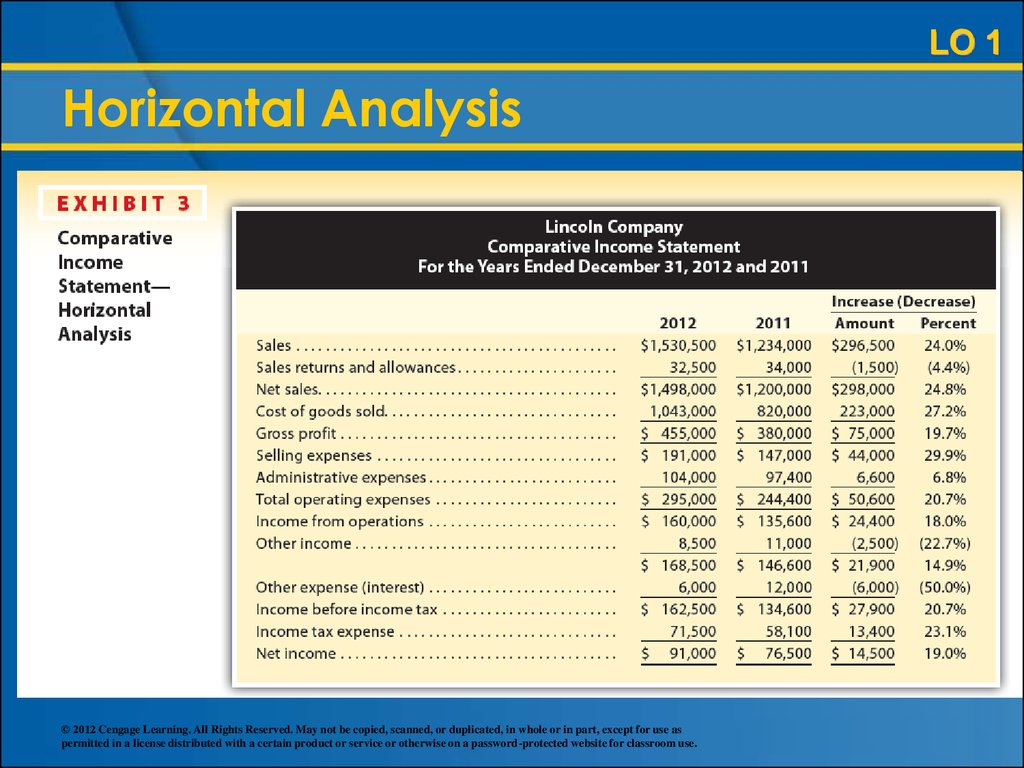
6. Horizontal Analysis
LO 1Horizontal Analysis
© 2012 Cengage Learning. All Rights Reserved. May not be copied, scanned, or duplicated, in whole or in part, except for use as
permitted in a license distributed with a certain product or service or otherwise on a password-protected website for classroom use.
7.
LO 1Horizontal Analysis
Horizontal
Analysis:
Difference
Base year (2011)
$17,000
= 3.2%
$533,000
© 2012 Cengage Learning. All Rights Reserved. May not be copied, scanned, or duplicated, in whole or in part, except for use as
permitted in a license distributed with a certain product or service or otherwise on a password-protected website for classroom use.
8.
LO 1Horizontal Analysis
© 2012 Cengage Learning. All Rights Reserved. May not be copied, scanned, or duplicated, in whole or in part, except for use as
permitted in a license distributed with a certain product or service or otherwise on a password-protected website for classroom use.
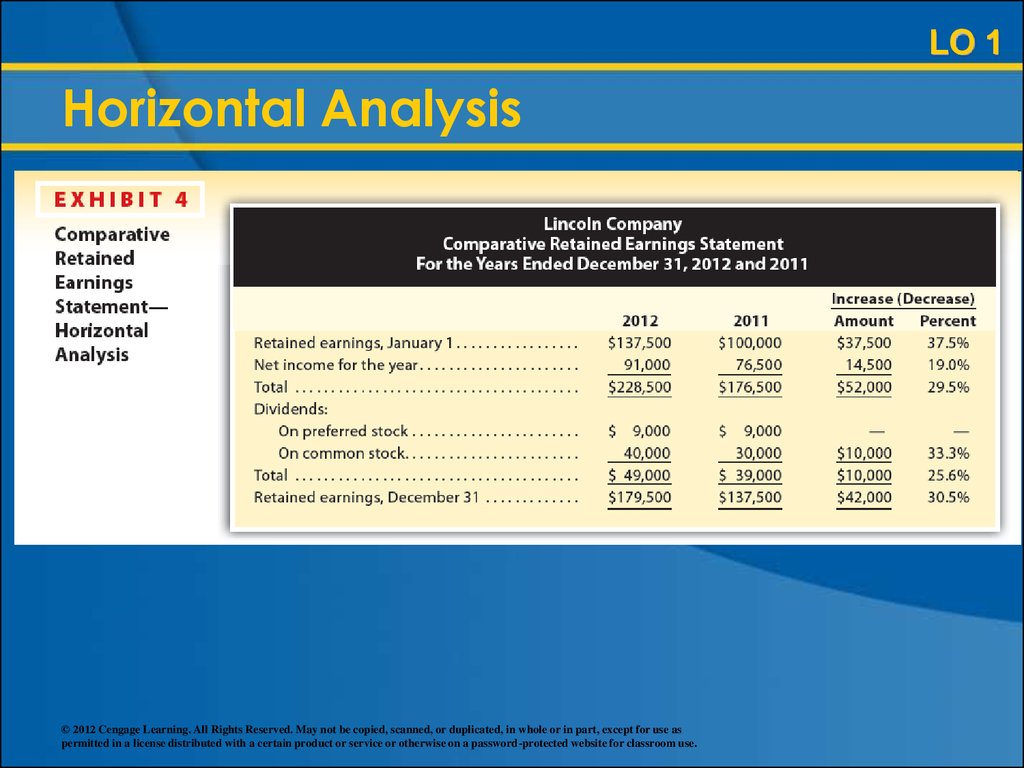
9. Horizontal Analysis
LO 1Horizontal Analysis
Horizontal
Analysis:
Difference
Base year (2011)
$25,800
= 39.9%
$64,700
© 2012 Cengage Learning. All Rights Reserved. May not be copied, scanned, or duplicated, in whole or in part, except for use as
permitted in a license distributed with a certain product or service or otherwise on a password-protected website for classroom use.
10.
LO 1Horizontal Analysis
© 2012 Cengage Learning. All Rights Reserved. May not be copied, scanned, or duplicated, in whole or in part, except for use as
permitted in a license distributed with a certain product or service or otherwise on a password-protected website for classroom use.
11. Horizontal Analysis
LO 1Horizontal Analysis
Horizontal
Analysis:
Difference
Base year (2011)
$296,500
= 24.0%
$1,234,000
© 2012 Cengage Learning. All Rights Reserved. May not be copied, scanned, or duplicated, in whole or in part, except for use as
permitted in a license distributed with a certain product or service or otherwise on a password-protected website for classroom use.
12.
LO 1Horizontal Analysis
© 2012 Cengage Learning. All Rights Reserved. May not be copied, scanned, or duplicated, in whole or in part, except for use as
permitted in a license distributed with a certain product or service or otherwise on a password-protected website for classroom use.
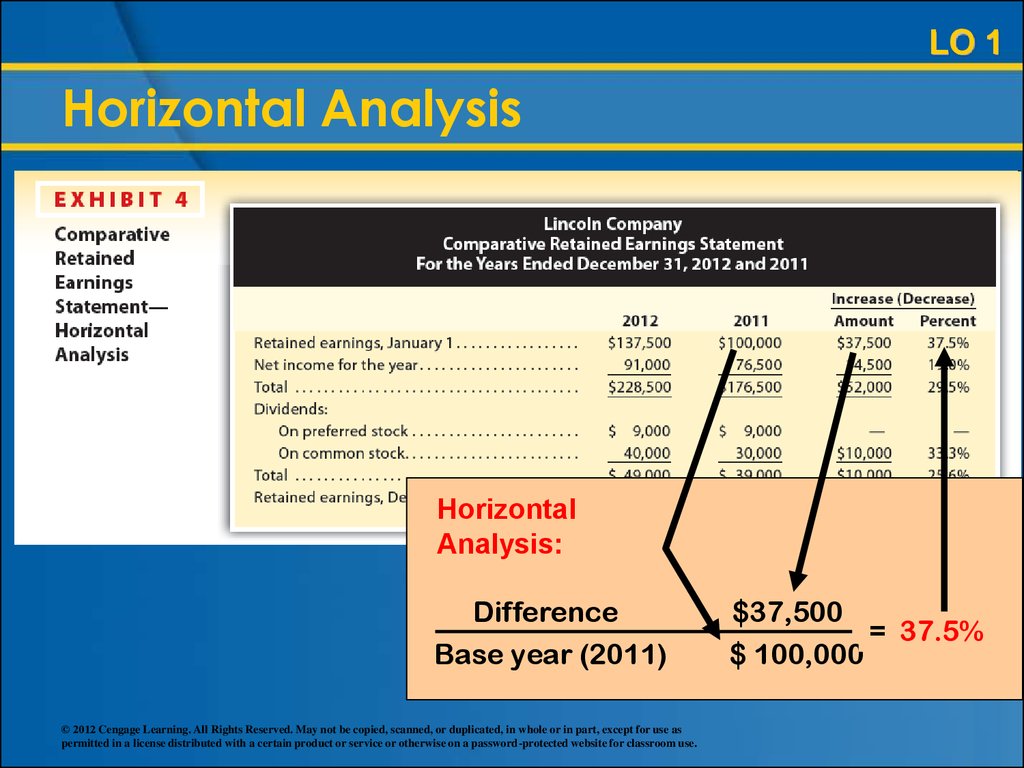
13.
LO 1Horizontal Analysis
Horizontal
Analysis:
Difference
Base year (2011)
© 2012 Cengage Learning. All Rights Reserved. May not be copied, scanned, or duplicated, in whole or in part, except for use as
permitted in a license distributed with a certain product or service or otherwise on a password-protected website for classroom use.
$37,500
= 37.5%
$ 100,000
14.
EE 17-1© 2012 Cengage Learning. All Rights Reserved. May not be copied, scanned, or duplicated, in whole or in part, except for use as
permitted in a license distributed with a certain product or service or otherwise on a password-protected website for classroom use.
15. Vertical Analysis
LO 1Vertical Analysis
A percentage analysis used to show the
relationship of each component to the total
within a single financial statement is called
vertical analysis.
© 2012 Cengage Learning. All Rights Reserved. May not be copied, scanned, or duplicated, in whole or in part, except for use as
permitted in a license distributed with a certain product or service or otherwise on a password-protected website for classroom use.
16. Vertical Analysis
LO 1Vertical Analysis
In a vertical analysis of the balance sheet,
each asset item is stated as a percent of the
total assets.
Each liability and stockholders’ equity item
is stated as a percent of the total liabilities
and stockholders’ equity.
© 2012 Cengage Learning. All Rights Reserved. May not be copied, scanned, or duplicated, in whole or in part, except for use as
permitted in a license distributed with a certain product or service or otherwise on a password-protected website for classroom use.
17. Vertical Analysis
LO 1Vertical Analysis
© 2012 Cengage Learning. All Rights Reserved. May not be copied, scanned, or duplicated, in whole or in part, except for use as
permitted in a license distributed with a certain product or service or otherwise on a password-protected website for classroom use.
18. Vertical Analysis
LO 1Vertical Analysis
Vertical
Analysis:
Current Assets
$550,000
= 48.3%
Total Assets $ 1,139,500
© 2012 Cengage Learning. All Rights Reserved. May not be copied, scanned, or duplicated, in whole or in part, except for use as
permitted in a license distributed with a certain product or service or otherwise on a password-protected website for classroom use.
19. Vertical Analysis
LO 1Vertical Analysis
In a vertical analysis of the income
statement, each item is stated as a percent
of net sales.
© 2012 Cengage Learning. All Rights Reserved. May not be copied, scanned, or duplicated, in whole or in part, except for use as
permitted in a license distributed with a certain product or service or otherwise on a password-protected website for classroom use.
20.
LO 1Vertical Analysis
© 2012 Cengage Learning. All Rights Reserved. May not be copied, scanned, or duplicated, in whole or in part, except for use as
permitted in a license distributed with a certain product or service or otherwise on a password-protected website for classroom use.
21. Vertical Analysis
LO 1Vertical Analysis
Vertical Analysis:
Selling expenses $191,000
= 12.8%
Net sales
$1,498,000
© 2012 Cengage Learning. All Rights Reserved. May not be copied, scanned, or duplicated, in whole or in part, except for use as
permitted in a license distributed with a certain product or service or otherwise on a password-protected website for classroom use.
22.
EE 17-2© 2012 Cengage Learning. All Rights Reserved. May not be copied, scanned, or duplicated, in whole or in part, except for use as
permitted in a license distributed with a certain product or service or otherwise on a password-protected website for classroom use.
23. Common-Sized Statements
LO 1Common-Sized Statements
In a common-sized statement, all items are
expressed as percentages with no dollar
amounts shown.
Common-sized statements are useful for
comparing the current period with prior
periods, individual businesses with one
another, or one business with industry
averages.
© 2012 Cengage Learning. All Rights Reserved. May not be copied, scanned, or duplicated, in whole or in part, except for use as
permitted in a license distributed with a certain product or service or otherwise on a password-protected website for classroom use.
24. Common-Sized Statements
LO 1Common-Sized Statements
© 2012 Cengage Learning. All Rights Reserved. May not be copied, scanned, or duplicated, in whole or in part, except for use as
permitted in a license distributed with a certain product or service or otherwise on a password-protected website for classroom use.
25. Learning Objective 2
1. Describe basic financial statementanalytical methods.
2. Use financial statement analysis to assess
the solvency of a business.
© 2012 Cengage Learning. All Rights Reserved. May not be copied, scanned, or duplicated, in whole or in part, except for use as
permitted in a license distributed with a certain product or service or otherwise on a password-protected website for classroom use.
26. Solvency Analysis
LO 2Solvency Analysis
All users of financial statements are
interested in the ability of a company to do
the following:
Meet its financial obligations (debts),
called solvency.
Earn income, called profitability.
© 2012 Cengage Learning. All Rights Reserved. May not be copied, scanned, or duplicated, in whole or in part, except for use as
permitted in a license distributed with a certain product or service or otherwise on a password-protected website for classroom use.
27. Solvency Analysis
LO 2Solvency Analysis
Solvency analysis focuses on the ability of a
business to pay its current and noncurrent
liabilities.
Solvency and profitability are interrelated. A
company that cannot pay its debts will have
difficulty obtaining credit, which can
decrease its profitability.
© 2012 Cengage Learning. All Rights Reserved. May not be copied, scanned, or duplicated, in whole or in part, except for use as
permitted in a license distributed with a certain product or service or otherwise on a password-protected website for classroom use.
28. Current Position Analysis
LO 2Current Position Analysis
A company’s ability to pay its current
liabilities is called current position analysis. It
is of special interest to short-term creditors.
© 2012 Cengage Learning. All Rights Reserved. May not be copied, scanned, or duplicated, in whole or in part, except for use as
permitted in a license distributed with a certain product or service or otherwise on a password-protected website for classroom use.
29. Working Capital
LO 2Working Capital
The excess of current assets over current
liabilities is called working capital. Working
capital is often used to evaluate a
company’s ability to pay current liabilities.
Working capital is computed as follows:
Working Capital = Current Assets – Current Liabilities
© 2012 Cengage Learning. All Rights Reserved. May not be copied, scanned, or duplicated, in whole or in part, except for use as
permitted in a license distributed with a certain product or service or otherwise on a password-protected website for classroom use.
30. Current Ratio
LO 2Current Ratio
The current ratio, sometimes called the
working capital ratio or bankers’ ratio, also
measures a company’s ability to pay its
current liabilities.
The current ratio is computed as follows:
Current Ratio =
Current Assets
Current Liabilities
© 2012 Cengage Learning. All Rights Reserved. May not be copied, scanned, or duplicated, in whole or in part, except for use as
permitted in a license distributed with a certain product or service or otherwise on a password-protected website for classroom use.
31.
LO 2Current Ratio
The current ratio for Lincoln Company is
computed below.
Current assets
Current liabilities
2012
$550,000
$210,000
Current ratio
2011
$533,000
$243,000
2.6
$550,000
$210,000
2.2
$533,000
$243,000
© 2012 Cengage Learning. All Rights Reserved. May not be copied, scanned, or duplicated, in whole or in part, except for use as
permitted in a license distributed with a certain product or service or otherwise on a password-protected website for classroom use.
32. Quick Ratio
LO 2Quick Ratio
A ratio that measures the “instant” debtpaying ability of a company is called the
quick ratio, or acid-test ratio. It is computed
as follows:
Quick Ratio =
Quick Assets
Current Liabilities
Quick assets are cash
and other assets that
can be easily
converted to cash.
© 2012 Cengage Learning. All Rights Reserved. May not be copied, scanned, or duplicated, in whole or in part, except for use as
permitted in a license distributed with a certain product or service or otherwise on a password-protected website for classroom use.
33. Quick Assets
LO 2Quick Assets
The quick ratio for Lincoln Company is computed
below.
Quick assets:
Cash
Temporary Investments
Accounts receivable (net)
Total quick assets
Current liabilities
Quick ratio
2012
$ 90,500
75,000
115,000
$280,500
$210,000
1.3
$280,500 $244,700
$210,000 $243,000
© 2012 Cengage Learning. All Rights Reserved. May not be copied, scanned, or duplicated, in whole or in part, except for use as
permitted in a license distributed with a certain product or service or otherwise on a password-protected website for classroom use.
2011
$ 64,700
60,000
120,000
$244,700
$243,000
1.0
34.
EE 17-3© 2012 Cengage Learning. All Rights Reserved. May not be copied, scanned, or duplicated, in whole or in part, except for use as
permitted in a license distributed with a certain product or service or otherwise on a password-protected website for classroom use.
35. Accounts Receivable Turnover
LO 2Accounts Receivable Turnover
The relationship between sales and
accounts receivable may be stated as
accounts receivable turnover. Collecting
accounts receivable as quickly as possible
improves a company’s solvency.
The accounts receivable turnover is
computed as follows:
Accounts Receivable Turnover =
Net Sales
Average Accounts
Receivable
© 2012 Cengage Learning. All Rights Reserved. May not be copied, scanned, or duplicated, in whole or in part, except for use as
permitted in a license distributed with a certain product or service or otherwise on a password-protected website for classroom use.
36.
LO 2Accounts Receivable Turnover
The accounts receivable turnover for Lincoln
Company is computed below.
Net sales
Accounts receivable (net):
Beginning of year
End of year
Total
Average (Total ÷ 2)
Accounts receivable turnover
$1,498,000
$117,500
2012
$1,498,000
2011
$1,200,000
$ 120,000
115,000
$ 235,000
$ 117,500
$ 140,000
120,000
$ 260,000
$ 130,000
12.7
9.2
$1,200,000
$130,000
© 2012 Cengage Learning. All Rights Reserved. May not be copied, scanned, or duplicated, in whole or in part, except for use as
permitted in a license distributed with a certain product or service or otherwise on a password-protected website for classroom use.
37. Number of Days’ Sales in Receivables
LO 2Number of Days’ Sales in Receivables
The number of days’ sales in receivables is
an estimate of the length of time (in days)
the accounts receivable have been
outstanding. It is computed as follows:
Number of Days’ =
Sales in Receivables
Average Accounts
Receivable
Average Daily
Sales
Net Sales
365
© 2012 Cengage Learning. All Rights Reserved. May not be copied, scanned, or duplicated, in whole or in part, except for use as
permitted in a license distributed with a certain product or service or otherwise on a password-protected website for classroom use.
38. Number of Days’ Sales in Receivables
LO 2Number of Days’ Sales in Receivables
The number of days’ sales in receivables for
Lincoln Company is computed below.
2012
Average accounts receivable
(Total accounts receivable ÷ 2)
Net sales
Average daily sales
(Net sales ÷ 365)
$ 117,500
$1,498,000
$ 130,000
$1,200,000
$
$
Number of days’ sales in receivables
$117,500
$4,104
2011
4,104
28.6
$130,000
$3,288
© 2012 Cengage Learning. All Rights Reserved. May not be copied, scanned, or duplicated, in whole or in part, except for use as
permitted in a license distributed with a certain product or service or otherwise on a password-protected website for classroom use.
3,288
39.5
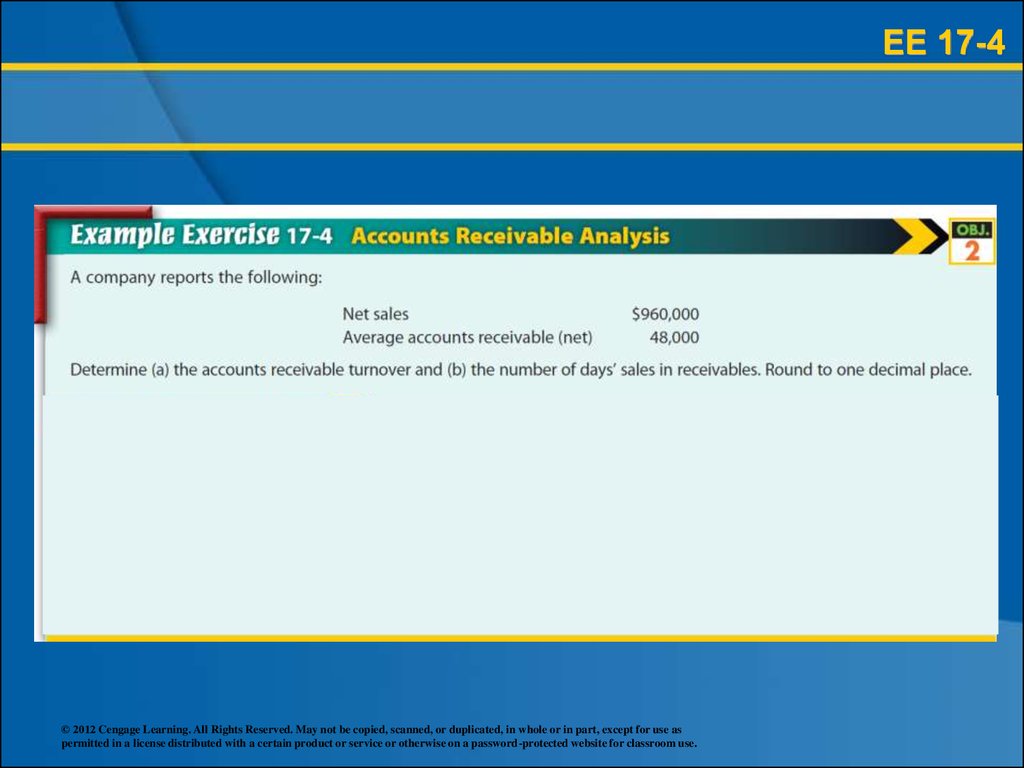
39.
EE 17-4© 2012 Cengage Learning. All Rights Reserved. May not be copied, scanned, or duplicated, in whole or in part, except for use as
permitted in a license distributed with a certain product or service or otherwise on a password-protected website for classroom use.
40. Inventory Turnover
LO 2Inventory Turnover
The relationship between the volume of
goods (merchandise) sold and inventory
may be stated as the inventory turnover. The
purpose of this ratio is to assess the
efficiency of a firm in managing its
inventory.
The inventory turnover is computed as
follows:
Inventory Turnover =
Cost of Goods Sold
Average Inventory
© 2012 Cengage Learning. All Rights Reserved. May not be copied, scanned, or duplicated, in whole or in part, except for use as
permitted in a license distributed with a certain product or service or otherwise on a password-protected website for classroom use.
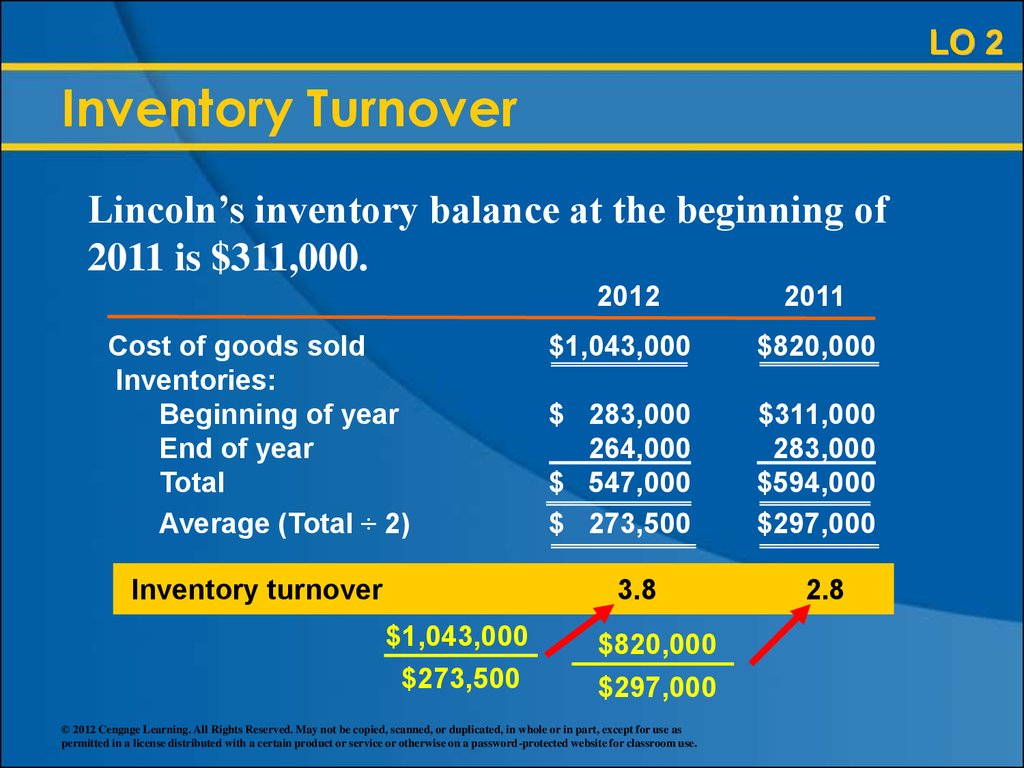
41.
LO 2Inventory Turnover
Lincoln’s inventory balance at the beginning of
2011 is $311,000.
Cost of goods sold
Inventories:
Beginning of year
End of year
Total
Average (Total ÷ 2)
Inventory turnover
2012
2011
$1,043,000
$820,000
$ 283,000
264,000
$ 547,000
$ 273,500
$311,000
283,000
$594,000
$297,000
3.8
$1,043,000
$273,500
$820,000
$297,000
© 2012 Cengage Learning. All Rights Reserved. May not be copied, scanned, or duplicated, in whole or in part, except for use as
permitted in a license distributed with a certain product or service or otherwise on a password-protected website for classroom use.
2.8
42. Number of Days’ Sales in Inventory
LO 2Number of Days’ Sales in Inventory
The number of days’ sales in inventory is a
rough measure of the length of time it takes
to purchase, sell, and replace the inventory.
The number of days’ sales in inventory is
computed as follows:
Average Inventory
Number of Days’
=
Sales in Inventory
Average Daily Cost of
Goods Sold
Cost of Goods Sold
365
© 2012 Cengage Learning. All Rights Reserved. May not be copied, scanned, or duplicated, in whole or in part, except for use as
permitted in a license distributed with a certain product or service or otherwise on a password-protected website for classroom use.
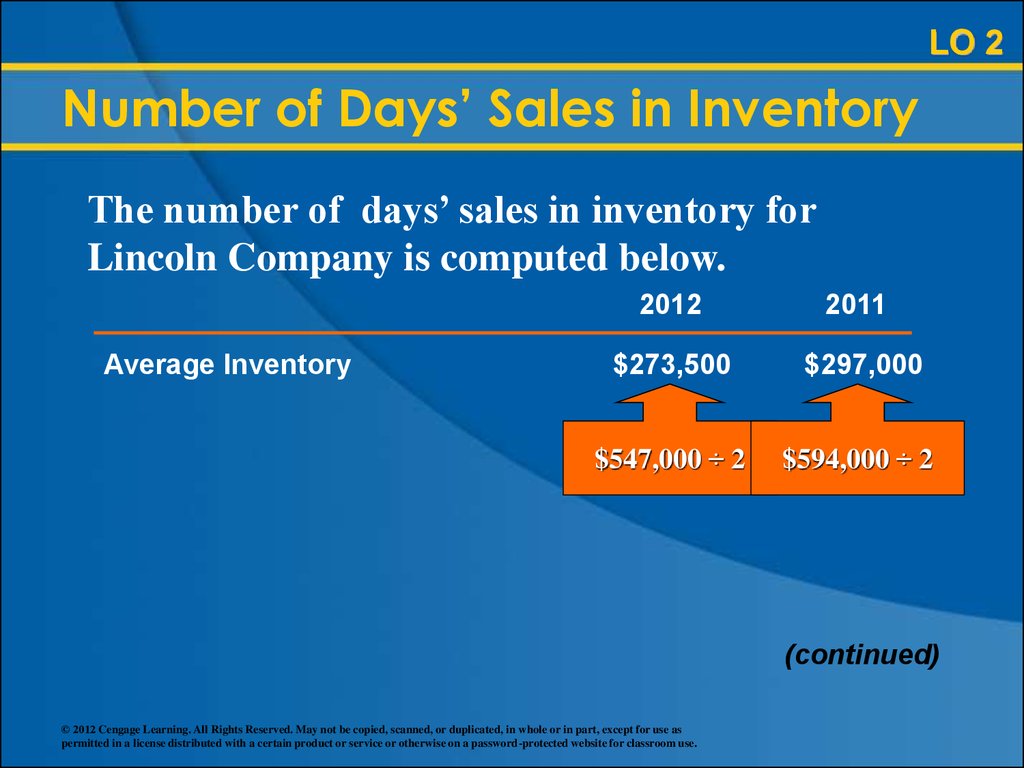
43.
LO 2Number of Days’ Sales in Inventory
The number of days’ sales in inventory for
Lincoln Company is computed below.
Average Inventory
2012
2011
$273,500
$297,000
$547,000 ÷ 2
$594,000 ÷ 2
(continued)
© 2012 Cengage Learning. All Rights Reserved. May not be copied, scanned, or duplicated, in whole or in part, except for use as
permitted in a license distributed with a certain product or service or otherwise on a password-protected website for classroom use.
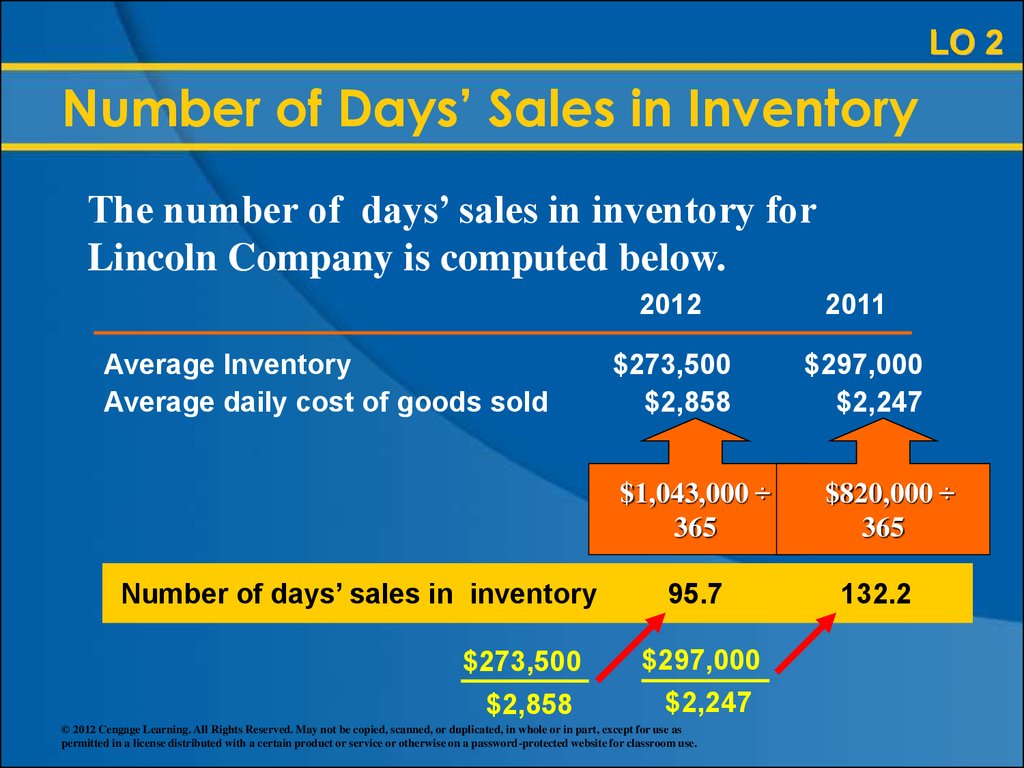
44.
LO 2Number of Days’ Sales in Inventory
The number of days’ sales in inventory for
Lincoln Company is computed below.
Average Inventory
Average daily cost of goods sold
2012
2011
$273,500
$2,858
$297,000
$2,247
$1,043,000 ÷
365
Number of days’ sales in inventory
$273,500
$2,858
95.7
$297,000
$2,247
© 2012 Cengage Learning. All Rights Reserved. May not be copied, scanned, or duplicated, in whole or in part, except for use as
permitted in a license distributed with a certain product or service or otherwise on a password-protected website for classroom use.
$820,000 ÷
365
132.2
45.
EE 17-5© 2012 Cengage Learning. All Rights Reserved. May not be copied, scanned, or duplicated, in whole or in part, except for use as
permitted in a license distributed with a certain product or service or otherwise on a password-protected website for classroom use.
46. Ratio of Fixed Assets to Long-Term Liabilities
LO 2Ratio of Fixed Assets to Long-Term Liabilities
The ratio of fixed assets to long-term
liabilities is a solvency measure that
indicates the margin of safety of the noteholders or bondholders. It also indicates the
ability of the business to borrow additional
funds on a long-term basis.
The ratio is computed as follows:
Ratio of Fixed Assets to
=
Long-Term Liabilities
Fixed Assets (net)
Long-Term
Liabilities
© 2012 Cengage Learning. All Rights Reserved. May not be copied, scanned, or duplicated, in whole or in part, except for use as
permitted in a license distributed with a certain product or service or otherwise on a password-protected website for classroom use.
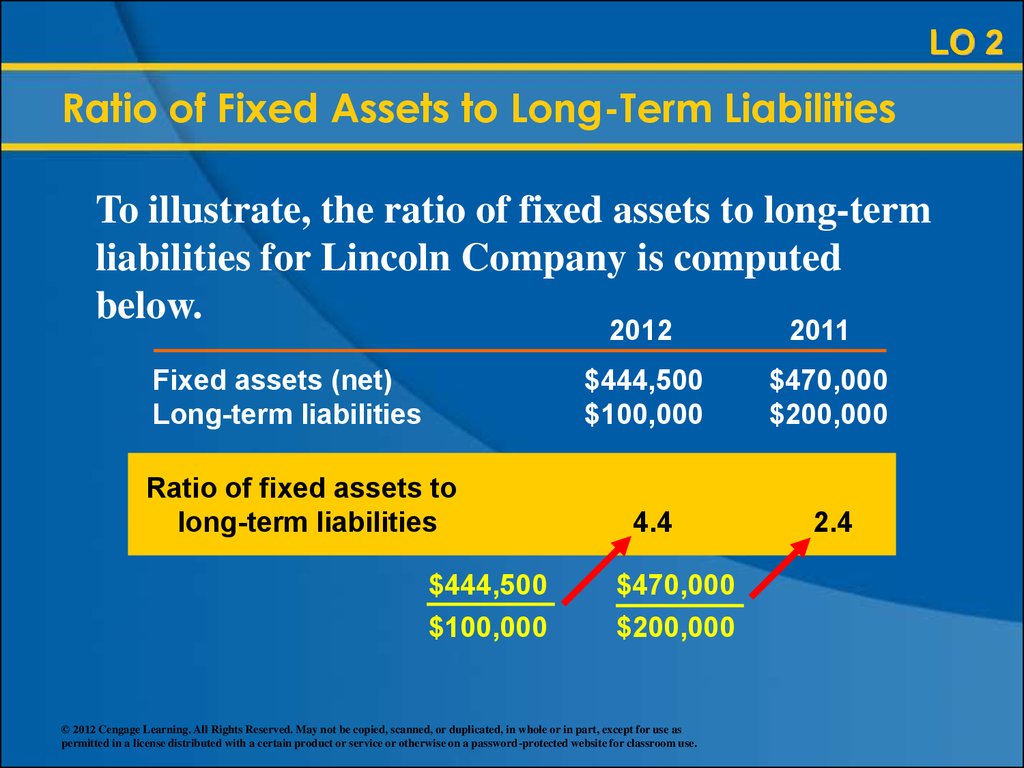
47.
LO 2Ratio of Fixed Assets to Long-Term Liabilities
To illustrate, the ratio of fixed assets to long-term
liabilities for Lincoln Company is computed
below.
2012
Fixed assets (net)
Long-term liabilities
$444,500
$100,000
Ratio of fixed assets to
long-term liabilities
$444,500
$100,000
4.4
$470,000
$200,000
© 2012 Cengage Learning. All Rights Reserved. May not be copied, scanned, or duplicated, in whole or in part, except for use as
permitted in a license distributed with a certain product or service or otherwise on a password-protected website for classroom use.
2011
$470,000
$200,000
2.4
48. Ratio of Liabilities to Stockholders’ Equity
LO 2Ratio of Liabilities to Stockholders’ Equity
The relationship between the total claims of
the creditors and the owners—the ratio of
liabilities to stockholders’ equity—is a
solvency measure that indicates the margin
of safety for creditors.
The ratio is computed as follows:
Total Liabilities
Ratio of Liabilities to
=
Stockholders’ Equity
Total Stockholders’
Equity
© 2012 Cengage Learning. All Rights Reserved. May not be copied, scanned, or duplicated, in whole or in part, except for use as
permitted in a license distributed with a certain product or service or otherwise on a password-protected website for classroom use.
49. Ratio of Liabilities to Stockholders’ Equity
LO 2Ratio of Liabilities to Stockholders’ Equity
The ratio of liabilities to stockholders’ equity for
Lincoln Company is computed below.
2012
Total liabilities
Total stockholders’ equity
Ratio of liabilities to
stockholders’ equity
$310,000
$829,500
2011
$310,000
$829,500
$443,000
$787,500
0.4
0.6
$443,000
$787,500
© 2012 Cengage Learning. All Rights Reserved. May not be copied, scanned, or duplicated, in whole or in part, except for use as
permitted in a license distributed with a certain product or service or otherwise on a password-protected website for classroom use.
50.
EE 17-6© 2012 Cengage Learning. All Rights Reserved. May not be copied, scanned, or duplicated, in whole or in part, except for use as
permitted in a license distributed with a certain product or service or otherwise on a password-protected website for classroom use.
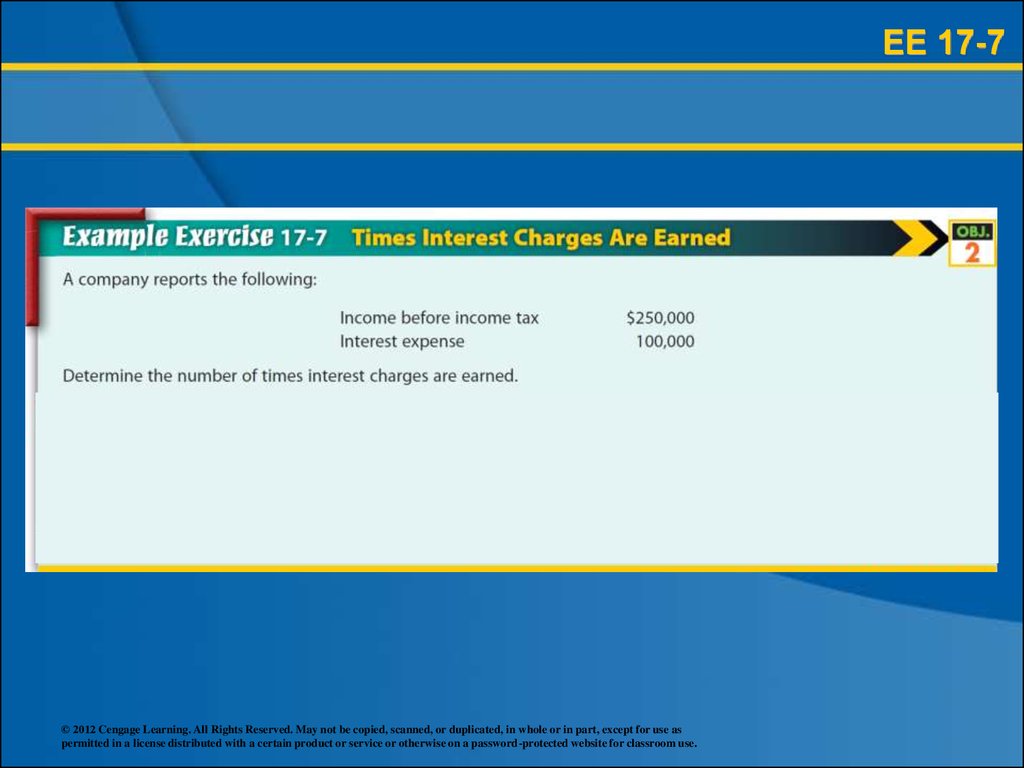
51. Number of Times Interest Charges Earned
LO 2Number of Times Interest Charges Earned
Corporations in some industries normally
have high ratios of debt to stockholders’
equity. For such corporations, the relative
risk of the debt-holders is normally
measured as the number of times interest
charges are earned (during the year),
sometimes called the fixed charge
coverage ratio.
© 2012 Cengage Learning. All Rights Reserved. May not be copied, scanned, or duplicated, in whole or in part, except for use as
permitted in a license distributed with a certain product or service or otherwise on a password-protected website for classroom use.
52. Number of Times Interest Charges Earned
LO 2Number of Times Interest Charges Earned
It is computed as follows:
Number of Times Interest
=
Charges Are Earned
Income Before Income Tax
+ Interest Expense
Interest Expense
© 2012 Cengage Learning. All Rights Reserved. May not be copied, scanned, or duplicated, in whole or in part, except for use as
permitted in a license distributed with a certain product or service or otherwise on a password-protected website for classroom use.
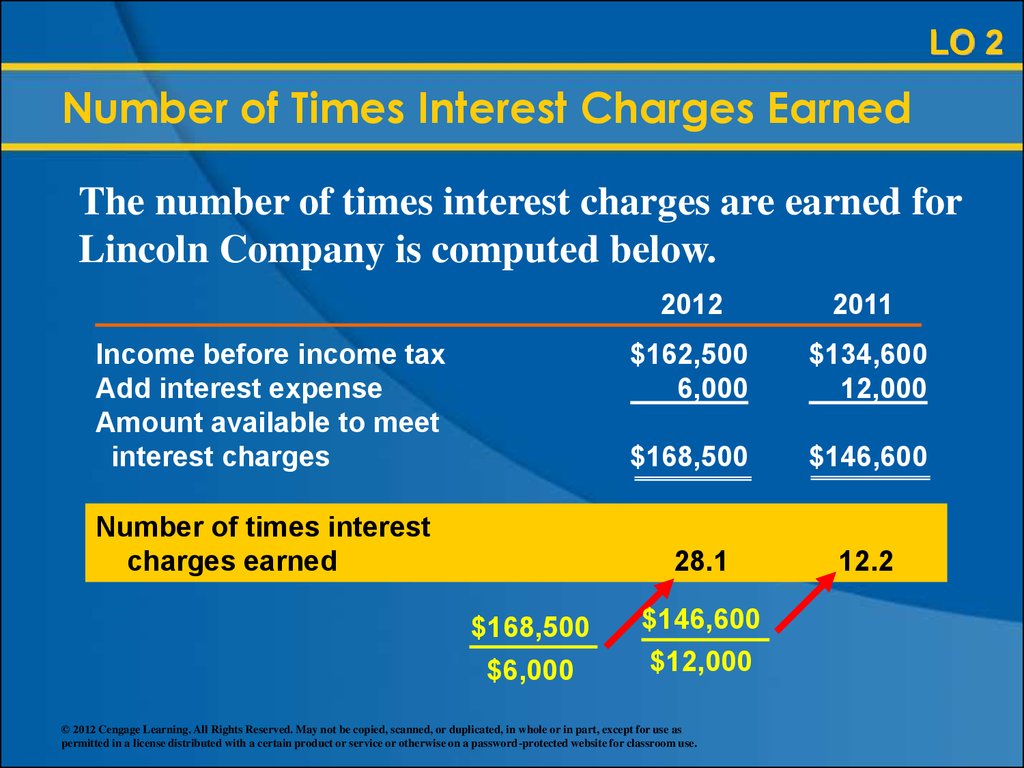
53.
LO 2Number of Times Interest Charges Earned
The number of times interest charges are earned for
Lincoln Company is computed below.
Income before income tax
Add interest expense
Amount available to meet
interest charges
Number of times interest
charges earned
2012
2011
$162,500
6,000
$134,600
12,000
$168,500
$146,600
28.1
$168,500
$6,000
$146,600
$12,000
© 2012 Cengage Learning. All Rights Reserved. May not be copied, scanned, or duplicated, in whole or in part, except for use as
permitted in a license distributed with a certain product or service or otherwise on a password-protected website for classroom use.
12.2
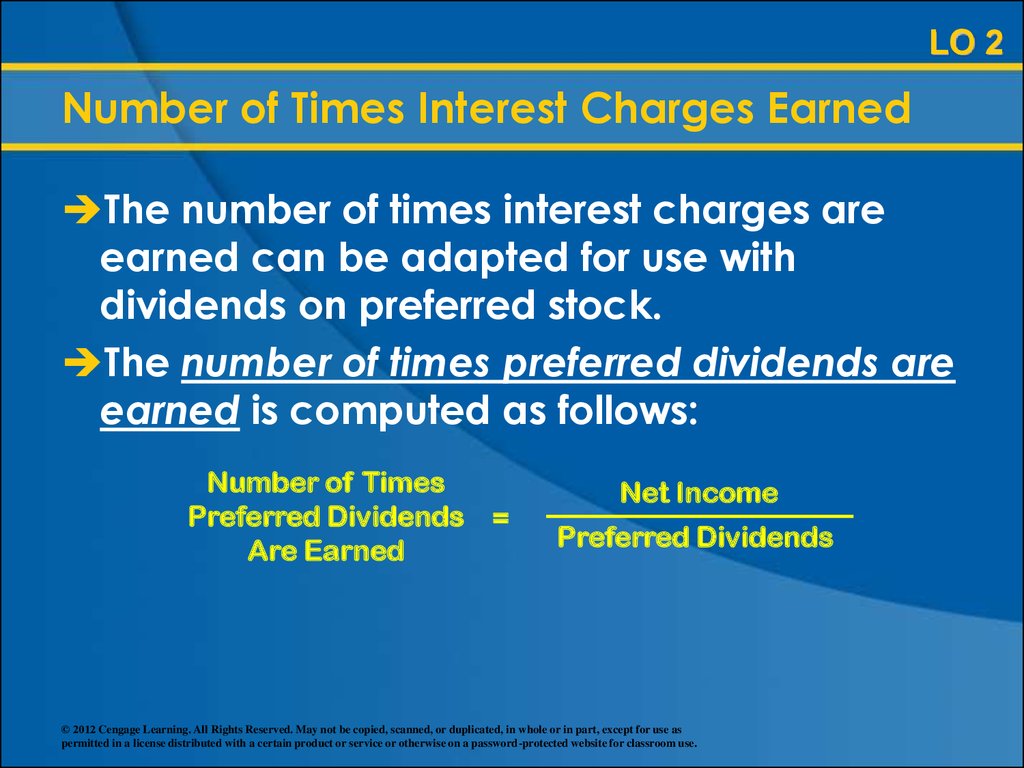
54.
LO 2Number of Times Interest Charges Earned
The number of times interest charges are
earned can be adapted for use with
dividends on preferred stock.
The number of times preferred dividends are
earned is computed as follows:
Number of Times
Preferred Dividends =
Are Earned
Net Income
Preferred Dividends
© 2012 Cengage Learning. All Rights Reserved. May not be copied, scanned, or duplicated, in whole or in part, except for use as
permitted in a license distributed with a certain product or service or otherwise on a password-protected website for classroom use.
55.
EE 17-7© 2012 Cengage Learning. All Rights Reserved. May not be copied, scanned, or duplicated, in whole or in part, except for use as
permitted in a license distributed with a certain product or service or otherwise on a password-protected website for classroom use.
56. Learning Objective 3
1. Describe basic financial statementanalytical methods.
2. Use financial statement analysis to assess
the solvency of a business.
3. Use financial statement analysis to assess
the profitability of a business.
© 2012 Cengage Learning. All Rights Reserved. May not be copied, scanned, or duplicated, in whole or in part, except for use as
permitted in a license distributed with a certain product or service or otherwise on a password-protected website for classroom use.
57. Profitability Analysis
LO 3Profitability Analysis
Profitability analysis focuses primarily on the
relationship between operating results and
the resources available to a business.
© 2012 Cengage Learning. All Rights Reserved. May not be copied, scanned, or duplicated, in whole or in part, except for use as
permitted in a license distributed with a certain product or service or otherwise on a password-protected website for classroom use.
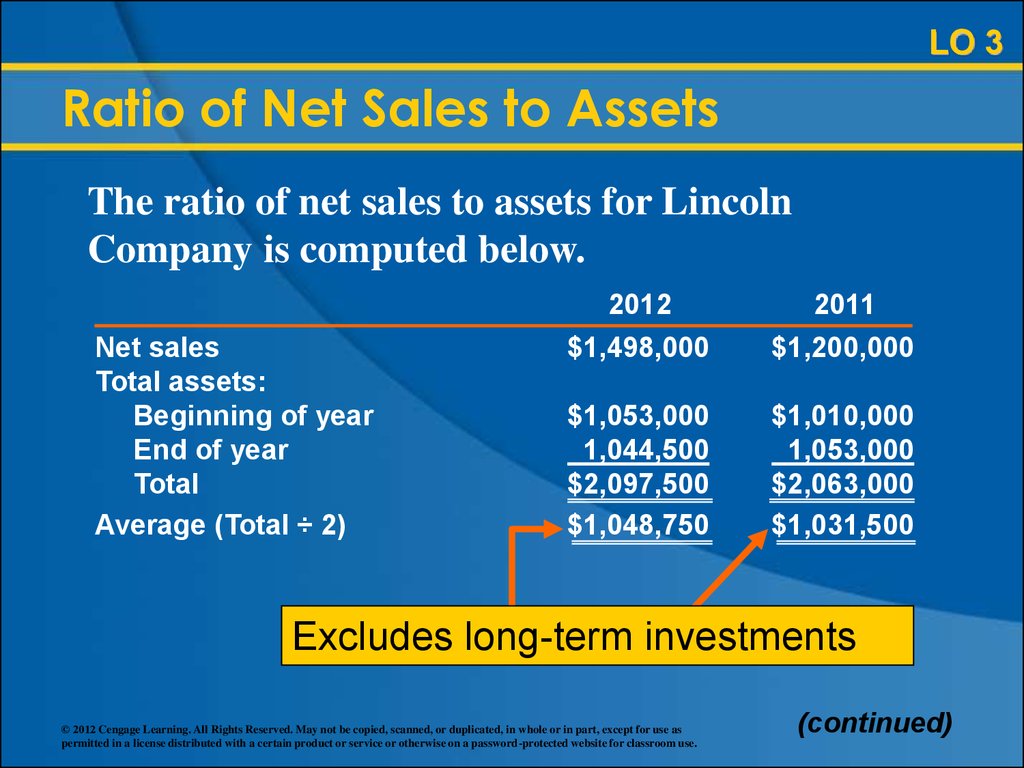
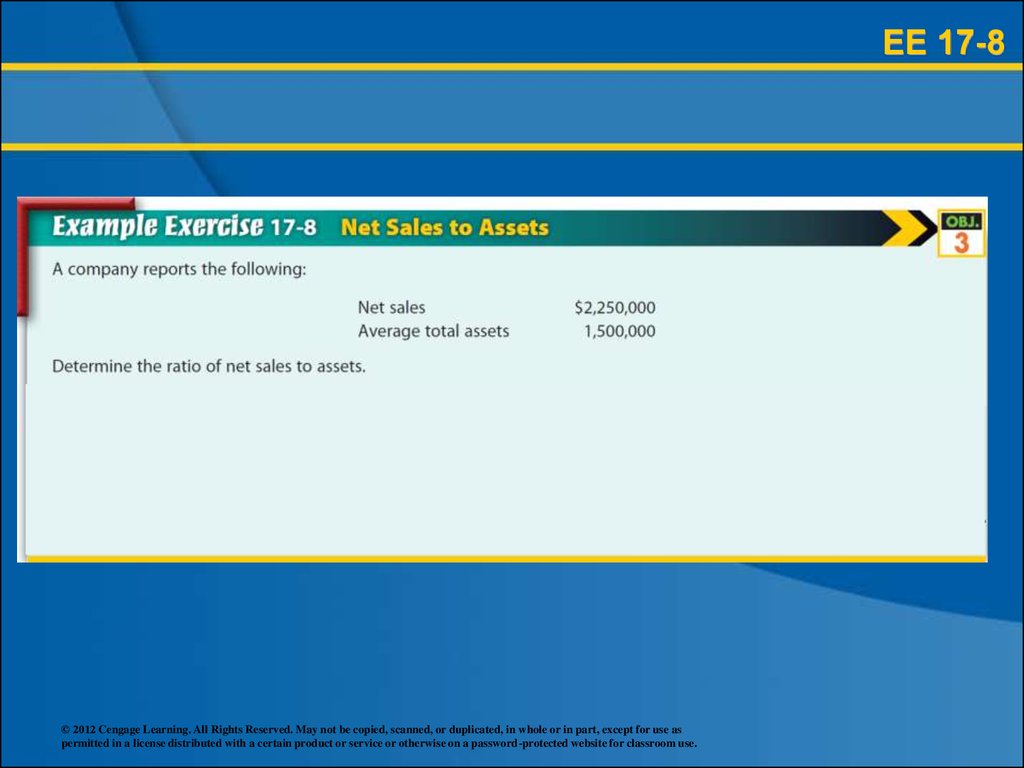
58. Ratio of Net Sales to Assets
LO 3Ratio of Net Sales to Assets
The ratio of net sales to assets is a
profitability measure that shows how
effectively a company utilizes its assets.
The ratio is computed as follows:
Ratio of Net Sales to Assets =
Net Sales
Average Total
Assets
(excluding longterm investments)
© 2012 Cengage Learning. All Rights Reserved. May not be copied, scanned, or duplicated, in whole or in part, except for use as
permitted in a license distributed with a certain product or service or otherwise on a password-protected website for classroom use.
59.
LO 3Ratio of Net Sales to Assets
The ratio of net sales to assets for Lincoln
Company is computed below.
Net sales
Total assets:
Beginning of year
End of year
Total
Average (Total ÷ 2)
2012
$1,498,000
2011
$1,200,000
$1,053,000
1,044,500
$2,097,500
$1,048,750
$1,010,000
1,053,000
$2,063,000
$1,031,500
Excludes long-term investments
© 2012 Cengage Learning. All Rights Reserved. May not be copied, scanned, or duplicated, in whole or in part, except for use as
permitted in a license distributed with a certain product or service or otherwise on a password-protected website for classroom use.
(continued)
60.
LO 3Ratio of Net Sales to Assets
The ratio of net sales to assets for Lincoln
Company is computed below.
Net sales
Total assets:
Beginning of year
End of year
Total
Average (Total ÷ 2)
Ratio of net sales to assets
$1,498,000
$1,048,750
2012
$1,498,000
2011
$1,200,000
$1,053,000
1,044,500
$2,097,500
$1,048,750
$1,010,000
1,053,000
$2,063,000
$1,031,500
1.4
$1,200,000
$1,031,500
© 2012 Cengage Learning. All Rights Reserved. May not be copied, scanned, or duplicated, in whole or in part, except for use as
permitted in a license distributed with a certain product or service or otherwise on a password-protected website for classroom use.
1.2
61.
EE 17-8© 2012 Cengage Learning. All Rights Reserved. May not be copied, scanned, or duplicated, in whole or in part, except for use as
permitted in a license distributed with a certain product or service or otherwise on a password-protected website for classroom use.
62. Rate Earned on Total Assets
LO 3Rate Earned on Total Assets
The rate earned on total assets measures
the profitability of total assets, without
considering how the assets are financed.
It is computed as follows:
Rate Earned on Total Assets =
Net Income +
Interest Expense
Average Total Assets
© 2012 Cengage Learning. All Rights Reserved. May not be copied, scanned, or duplicated, in whole or in part, except for use as
permitted in a license distributed with a certain product or service or otherwise on a password-protected website for classroom use.
63. Rate Earned on Total Assets
LO 3Rate Earned on Total Assets
This ratio for Lincoln Company is computed below.
Total assets are $1,187,500 at the beginning of 2011.
Net income
Plus interest expense
Total
Total assets:
Beginning of year
End of year
Total
Average (Total ÷ 2)
Rate earned on total assets
$97,000
$1,185,000
2012
$ 91,000
6,000
$ 97,000
2011
$ 76,500
12,000
$ 88,500
$1,230,500
1,139,500
$2,370,000
$1,185,000
$1,187,500
1,230,500
$2,418,000
$1,209,000
8.2%
$88,500
$1,209,000
© 2012 Cengage Learning. All Rights Reserved. May not be copied, scanned, or duplicated, in whole or in part, except for use as
permitted in a license distributed with a certain product or service or otherwise on a password-protected website for classroom use.
7.3%
64.
EE 17-9© 2012 Cengage Learning. All Rights Reserved. May not be copied, scanned, or duplicated, in whole or in part, except for use as
permitted in a license distributed with a certain product or service or otherwise on a password-protected website for classroom use.
65. Rate Earned on Stockholders’ Equity
LO 3Rate Earned on Stockholders’ Equity
The rate earned on stockholders’ equity
measures the rate of income earned on the
amount invested by the stockholders.
It is computed as follows:
Rate Earned on
=
Stockholders’ Equity
Net Income
Average Total
Stockholders’ Equity
© 2012 Cengage Learning. All Rights Reserved. May not be copied, scanned, or duplicated, in whole or in part, except for use as
permitted in a license distributed with a certain product or service or otherwise on a password-protected website for classroom use.
66. Rate Earned on Stockholders’ Equity
LO 3Rate Earned on Stockholders’ Equity
The rate for Lincoln Company is computed below.
Total stockholders’ equity is $750,000 at the
beginning of 2011.
Net income
Stockholders’ equity:
Beginning of year
End of year
Total
Average (Total ÷ 2)
Rate earned on stockholders’
equity
$91,000
$808,500
2012
$ 91,000
2011
$ 76,500
$ 787,500
829,500
$1,617,000
$ 808,500
$ 750,000
787,500
$1,537,500
$ 768,750
11.3%
10.0%
$76,500
$768,750
© 2012 Cengage Learning. All Rights Reserved. May not be copied, scanned, or duplicated, in whole or in part, except for use as
permitted in a license distributed with a certain product or service or otherwise on a password-protected website for classroom use.
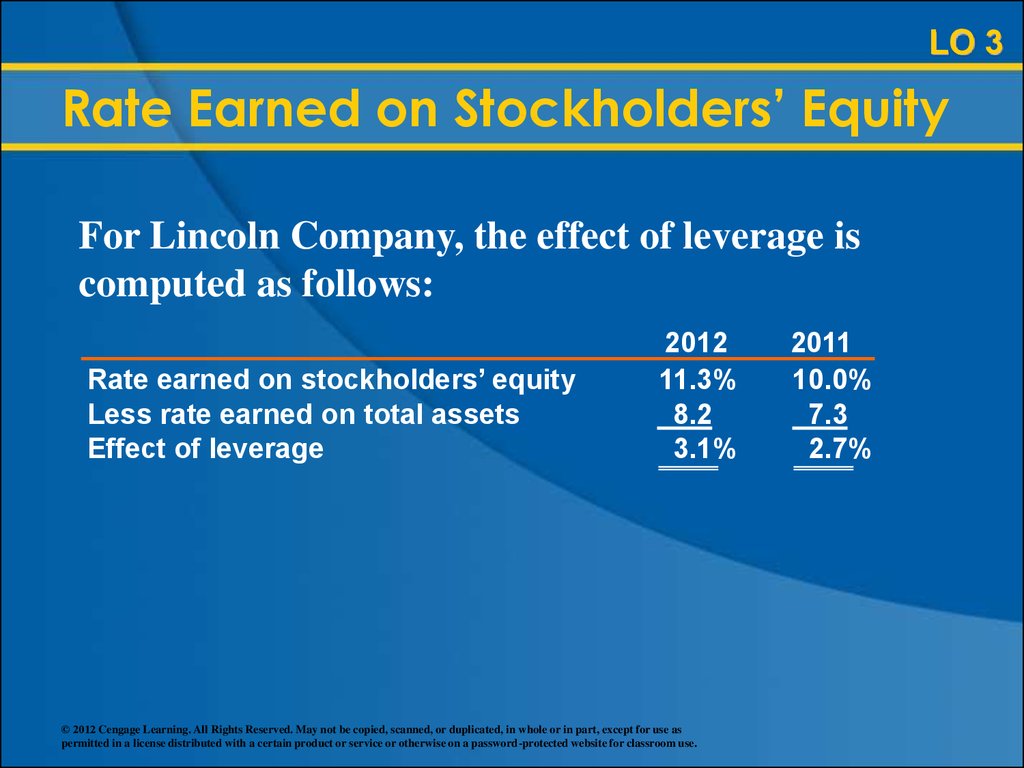
67. Rate Earned on Stockholders’ Equity
LO 3Rate Earned on Stockholders’ Equity
The difference between the rate earned on
stockholders’ equity and the rate earned on
total assets is called leverage.
© 2012 Cengage Learning. All Rights Reserved. May not be copied, scanned, or duplicated, in whole or in part, except for use as
permitted in a license distributed with a certain product or service or otherwise on a password-protected website for classroom use.
68.
LO 3Rate Earned on Stockholders’ Equity
For Lincoln Company, the effect of leverage is
computed as follows:
Rate earned on stockholders’ equity
Less rate earned on total assets
Effect of leverage
2012
11.3%
8.2
3.1%
© 2012 Cengage Learning. All Rights Reserved. May not be copied, scanned, or duplicated, in whole or in part, except for use as
permitted in a license distributed with a certain product or service or otherwise on a password-protected website for classroom use.
2011
10.0%
7.3
2.7%
69. Rate Earned on Stockholders’ Equity
LO 3Rate Earned on Stockholders’ Equity
© 2012 Cengage Learning. All Rights Reserved. May not be copied, scanned, or duplicated, in whole or in part, except for use as
permitted in a license distributed with a certain product or service or otherwise on a password-protected website for classroom use.
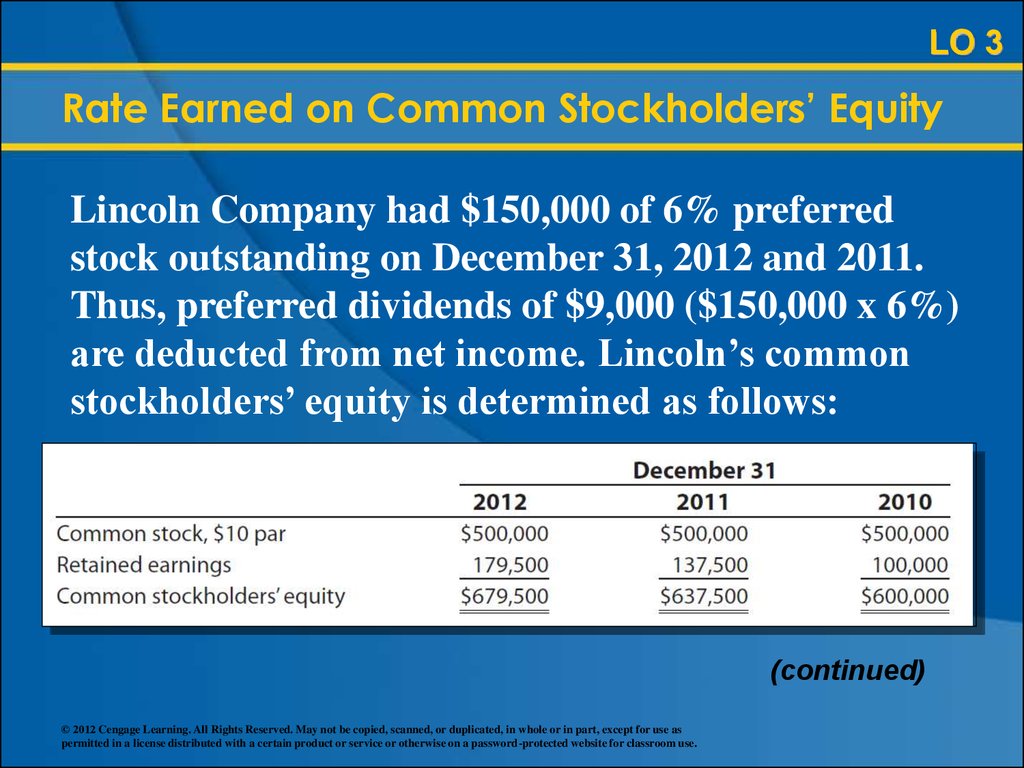
70. Rate Earned on Common Stockholders’ Equity
LO 3Rate Earned on Common Stockholders’ Equity
The rate earned on common stockholders’
equity measures the rate of profits earned
on the amount invested by the common
stockholders.
It is computed as follows:
Rate Earned on Common
=
Stockholders’ Equity
Net Income –
Preferred Dividends
Average Common
Stockholders’ Equity
© 2012 Cengage Learning. All Rights Reserved. May not be copied, scanned, or duplicated, in whole or in part, except for use as
permitted in a license distributed with a certain product or service or otherwise on a password-protected website for classroom use.
71.
LO 3Rate Earned on Common Stockholders’ Equity
Lincoln Company had $150,000 of 6% preferred
stock outstanding on December 31, 2012 and 2011.
Thus, preferred dividends of $9,000 ($150,000 x 6%)
are deducted from net income. Lincoln’s common
stockholders’ equity is determined as follows:
(continued)
© 2012 Cengage Learning. All Rights Reserved. May not be copied, scanned, or duplicated, in whole or in part, except for use as
permitted in a license distributed with a certain product or service or otherwise on a password-protected website for classroom use.
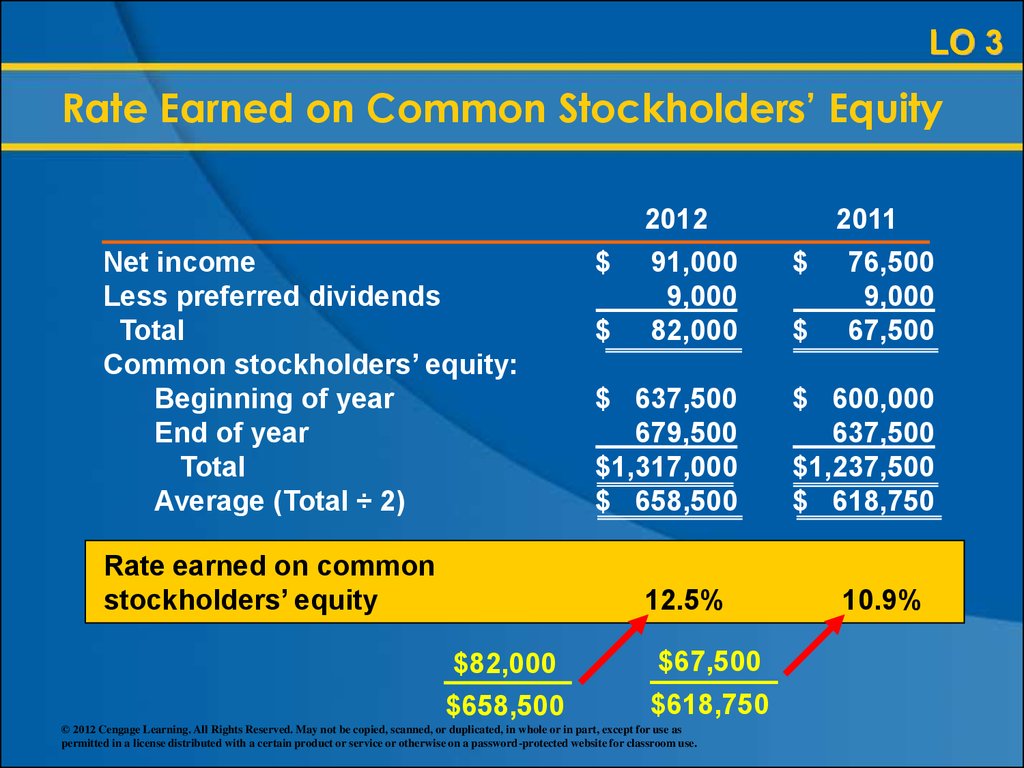
72.
LO 3Rate Earned on Common Stockholders’ Equity
Net income
Less preferred dividends
Total
Common stockholders’ equity:
Beginning of year
End of year
Total
Average (Total ÷ 2)
Rate earned on common
stockholders’ equity
2012
91,000
9,000
82,000
2011
$ 76,500
9,000
$ 67,500
$ 637,500
679,500
$1,317,000
$ 658,500
$ 600,000
637,500
$1,237,500
$ 618,750
$
$
12.5%
$82,000
$658,500
$67,500
$618,750
© 2012 Cengage Learning. All Rights Reserved. May not be copied, scanned, or duplicated, in whole or in part, except for use as
permitted in a license distributed with a certain product or service or otherwise on a password-protected website for classroom use.
10.9%
73.
EE 17-10© 2012 Cengage Learning. All Rights Reserved. May not be copied, scanned, or duplicated, in whole or in part, except for use as
permitted in a license distributed with a certain product or service or otherwise on a password-protected website for classroom use.
74. Earnings per Share on Common Stock
LO 3Earnings per Share on Common Stock
Earnings per share (EPS) on common stock
measures the share of profits that are earned
by a share of common stock. GAAP
requires the reporting of earnings per share
in the income statement.
It is computed as follows:
Net Income –
Preferred Dividends
Earnings per Share (EPS)
=
on Common Stock
Shares of Common Stock
Outstanding
© 2012 Cengage Learning. All Rights Reserved. May not be copied, scanned, or duplicated, in whole or in part, except for use as
permitted in a license distributed with a certain product or service or otherwise on a password-protected website for classroom use.
75. Earnings per Share on Common Stock
LO 3Earnings per Share on Common Stock
EPS for Lincoln Company is computed below.
Net income
Less preferred dividends
Total
Shares of common stock
Earnings per share on common stock
$82,000
50,000
2012
$91,000
9,000
$82,000
50,000
2011
$76,500
9,000
$67,500
50,000
$1.64
$1.35
$67,500
50,000
© 2012 Cengage Learning. All Rights Reserved. May not be copied, scanned, or duplicated, in whole or in part, except for use as
permitted in a license distributed with a certain product or service or otherwise on a password-protected website for classroom use.
76. Price-Earnings Ratio
LO 3Price-Earnings Ratio
Another profitability measure quoted by the
financial press is the price-earnings (P/E)
ratio on common stock. The price-earnings
ratio on common stock measures a
company’s future earnings prospects.
The price-earnings ratio is computed as
follows:
Market Price per Share of
Common Stock
Price-earnings (P/E) ratio =
Earnings per Share on
Common Stock
© 2012 Cengage Learning. All Rights Reserved. May not be copied, scanned, or duplicated, in whole or in part, except for use as
permitted in a license distributed with a certain product or service or otherwise on a password-protected website for classroom use.
77. Price-Earnings Ratio
LO 3Price-Earnings Ratio
The P/E ratio for Lincoln Company is computed
below.
Market price per share of
common stock
Earnings per share on common
stock
2012
2010
$41.00
$27.00
÷ $1.64 ÷ $1.35
Price-earnings ratio on
common stock
© 2012 Cengage Learning. All Rights Reserved. May not be copied, scanned, or duplicated, in whole or in part, except for use as
permitted in a license distributed with a certain product or service or otherwise on a password-protected website for classroom use.
25
20
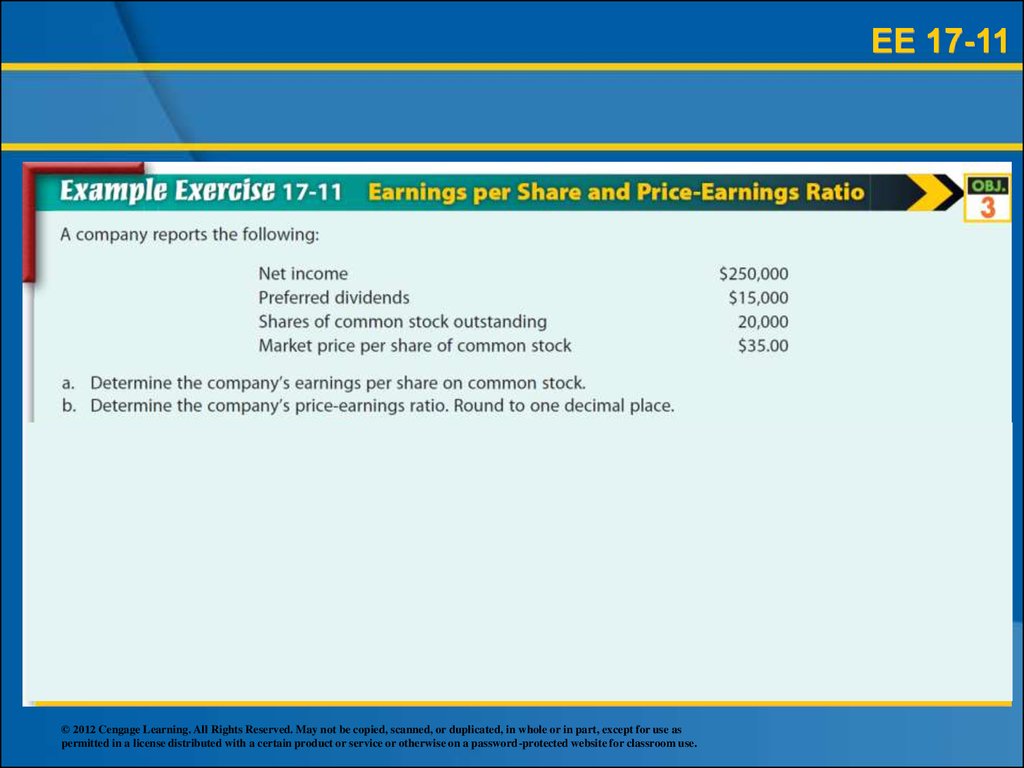
78.
EE 17-11© 2012 Cengage Learning. All Rights Reserved. May not be copied, scanned, or duplicated, in whole or in part, except for use as
permitted in a license distributed with a certain product or service or otherwise on a password-protected website for classroom use.
79. Dividends per Share
LO 3Dividends per Share
Dividends per share can be reported with
earnings per share to indicate the
relationship between dividends and
earnings.
Comparing these two per-share amounts
measures the extent to which earnings are
being distributed to common shareholders.
The ratio for dividends per share is at the top
of the next slide.
(continued)
© 2012 Cengage Learning. All Rights Reserved. May not be copied, scanned, or duplicated, in whole or in part, except for use as
permitted in a license distributed with a certain product or service or otherwise on a password-protected website for classroom use.
80. Dividends per Share
LO 3Dividends per Share
Dividends per Share =
Dividends
Shares of Common Stock
Outstanding
The dividends per share for Lincoln Company are
computed below.
Dividends on common stock
Shares of common stock outstanding
2012
$40,000
÷ 50,000
2011
$30,000
÷ 50,000
Dividends per share of common stock
$0.80
$0.60
© 2012 Cengage Learning. All Rights Reserved. May not be copied, scanned, or duplicated, in whole or in part, except for use as
permitted in a license distributed with a certain product or service or otherwise on a password-protected website for classroom use.
81. Dividends and Earnings per Share
LO 3Dividends and Earnings per Share
© 2012 Cengage Learning. All Rights Reserved. May not be copied, scanned, or duplicated, in whole or in part, except for use as
permitted in a license distributed with a certain product or service or otherwise on a password-protected website for classroom use.
82. Dividend Yield
LO 3Dividend Yield
The dividend yield on common stock
measures the rate of return to common
stockholders from cash dividends.
It is of special interest to investors whose
objective is to earn dividends from their
investment. It is computed as follows:
Dividends per Share of
Common Stock
Dividend Yield =
Market Price per Share of
Common Stock
© 2012 Cengage Learning. All Rights Reserved. May not be copied, scanned, or duplicated, in whole or in part, except for use as
permitted in a license distributed with a certain product or service or otherwise on a password-protected website for classroom use.
83. Dividend Yield
LO 3Dividend Yield
The dividend yield for Lincoln Company is
computed below.
2012
Dividends per share of
common stock
Market price per share of
common stock
Dividend yield on common stock
$0.80
$41
2011
$ 0.80
$ 0.60
$41.00
$27.00
2.0%
2.2%
$0.60
$27
© 2012 Cengage Learning. All Rights Reserved. May not be copied, scanned, or duplicated, in whole or in part, except for use as
permitted in a license distributed with a certain product or service or otherwise on a password-protected website for classroom use.
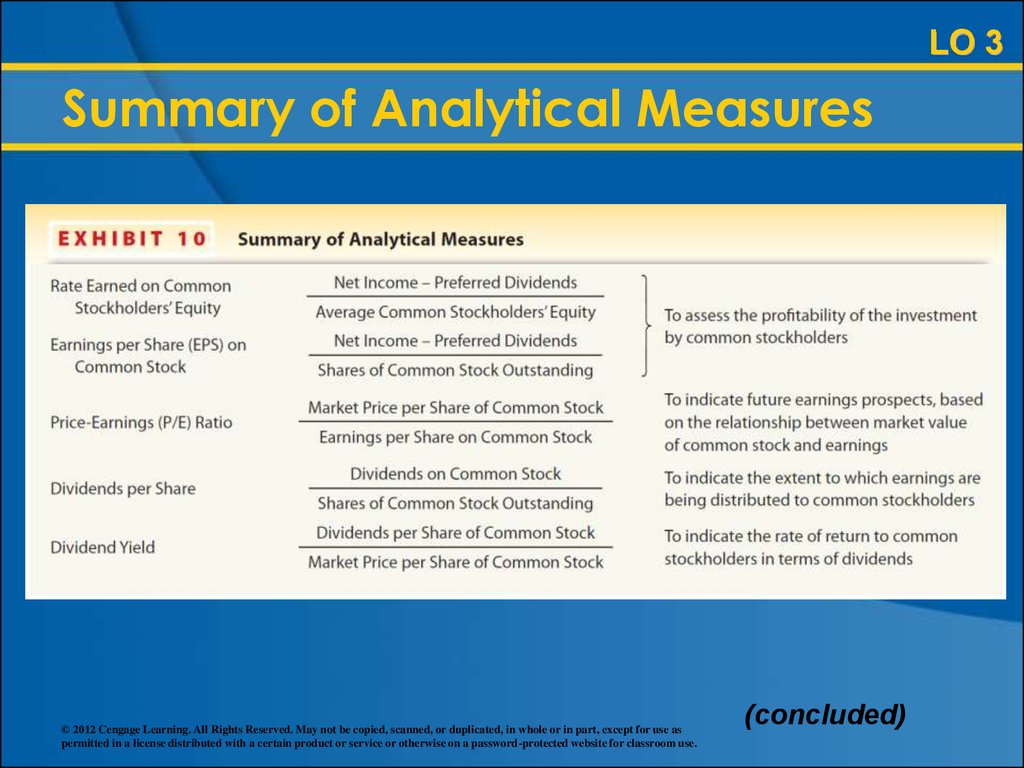
84. Summary of Analytical Measures
LO 3Summary of Analytical Measures
© 2012 Cengage Learning. All Rights Reserved. May not be copied, scanned, or duplicated, in whole or in part, except for use as
permitted in a license distributed with a certain product or service or otherwise on a password-protected website for classroom use.
(continued)
85.
LO 3Summary of Analytical Measures
© 2012 Cengage Learning. All Rights Reserved. May not be copied, scanned, or duplicated, in whole or in part, except for use as
permitted in a license distributed with a certain product or service or otherwise on a password-protected website for classroom use.
(continued)
86.
LO 3Summary of Analytical Measures
© 2012 Cengage Learning. All Rights Reserved. May not be copied, scanned, or duplicated, in whole or in part, except for use as
permitted in a license distributed with a certain product or service or otherwise on a password-protected website for classroom use.
(concluded)
87. Learning Objective 4
1. Describe basic financial statementanalytical methods.
2. Use financial statement analysis to assess
the solvency of a business.
3. Use financial statement analysis to assess
the profitability of a business.
4. Describe the contents of corporate annual
reports.
© 2012 Cengage Learning. All Rights Reserved. May not be copied, scanned, or duplicated, in whole or in part, except for use as
permitted in a license distributed with a certain product or service or otherwise on a password-protected website for classroom use.
88. Corporate Annual Reports
LO 4Corporate Annual Reports
In addition to the financial statements and
the accompanying notes, corporate annual
reports usually include the following
sections:
Management discussion and analysis
Report on internal control
Report on fairness of the financial
statements
© 2012 Cengage Learning. All Rights Reserved. May not be copied, scanned, or duplicated, in whole or in part, except for use as
permitted in a license distributed with a certain product or service or otherwise on a password-protected website for classroom use.
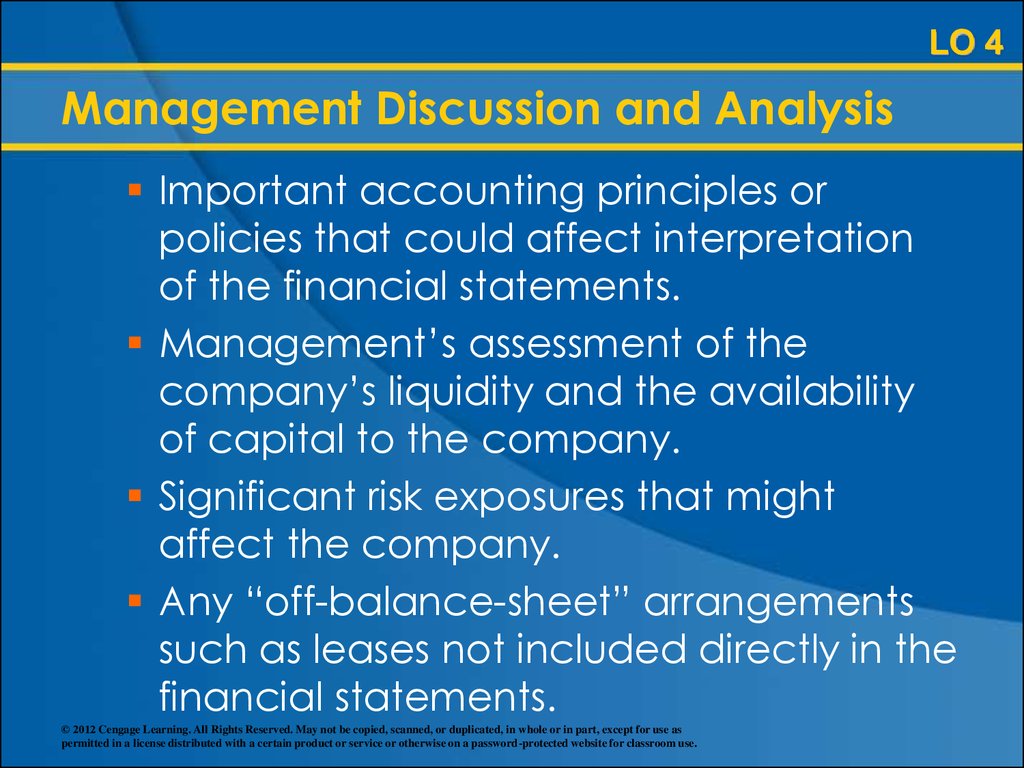
89. Management Discussion and Analysis
LO 4Management Discussion and Analysis
Management’s Discussion and Analysis
(MD&A) is required in annual reports filed with
the SEC.
It contains management’s analysis of current
operations and its plans for the future.
Typical items included in the MD&A are:
Management’s analysis and explanations
of any significant changes between the
current and prior year’s financial
statements.
© 2012 Cengage Learning. All Rights Reserved. May not be copied, scanned, or duplicated, in whole or in part, except for use as
permitted in a license distributed with a certain product or service or otherwise on a password-protected website for classroom use.
(continued)
90.
LO 4Management Discussion and Analysis
Important accounting principles or
policies that could affect interpretation
of the financial statements.
Management’s assessment of the
company’s liquidity and the availability
of capital to the company.
Significant risk exposures that might
affect the company.
Any “off-balance-sheet” arrangements
such as leases not included directly in the
financial statements.
© 2012 Cengage Learning. All Rights Reserved. May not be copied, scanned, or duplicated, in whole or in part, except for use as
permitted in a license distributed with a certain product or service or otherwise on a password-protected website for classroom use.
91. Report on Internal Control
LO 4Report on Internal Control
The Sarbanes-Oxley Act of 2002 requires a
report stating management’s responsibility
for establishing and maintaining internal
control. In addition, management’s
assessment of the effectiveness of internal
controls over financial reporting is included
in the report.
It also requires a public accounting firm to
verify management’s conclusions on internal
control.
© 2012 Cengage Learning. All Rights Reserved. May not be copied, scanned, or duplicated, in whole or in part, except for use as
permitted in a license distributed with a certain product or service or otherwise on a password-protected website for classroom use.
92. Report on Fairness of Financial Statements
LO 4Report on Fairness of Financial Statements
All publicly held corporations are required
by the Sarbanes-Oxley Act of 2002 to have
an independent audit (examination) of their
financial statements. The CPA firm that
conducts the audit renders an opinion on
the fairness of the statements.
© 2012 Cengage Learning. All Rights Reserved. May not be copied, scanned, or duplicated, in whole or in part, except for use as
permitted in a license distributed with a certain product or service or otherwise on a password-protected website for classroom use.
93. Appendix
Unusual Itemson the Income
Statement
Prepared by: C. Douglas Cloud
Professor Emeritus of Accounting
Pepperdine University
© 2012 Cengage Learning. All Rights Reserved. May not be copied, scanned, or duplicated, in whole or in part, except for use as
permitted in a license distributed with a certain product or service or otherwise on a password-protected website for classroom use.
94. Unusual Items on the Income Statement
AppendixUnusual Items on the Income Statement
Unusual items affecting the current period’s
income statement include the following:
Discontinued operations
Extraordinary items
© 2012 Cengage Learning. All Rights Reserved. May not be copied, scanned, or duplicated, in whole or in part, except for use as
permitted in a license distributed with a certain product or service or otherwise on a password-protected website for classroom use.
95. Discontinued Operations
AppendixDiscontinued Operations
A company may discontinue a segment of
its operations by selling or abandoning the
segment’s operations.
A note accompanying the income
statement should describe the operations
sold, including such details as the date
operations were discontinued, the assets
sold, and the effect (if any) on current and
future operations.
© 2012 Cengage Learning. All Rights Reserved. May not be copied, scanned, or duplicated, in whole or in part, except for use as
permitted in a license distributed with a certain product or service or otherwise on a password-protected website for classroom use.
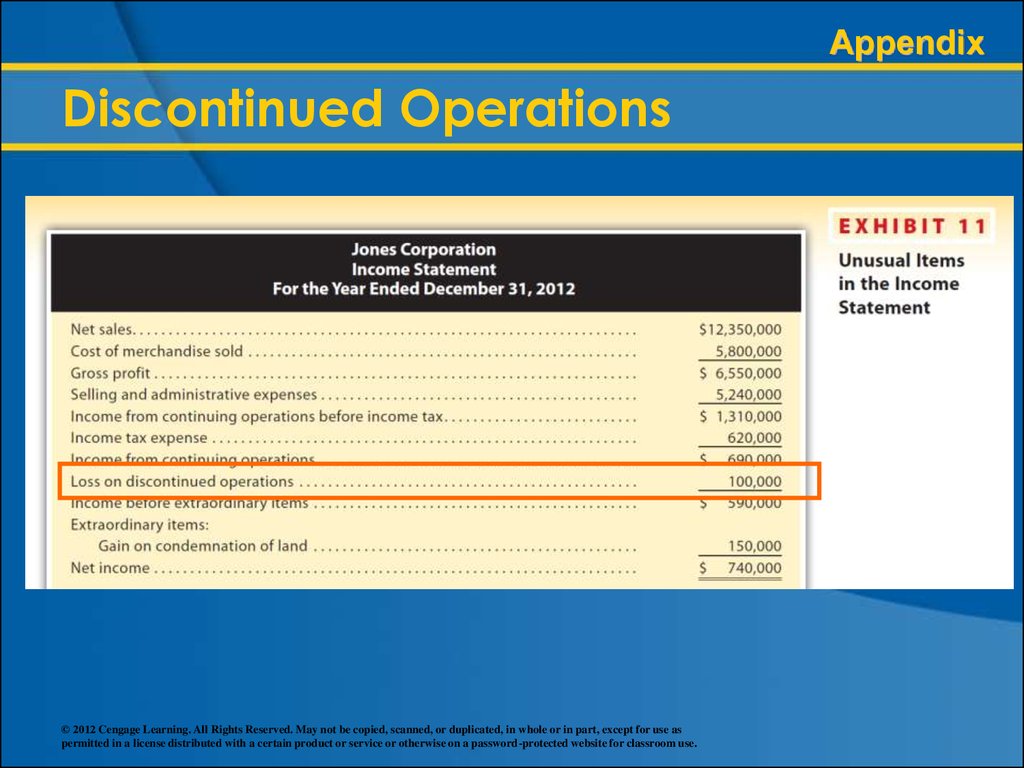
96. Discontinued Operations
AppendixDiscontinued Operations
Jones Corporation produces and sells electrical
products, hardware supplies, and lawn equipment.
Because of lack of profits, Jones discontinues its
electrical products operation and sells the remaining
inventory and other assets at a loss of $100,000.
Exhibit 11 (next slide) illustrates the reporting of the
loss on the discontinued operations.
© 2012 Cengage Learning. All Rights Reserved. May not be copied, scanned, or duplicated, in whole or in part, except for use as
permitted in a license distributed with a certain product or service or otherwise on a password-protected website for classroom use.
97.
AppendixDiscontinued Operations
© 2012 Cengage Learning. All Rights Reserved. May not be copied, scanned, or duplicated, in whole or in part, except for use as
permitted in a license distributed with a certain product or service or otherwise on a password-protected website for classroom use.
98. Extraordinary Items
AppendixExtraordinary Items
An extraordinary item is defined as an event
or transaction with both of the following
characteristics:
Unusual in nature
Infrequent in occurrence
© 2012 Cengage Learning. All Rights Reserved. May not be copied, scanned, or duplicated, in whole or in part, except for use as
permitted in a license distributed with a certain product or service or otherwise on a password-protected website for classroom use.
99. Extraordinary Items
AppendixExtraordinary Items
© 2012 Cengage Learning. All Rights Reserved. May not be copied, scanned, or duplicated, in whole or in part, except for use as
permitted in a license distributed with a certain product or service or otherwise on a password-protected website for classroom use.
100. Reporting Earnings per Share
AppendixReporting Earnings per Share
© 2012 Cengage Learning. All Rights Reserved. May not be copied, scanned, or duplicated, in whole or in part, except for use as
permitted in a license distributed with a certain product or service or otherwise on a password-protected website for classroom use.
101. Financial Statement Analysis
The EndPrepared by: C. Douglas Cloud
Professor Emeritus of Accounting
Pepperdine University
© 2012 Cengage Learning. All Rights Reserved. May not be copied, scanned, or duplicated, in whole or in part, except for use as
permitted in a license distributed with a certain product or service or otherwise on a password-protected website for classroom use.