
Similar presentations:


Econometrics_Presentation_with_graphs (2)
1.
Title & Introduction• Applied Econometrics Practice Exercise #2–3
• Time-Series & Panel Data Analysis
• Your Name
2.
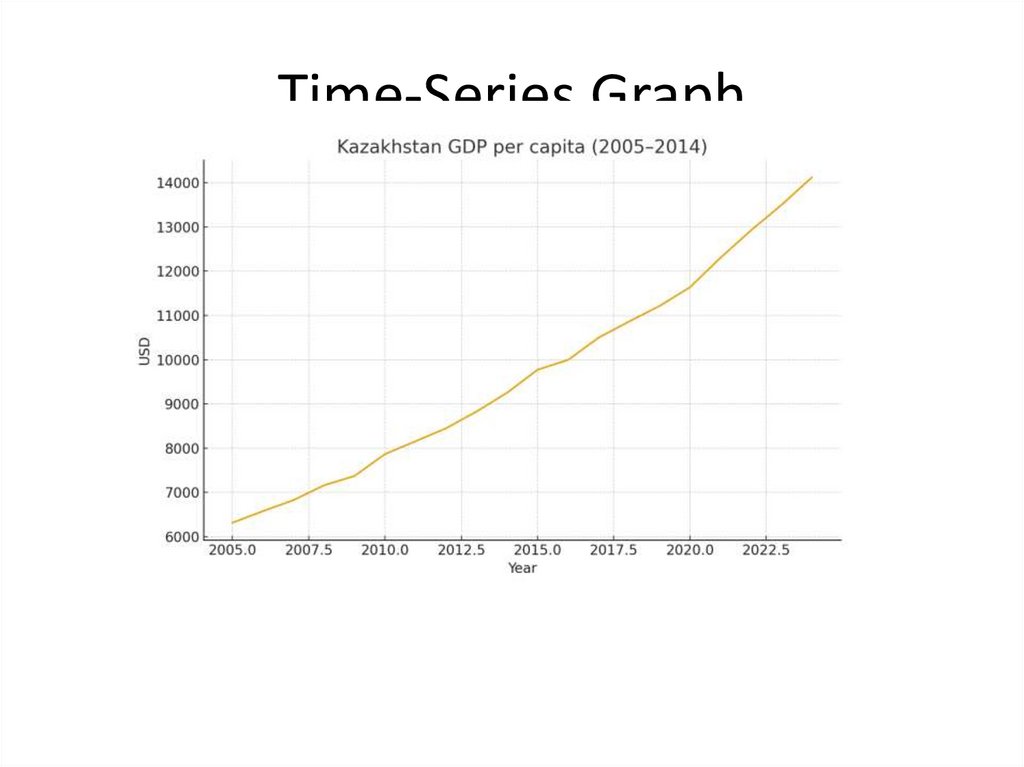
Data Description• • Kazakhstan: GDP per capita (2005–2014)
• • Panel: 5 countries, 4 variables
• • 10 years × 5 countries = 50 observations
• • Data source: Provided Excel dataset
3.
Time-Series Analysis (Kazakhstan)• • GDP per capita shows upward trend
• • ADF test: non-stationary
• • 1st difference: stationary
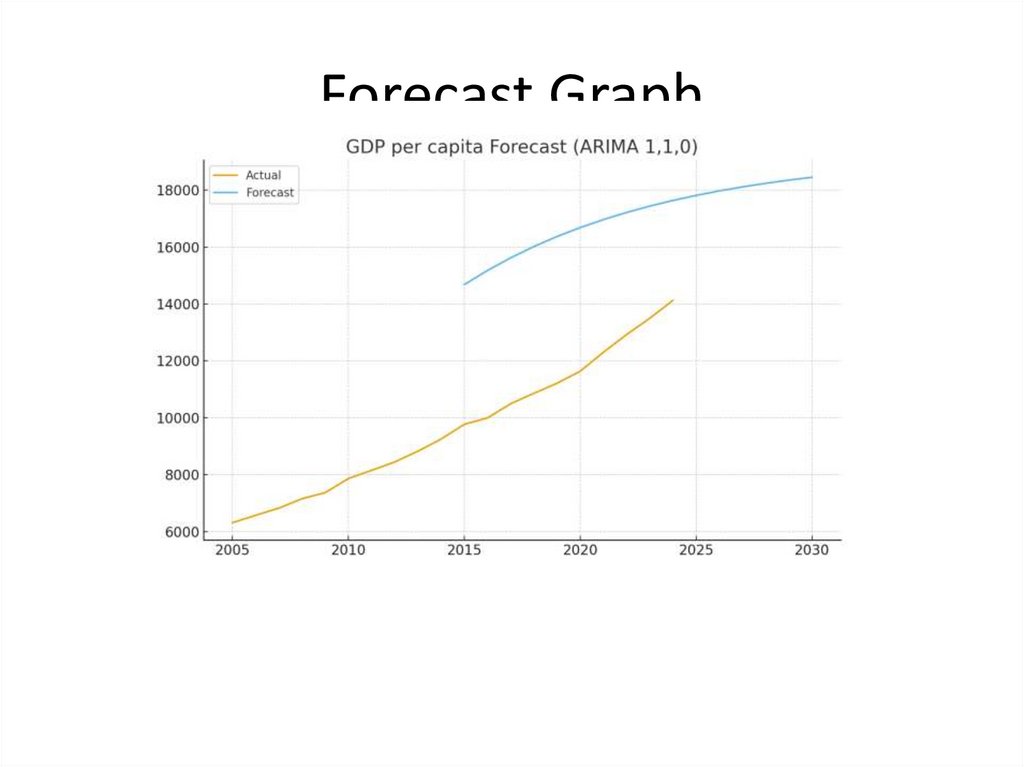
• • ARIMA(1,1,0) selected
• • Forecast 2025–2030: gradual growth
4.
Panel Regression Model• Model: GDP_it = β0 + β1INV + β2UNEMP +
β3URB + μ_i
• • FE results: Urbanization significant (+323)
• • Investment & Unemployment not significant
• • RE results similar
5.
Hausman Test• • FE vs RE comparison
• • Coefficients nearly identical
• • Hausman test: RE not rejected
• • Preferred model: Random Effects
6.
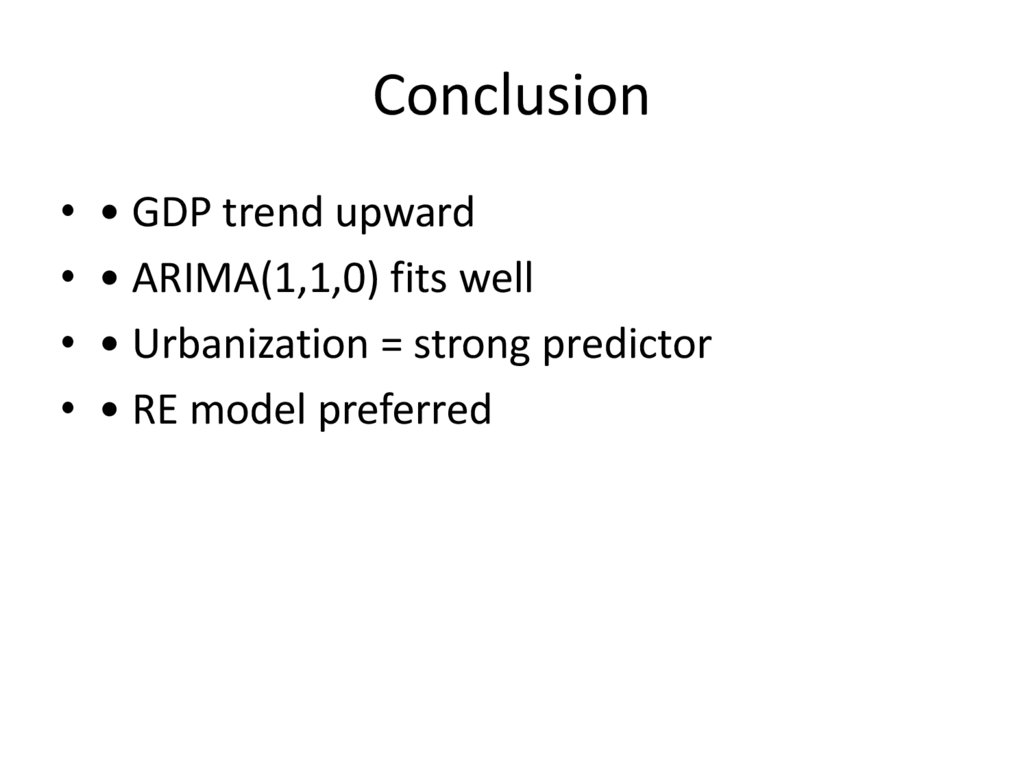
Conclusion• • GDP trend upward
• • ARIMA(1,1,0) fits well
• • Urbanization = strong predictor
• • RE model preferred