


 english
Similar presentations:


")


")
Journal Pre-proof
1.
Journal Pre-proofHow does China's big data policy affect the digital economy of cities? Evidence from
national big data comprehensive pilot zones
Xinyun Hu, Yanling Jiang, Pengfei Guo, Mingming Li
PII:
S2405-8440(24)00669-8
DOI:
https://doi.org/10.1016/j.heliyon.2024.e24638
Reference:
HLY 24638
To appear in:
HELIYON
Received Date: 19 September 2023
Revised Date:
28 December 2023
Accepted Date: 11 January 2024
Please cite this article as: , How does China's big data policy affect the digital economy of cities?
Evidence from national big data comprehensive pilot zones, HELIYON (2024), doi: https://
doi.org/10.1016/j.heliyon.2024.e24638.
This is a PDF file of an article that has undergone enhancements after acceptance, such as the addition
of a cover page and metadata, and formatting for readability, but it is not yet the definitive version of
record. This version will undergo additional copyediting, typesetting and review before it is published
in its final form, but we are providing this version to give early visibility of the article. Please note that,
during the production process, errors may be discovered which could affect the content, and all legal
disclaimers that apply to the journal pertain.
© 2024 Published by Elsevier Ltd.
2.
How does China’s big data policy affect the digital economy of cities?Evidence from National Big Data Comprehensive Pilot Zones
Xinyun Hua, Yanling Jianga, Pengfei Guob, *, Mingming Lic
a School of business administration, Chongqing University of Science & Technology, Chongqing, China
b Research Institute for the Construction of the Chengdu-Chongqing economic circle, School of Economics, Chongqing Technology
and Business University, Chongqing, China
c Institute for Sociology, University of Innsbruck, Innsbruck, Austria
* Corresponding author.
E-mail address: 13350382420@163.com (P. Guo).
Jo
ur
na
lP
re
-p
r
oo
f
Abstract: Based on the panel data of 280 cities in China from 2011 to 2019, this paper examines
the effects of big data policies on the digital economy development by using the national big data
comprehensive pilot zones as a quasi-natural experiment. The findings of this paper are as follows.
First, the big data policy significantly promotes China’s digital economy development. Second,
cities at a higher administrative level receive higher policy benefits than cities at a lower
administrative level. Third, technological innovation and human capital are important ways for the
big data policy to improve the development of the digital economy. The conclusions of this paper
not only help to assess the effectiveness of big data policies and ensure the efficacy of policy
implementation, but also provide policy support for local governments to fully explore the value of
data elements and grasp the new opportunities for the digital economy development with the help
of the pilot zones.
Keywords: Big data policy; Digital economy; Difference-indifference; Heterogeneity; Kernel
density; Mediating effect
1. Introduction
The development of the digital economy is the result of the integration of modern information
technology with human production and lifestyle. In recent years, developing digital economy
has become the commanding height for countries all over the world to struggle for the
international discourse right in the information age. Data is the production factor of the digital
economy, and Big Data mining and applications can create significant value for the world
economy. Therefore, in recent years, to promote the development of the digital economy,
governments around the world have introduced policies related to big data, such as the Big Data
Research and Development Initiative of the U.S. federal government, Australian
Public Service Information and Communications Technology Strategy 2012-2015, Seizing the
Data Opportunity: A Strategy for UK Data Capability and so on. China also kept pace with the
times and released the Action Outline for Promoting the Development of Big Data in August
2015. To implement the outline, China has successively carried out the construction of national
big data comprehensive pilot zones (hereinafter referred to as the pilot zones) since 2016, which
is a new big data pilot policy issued by the Chinese government to promote the development of
1
3.
Jour
na
lP
re
-p
r
oo
f
the digital economy. Its construction scope includes the Guizhou big data comprehensive pilot
zone, two cross-regional comprehensive pilot zones (Beijing, Tianjin, Hebei, and the Pearl
River Delta), four demonstration comprehensive pilot zones (Shanghai, Henan, Chongqing, and
Shenyang), and one comprehensive pilot zone for overall development of big data infrastructure
(Inner Mongolia). The pilot zones carried out systematic experiments around the seven main
tasks (i.e., open data resource management and sharing, data center integration, data resource
application, data element circulation, big data industrial agglomeration, big data international
cooperation, and big data system innovation), and eventually form radiation effect and
demonstration effects by constantly summarizing practical experience that can be used for
reference, replication, and promotion.
However, government policy assessment has long been controversial in academia and
practice. On the one hand, under the guidance of the government, all regions have good
subjective initiative in economic development. Scholars have confirmed the positive effect of
economic radiation, innovation-driven and sustainable development brought by the
implementation of government policies [1,2]. On the other hand, government policies have
been criticized for their subjectivity, resulting in improper allocation of resources and low
investment efficiency [3]. Because of the uncertainty caused by government policies, countries
will make targeted adjustments to relevant policies for the development of the digital economy
in time.
The construction of pilot zones is a new pilot policy focusing on data resource management
and application in China since 2016, and there is uncertainty about its policy effects. The level
of digital economy development is the core competitiveness of a country and determines the
sustainability of economic development. Currently, China’s digital transformation is still in its
infancy, with only 16% of enterprises achieving significant results in digital transformation.
Therefore, has the big data policy significantly improved China’s digital economy development?
If so, is there a significant difference in improvement between cities at different administrative
levels? Mainly through which channels does the big data policy affect China’s digital economy
development?
To better reveal the overall impact and explore the function mechanism of big data policy on
the development of the digital economy, we conduct a natural experiment study using the
difference-in-differences (DID) method for China’s first big data pilot policy, the National Big
Data Comprehensive Pilot Zone (referred to as the Pilot Zone). The methodology has been
widely used in the literature on policy effects assessment [4,5]. This paper utilizes panel data
of 280 Chinese cities from 2011-2019 to first calculate the digital economy development index
of cities by constructing an index system, and then estimate the impact of the big data policy
on the digital economy based on the DID model. Chinese cities are categorized according to
administrative levels to explore the heterogeneity of big data policy effects. From the
perspectives of technological innovation and human capital, the channels of the big data policy
to promote the digital economy development are examined.
The contributions in this paper include the following four points: First, this paper uses the
data of 280 cities from 2011 to 2019 to construct a more scientific evaluation index system of
digital economy development, and calculates the digital economy development index of cities
over the years, which not only expands the sample size but also makes the conclusion more
robust. Second, we use the natural experiment of the national big data comprehensive pilot
2
4.
urna
2.1. Literature review
lP
2. Literature review and hypothesis
re
-p
r
oo
f
zones to examine the effects of the big data policy on the development of the digital economy.
Compared to other strategies or plans, the construction of pilot zones is a more targeted big data
pilot policy that enriches research results on policies for the development of the digital economy.
Given the specific construction objectives, using the DID method to examine the policy effects
is both fitting and important. Third, this paper analyzes the regional heterogeneity in policy
effects by grouping cities according to different administrative levels, which provides valid
evidence for the rational layout of the pilot zones. Fourth, from the perspective of technological
innovation and human capital, we analyze the transmission channels of big data policies
promoting the digital economy development, deepening the understanding of the development
issues of China’s digital economy. Our findings are not only of significant policy value for
understanding the policy effects and improving the policy design of big data pilot zones, but
also inspirational for governments to formulate better big data policies to support the digital
economy development.
The structure of this paper is as follows: The second part shows the literature review and
hypothesis. The third part introduces the model, variable, and data. The fourth part provides the
results and discussions. The fifth part presents the conclusion and policy recommendations. The
sixth part is research limitations and future research.
Jo
The digital economy originates from networked intelligence, which can be related back to
the 1990s [6]. It includes information and knowledge in a digital format, as the main production
factor, computing and networking as an important communication and workspace, and
Information and Communication Technologies (ICTs) as a productivity growth facilitator. The
digital economy plays an important role in the national economy. It can promote the growth of
total factor productivity in ICT industries [7], and the improvement of labor productivity
through ICT capital deepening [8]. Therefore, most scholars have begun to measure the digital
economy. First, after Machlup and Porat initiated the research method of measuring the value
added to the knowledge economy and information economy [9,10], some scholars have
calculated the real value added for the digital economy and its contribution to GDP in some
countries [11]. Second, some studies have attempted to construct a new digital economy
satellite account (DESA) for a comprehensive measure of the contribution of the digital
economy to GDP [12,13]. Third, some scholars often compile the digital economy development
index by constructing the index system, such as the ICT Development Index [14], Digital
Economy and Society Index [15], Digital Knowledge Economy Index [16], Digital Economy
Index [17] and so on. It shows that there has not been a unified standard for the evaluation of
the development of the digital economy. Therefore, based on the combination of the existing
research results of the same kind, this paper builds a digital economy development evaluation
index system and then calculates the digital economy development index of Chinese cities,
which provides data support for the correct judgment of the current situation of China’s digital
3
5.
Jour
na
lP
re
-p
r
oo
f
economy development and plays a guiding role in the subsequent similar quantitative research.
Data is the production factor of the digital economy [18]. Big data is bringing a revolution
in science and technology. Big Data is the information assets that demand cost-effective,
innovative forms of information processing that enable enhanced insight, decision-making, and
process automation, characterized by 5Vs (i.e., volume, variety, velocity, veracity, and value)
[19,20]. The impact of big data on the digital economy is mainly reflected in the following
aspects. First, big data can unlock an organization’s business value by unleashing new
organizational capabilities and value. A 2011 McKinsey report shows that retailers can achieve
up to 60% increase in operating margins by putting big data into analytics [21]. Collecting,
storing, and mining big data for insights can create significant value for the world economy,
enhancing the productivity and competitiveness of companies and the public sector and creating
a substantial economic surplus for consumers. Second, the ICT has greatly increased the amount
of information people daily contact with, improving people’s information processing capability
and reducing the cost of releasing personal information and contacting others. People inject
very rich relationship data such as contact, association, and group attachment into social
networks. This makes digitization gradually permeate people’s daily lives and provides the soil
for the development of the digital economy. Third, big data shortens the space-time distance
through efficient information transmission and enhances the breadth and depth of interregional
economic activity linkages. Yilmaz et al. paid early attention to the spatial spillover effect
brought by informatization by empirically testing the panel data of 48 states in the United States
[22].
After realizing the importance of big data, many countries have successively introduced big
data policies, which mainly refer to the strategies, plans, policies and pilot projects formulated
by the government to ensure the promotion and application of big data, including national big
data strategy or plan, data opening policy, data sharing policy, data security and privacy
protection policy and so on [23,24,25]. Econometrics is widely used to analyze the impact of
policies, because of the preciseness and intuitive nature of empirical analysis. However, few
scholars have applied it to the study of big data policy. In China, the quantitative research on
big data pilot projects mainly focuses on China’s smart city pilot policy. It is a policy aimed at
improving urban service quality with big data technology as the core. Most studies believe that
smart cities incorporate information and communication technology into urban management,
making cities more innovative, competitive, attractive, and flexible [26]. They pointed out the
impact of smart cities on innovation, economy, society, and other aspects [27]. These works
help assess the significance of big data policy, but few scholars have quantitatively analyzed
the effect of the national big data comprehensive pilot zone, which is something we have
included in the present study.
2.2. Hypothesis
In the mature period of the digital economy, data is the key factor of production. The pilot
zones mainly carry out systematic experiments around data elements, and their mechanisms to
drive the development of the digital economy are as follows. First, as a major measure to
promote the development of big data, the establishment of the pilot zones is strongly supported
by the government. Specifically, the government took the lead in carrying out big data
4
6.
Jour
na
lP
re
-p
r
oo
f
legislation to provide legal protection for data financing and innovative applications. In addition,
the government provided financial guarantees for the construction of digital economy
infrastructure in the pilot zones. For example, the data show that after the establishment of the
pilot zones, Guizhou has achieved full Internet coverage, and the development level of
information infrastructure has risen from the 29th to the 15th in China. In 2020, 16330 5G base
stations were built, with a total provincial bandwidth of 16700 Gbps and a total of 1689400 km
of communication optical cables, 14 times and 3 times that in 2013 respectively. Second, data
resources have strong liquidity, which can not only play a synergistic effect with other
production factors such as capital, talent, and innovation but also have a multiplier effect on
other factors [28,29]. The primary task of the pilot zones is to realize data sharing, including
government data sharing, government data financing, and data-free flow between enterprises
and governments. Data sharing is not only conducive to strengthening the ability of information
acquisition, transmission, and value-added but also can effectively promote information flow,
thus producing a knowledge spillover effect [30]. Third, the establishment of the pilot zones
provides a space for the agglomeration of big data enterprises and related industries. On the one
hand, enterprises effectively use data resources to develop industry chains and to form industrial
clusters related to the digital economy. This is conducive to attracting big data innovation
investment at home and abroad and promoting the exchange and cooperation of digital
technology. On the other hand, it can improve the innovation ability, management ability, labor
productivity, and market competitiveness of big data enterprises by reducing transaction costs,
refining the division of labor, sharing infrastructures, and forming the scale effect [31]. For
example, Intel, Microsoft, Apple, Qualcomm, and other world-famous enterprises have taken
root in Guizhou. In 2020, the revenue of the software and information service industry in
Guizhou increased by 26.3% and the business revenue of the telecom industry increased by
5.6%. The growth rate of the digital economy reached 22.1%, ranking first in China for five
consecutive years. Thus, we propose the following hypothesis:
Hypothesis 1: the big data policy can promote the development of the digital economy.
For China’s high-tech industries, differences in factor endowment across regions will result
in significant differences in R&D investment efficiency. Different initial factor endowments
could lead to different effects of the same economic policy. Similarly, in terms of the
development of China’s big data industry, the different resource endowments, initial levels of
economic development, and economic policies possessed by each region have led to large
regional differences in digital development [32]. Some studies have shown that regions with
poorer initial conditions also suffer from path dependence in the long run, resulting in lower
policy effects than other regions [33]. In other words, developed regions can reap higher policy
benefits by their initial advantages compared to lagging regions. In China’s political and
economic system, differences in factor endowments across cities are often correlated with
administrative hierarchy. According to the administrative level of Chinese cities, cities can be
broadly divided into municipalities directly under the central government, sub-provincial cities,
provincial capitals, larger cities, and general prefecture-level cities. Generally speaking, cities
with a higher administrative level are more advanced in terms of factor endowments and
development conditions, the same policy preferences generate a greater boost to economic
development. Thus, we propose the following hypothesis:
Hypothesis 2: Due to the long-term effect of path dependence, cities at a higher administrative
5
7.
Jour
na
lP
re
-p
r
oo
f
level will receive higher policy benefits than cities at a lower administrative level.
The big data policy will reinforce its positive impact on the development of the digital
economy through the technological innovation effect and the human capital effect. First, the
flow of data and the application of information technology in the pilot zones accelerates
technological innovation, which reinforces the positive impact of the big data policy. It is
mainly reflected in the following aspects: (1) the widespread application of big data technology
has broken the information gap in the market, making the market more transparent. The free
flow of information forces the R&D department of enterprises to continuously develop new
technologies, adapting to the complete competition in the market [34]. At the same time, the
dissemination of information among enterprises can promote the spillover of technological
innovation, which not only helps to improve the ability to obtain information and innovation
performance of enterprises [35] but also accelerates the penetration of new technologies into
traditional industries, realizing the technological innovation of traditional industries [36]. (2)
To fully release data dividends and obtain potential profits, stakeholders often try new business
models and allow low-cost innovation to realize potential business development [37]. For
example, digital service trade boosts technological innovation [38]. (3) The information
technology has a strong “link” integration capability. Under the multiplier effect of network
links, it can realize the reorganization of cross-regional innovation elements and form a
“positive feedback loop” innovation model that coordinates the development of manufacturing
business and R&D ecosystems, thereby improving the level of cross-regional collaborative
innovation [39].
Second, the pilot zones promote the development of the digital economy by improving the
level of human capital. The key to yielding positive policy effects is the use of human capital,
and high-quality human capital is in the form of increased knowledge, mastery of technology,
innovation, and the ability to develop technology to encourage technology development [40,41].
On the one hand, the pilot zones can boost human capital quantitatively. It provides diversified
opportunities to develop the great potential of human capital, which can greatly attract and
retain talents. On the other hand, the pilot zones can improve the quality of human capital. The
rigid demand for high-quality human capital makes the pilot zone become a gathering center
for higher education talents, and it has been found that only highly skilled workers with a
tertiary degree can effectively meet the demand for human capital brought about by ICT usage
and digitalization [42]. The human capital effect brought by the establishment of the pilot zones
at both quantitative and qualitative levels is conducive to accelerating the spatial diffusion and
spillover of knowledge, information, innovation, and technology related to the digital economy,
which further drives the development of the digital economy of cities. Thus, we propose the
following hypothesis:
Hypothesis 3: The big data policy will strengthen its positive impact on the development of the
digital economy through the technological innovation effect and the human capital effect.
6
8.
3. Model, variable, and data3.1. Difference in differences (DID) model
re
-p
r
oo
f
To quantitatively analyze the effect of the pilot zones and the development of the digital economy,
this paper sets up a DID model. By comparing the different effects of an exogenous shock on the
treatment group and the control group, the DID model is well-known for its effectiveness in
identifying causal relationships and thus is widely used in causal inference and policy effect studies.
Meanwhile, it helps avoid endogeneity problems in policy effect assessments and addresses the
unobserved nature of virtual facts [43]. Because policies are generally exogenous relative to
economic subjects, there is no reverse causality problem.
We define a time dummy variable to indicate whether the time is before (2011–2015) or after
(2016–2019) the implementation of the pilot zones. We set Tt= 1 if t≥2016, and Tt= 0, otherwise.
We divide our sample into two groups according to whether the city has established the pilot zones.
If the city has established the pilot zones, it is classified into the treatment group, otherwise, the
control group. Accordingly, we define a grouping dummy variable: PZi= 1 if city i belongs to the
treatment group, and PZi= 0, otherwise. The equation is as follows:
(1)
DEDIit = 0 + 1Tt PZi + Zit + i + t + it
ur
na
lP
where DEDIit is the dependent variable for the digital economy development index of city i in year
t. Tt×PZi is the interaction of the time dummy and the grouping dummy, and the corresponding
coefficient 1 is a DID estimator for the treatment effect, indicating the net impact of big data
policy on the development of the digital economy. Zit are other control variables and is the
Jo
corresponding coefficients. To account for the potential unobserved heterogeneity, we also
incorporate the city-fixed effect μi and the year-fixed effect ηt in the model. εit is the stochastic error
term.
3.2. Variable description
This paper focuses on the effect of big data policy in the development of the digital economy and
analyzes the regional differences in the effect. In addition, considering that other factors also affect
the development of the digital economy, this paper introduces other control variables. Table 1
illustrates the summary of variable statistics.
3.2.1. dependent variable
According to the above definition, the DEDI is a complex system for quantitatively evaluating
the overall development of the digital economy. Based on the analytic hierarchy process (AHP①)
and the indicator selection principle②, the indicator system was generated using elements of digital
The analytical hierarchical process (AHP) is structured hierarchically at different levels, with each level consisting of a finite number of
decision elements. The top level of the hierarchy represents the overall goal, whereas the lowest level is composed of all possible alternatives.
This method combines the qualitative and quantitative analyses and can provide a multi-dimensional and multi-criterion analysis.
②
The indicator selection principle involves feasibility, scientificity, gradation and completeness.
①
7
9.
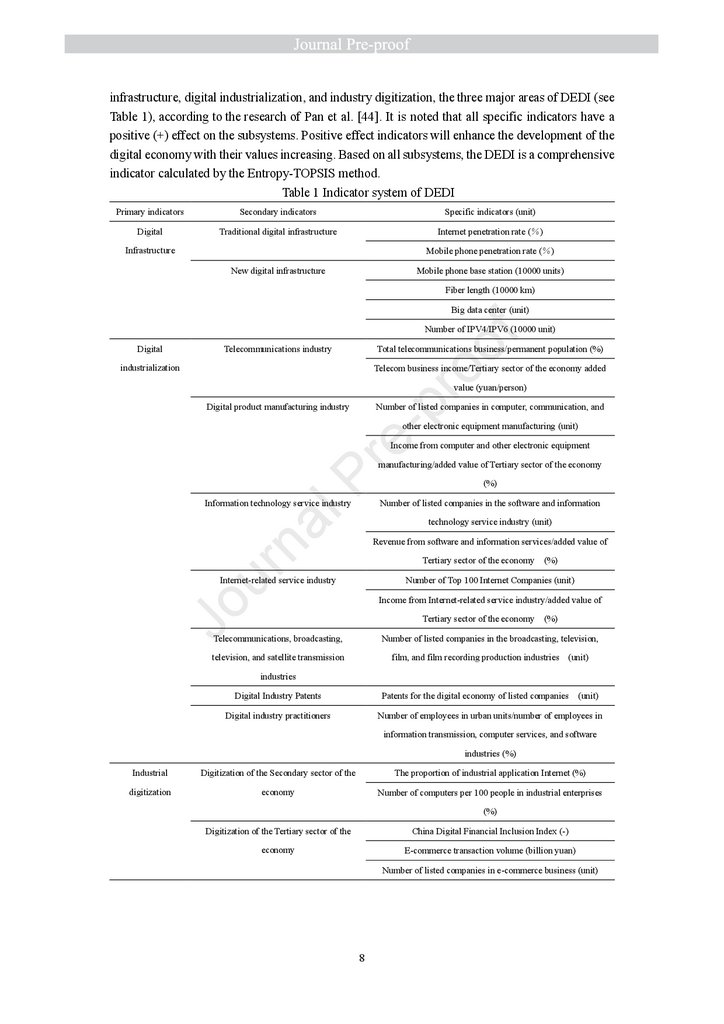
infrastructure, digital industrialization, and industry digitization, the three major areas of DEDI (seeTable 1), according to the research of Pan et al. [44]. It is noted that all specific indicators have a
positive (+) effect on the subsystems. Positive effect indicators will enhance the development of the
digital economy with their values increasing. Based on all subsystems, the DEDI is a comprehensive
indicator calculated by the Entropy-TOPSIS method.
Table 1 Indicator system of DEDI
Primary indicators
Secondary indicators
Specific indicators (unit)
Digital
Traditional digital infrastructure
Internet penetration rate ( )
Infrastructure
Mobile phone penetration rate ( )
New digital infrastructure
Mobile phone base station (10000 units)
Fiber length (10000 km)
Big data center (unit)
Digital
oo
f
Number of IPV4/IPV6 (10000 unit)
Telecommunications industry
Total telecommunications business/permanent population (%)
industrialization
Telecom business income/Tertiary sector of the economy added
re
-p
r
value (yuan/person)
Digital product manufacturing industry
Number of listed companies in computer, communication, and
other electronic equipment manufacturing (unit)
Income from computer and other electronic equipment
lP
manufacturing/added value of Tertiary sector of the economy
ur
na
Information technology service industry
(%)
Number of listed companies in the software and information
technology service industry (unit)
Revenue from software and information services/added value of
Tertiary sector of the economy
Internet-related service industry
(%)
Number of Top 100 Internet Companies (unit)
Jo
Income from Internet-related service industry/added value of
Tertiary sector of the economy
(%)
Telecommunications, broadcasting,
Number of listed companies in the broadcasting, television,
television, and satellite transmission
film, and film recording production industries (unit)
industries
Digital Industry Patents
Patents for the digital economy of listed companies
Digital industry practitioners
(unit)
Number of employees in urban units/number of employees in
information transmission, computer services, and software
industries (%)
Industrial
Digitization of the Secondary sector of the
The proportion of industrial application Internet (%)
digitization
economy
Number of computers per 100 people in industrial enterprises
(%)
Digitization of the Tertiary sector of the
China Digital Financial Inclusion Index (-)
economy
E-commerce transaction volume (billion yuan)
Number of listed companies in e-commerce business (unit)
8
10.
The first step for the evaluation of DEDI is to conduct dimensionless standardization to removethe original data contamination issues. For the group of positive indicators, data is transformed by
Eq. (2):
xij =
X j − min X j
max X j − min X j
(2)
pij =
xij
x
ij
re
-p
r
i
oo
f
Note that xij is the normalized value of indicator j for city i; min{Xj} and max{Xj} refer to the
minimum and maximum value, respectively, of indicator j among all the cities.
The second step is to use Shannon’s Entropy method for the relative weights of each indicator
(occurrence probability, severity, and vulnerability). Based on the theory of information entropy, the
index weight is determined according to the data provided by the amount of information and has a
relatively objective and precise evaluation value. Next, we use Eq. (3) to Eq. (6) to determine the
weight.
(3)
In this relation, pij is the proportion of indicator j on city i. Then, through the following
relation, the entropy value is calculated.
1
( pij ln pij )
ln m i
(4)
lP
ej = −
Jo
ur
na
where ej is the entropy value of indicator j, and m is the total number of cities. Then the value
of non-reliance or deviation dj of indicator j is calculated. If the entropy value ej is bigger, the
deviation is smaller, and this index is less important. Finally, the weight wj of indicator j is
obtained in Eq. (6).
d j = 1− ej
(5)
dj
(6)
wj =
dj
j
The third step is to calculate the weighted normalized decision matrix R in Eq. (7), where
qij=wj×xij.
R= qij n×m
(7)
In the fourth step, positive ideal solution ( Q+j ) and negative ideal solution ( Q−j ) are obtained in
Eq. (8) to Eq. (9).
Q j = ( max qi 1 , max qi 2 ,
, max qim )
(8)
Q j = ( min qi 1 , min qi 2 ,
, min qim )
(9)
+
−
The fifth step is to calculate the separation measures, using the n-dimensional Euclidean distance.
The separation of each observed object from the positive ideal solution is given in Eq. (10):
9
11.
m+
Di =
(
+
Q j − qij
j =1
)
2
(10)
Similarly, the separation from the negative ideal solution is given in Eq. (11):
Di− = ( Q −j − qij )
m
2
(11)
j =1
DEDI i =
Di−
Di+ + Di−
oo
f
In these relations, qij is each of the entries of the weighted normalized decision matrix, is the
positive ideal related to each column, and is the negative ideal related to each column.
In the last step, the relative closeness of each observed object to the positive ideal is calculated in
Eq. (12).
(12)
lP
3.2.2. core independent variable
re
-p
r
where DEDI is between 0 and 1. If the value of DEDI is larger, the digital economy development
index of the city i is bigger.
Tt×PZi is the DID estimator indicated by the interaction between Tt and PZi. Its correlation
coefficient of 1 is expected to be positive, representing the rise of the development level of the
ur
na
digital economy since the big data policy was introduced.
3.2.3. control variables
Jo
We focus on the following control variables that may affect the development of the digital
economy. (1) The government scale (GS), which is measured by the proportion of government
budget expenditure in regional GDP. The government plays a very important role in China’s
economic development. This variable can reflect the government’s investments and consumption,
or the expenditures on digital infrastructures and other input level areas [45]. (2) The foreign direct
investment (FDI), which is the actual amount of foreign direct investment in the cities. FDI provides
more financial funds for the development of the digital economy. In addition to the Chinese
government's investment, the digital economy also relies on foreign investment in capital and
technology. FDI plays an important role in digital infrastructure, digital business development and
wider digital adoption [46]. (3) The urbanization rate (UR), which is represented by the proportion
of the urban non-agricultural population in the total population. The impact of urbanization on
China’s society, economy, and environment cannot be ignored, and China’s digital economy
development is inevitably accompanied by the rapid advancement of urbanization [47]. (4) The
industrial structure upgrading (ISU), which is measured by the proportion of the secondary industry
and the tertiary industry value-added in GDP. The upgrading of industrial structure implies a shift
from lower to higher levels of industrial structure, which brings about technological and institutional
innovations, thus affecting the development of the digital economy. (5) The level of economic
development (PCGDP), which is measured by real per capita GDP. A higher level of economic
10
12.
development corresponds to better technology and leading-edge facilities, thereby creating afavorable environment for the development of the digital economy.
3.3. Sample and data source
4. Test Results
ur
na
4.1. Test results for Hypothesis 1
lP
re
-p
r
oo
f
The data sample used in this paper is the panel data of 280 cities① in China from 2011 to 2019.
Among them, 66 cities② in the Pilot Zone constitute the treatment group, and the other 214 cities
constitute the control group.
The data mainly comes from the China Statistical Yearbook, China City Statistical Yearbook, EPS
database, Local Statistical Yearbook, National Economic and Social Development Bulletin, Listed
Company Database/Digital Economy Research Database on the China Research Data Service
Platform, the website of the Bureau of Industry and Information Technology, Digital China Index
report, China City Digital Economy Development Report, and China Digital Economy
Development White Paper. China Digital Financial Inclusion Index adopts the Peking University
Digital Financial Inclusion Index of China (PE-UDFIIC) which was produced by a research team
from the Institute of Digital Finance at Peking University and Ant Financial Services Group. Some
of the missing data are filled by moving smoothing.
Jo
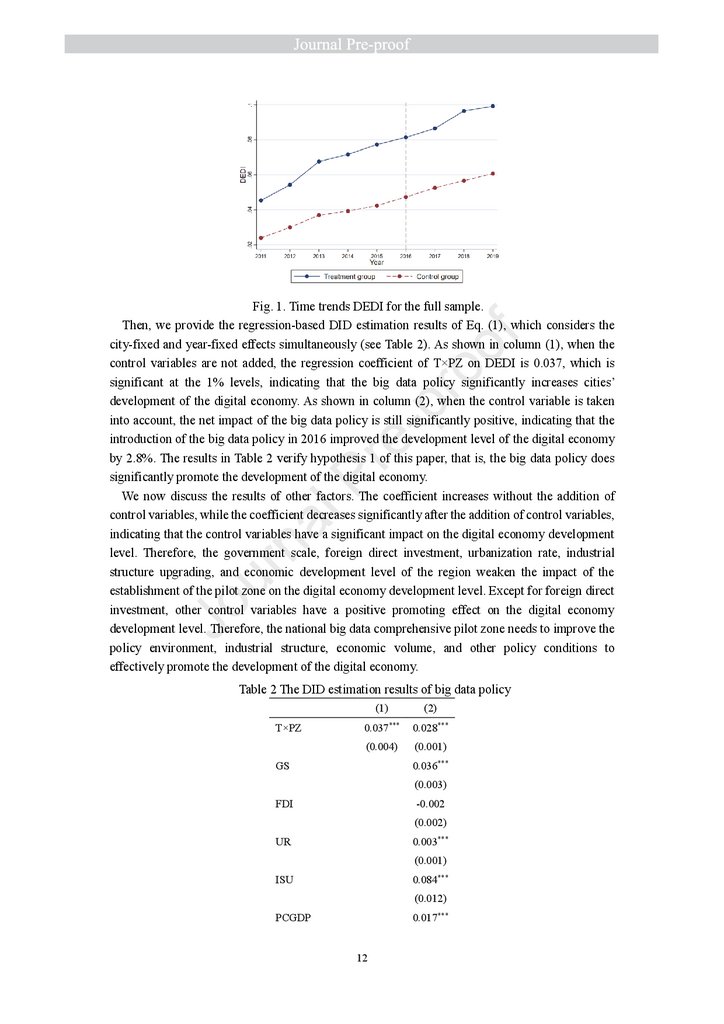
The validity of the DID model relies on the parallel trend assumption, i.e., that the treated and
untreated groups have the same trend before the policy intervention. We first draw Fig. 1 to show
the time trend of DEDI of treated and untreated cities and compare their difference intuitively. It
shows that before the policy intervention of the pilot zone, the time trends of DEDI were parallel
for the treatment group and control group. In contrast, after the publication of the big data policy,
time trends for the two groups began diverging, as the DEDI of treated cities increased faster than
those of untreated cities from 2017 to 2018. The intuition justifies the use of the DID method for
policy evaluation.
The Chinese mainland (excluding Hong Kong, Macao and Taiwan) has 293 prefecture-level cities and 4 municipalities directly under the
Central Government i.e.Beijing, Shanghai, Tianjin, and Chongqing . Because of the limitations of data collection, we exclude 6 cities in
Tibet Autonomous Region (i.e.Lhasa, Shigatse, Shannan, Changdu, Naqu and Nyingchi ), 2 cities in Xinjiang Uygur Autonomous Region
(i.e.Turpan and Hami), 2 cities in Guizhou Province (i.e.Tongren and Bijie), Hulunbuir in Inner Mongolia Autonomous Region, Pu'er in
Yunnan Province, Sansha in Hainan Province, Bozhou in Anhui Province, Haidong in Qinghai Province, Suihua in Heilongjiang Province,
and Xiangyang in Hubei Province.
②
It includes 4 municipalities directly under the central government i.e.Beijing, Shanghai, Tianjin, and Chongqing , Shenyang in Liaoning
Province, 4 cities in Guizhou Province, 11 cities in Hebei Province, 21 cities in Guangdong Province, 17 cities in Henan Province and 8
cities in Inner Mongolia Autonomous Region.
①
11
13.
Jour
na
lP
re
-p
r
oo
f
Fig. 1. Time trends DEDI for the full sample.
Then, we provide the regression-based DID estimation results of Eq. (1), which considers the
city-fixed and year-fixed effects simultaneously (see Table 2). As shown in column (1), when the
control variables are not added, the regression coefficient of T×PZ on DEDI is 0.037, which is
significant at the 1% levels, indicating that the big data policy significantly increases cities’
development of the digital economy. As shown in column (2), when the control variable is taken
into account, the net impact of the big data policy is still significantly positive, indicating that the
introduction of the big data policy in 2016 improved the development level of the digital economy
by 2.8%. The results in Table 2 verify hypothesis 1 of this paper, that is, the big data policy does
significantly promote the development of the digital economy.
We now discuss the results of other factors. The coefficient increases without the addition of
control variables, while the coefficient decreases significantly after the addition of control variables,
indicating that the control variables have a significant impact on the digital economy development
level. Therefore, the government scale, foreign direct investment, urbanization rate, industrial
structure upgrading, and economic development level of the region weaken the impact of the
establishment of the pilot zone on the digital economy development level. Except for foreign direct
investment, other control variables have a positive promoting effect on the digital economy
development level. Therefore, the national big data comprehensive pilot zone needs to improve the
policy environment, industrial structure, economic volume, and other policy conditions to
effectively promote the development of the digital economy.
Table 2 The DID estimation results of big data policy
T×PZ
(1)
(2)
0.037***
0.028***
(0.004)
(0.001)
0.036***
GS
(0.003)
FDI
-0.002
(0.002)
0.003***
UR
(0.001)
0.084***
ISU
(0.012)
0.017***
PCGDP
12
14.
(0.003)8.346***
6.246***
(0.000)
(0.000)
Year-fixed effect
Yes
Yes
City-fixed effect
Yes
Yes
Observations
2520
2520
R2
0.613
0.424
Adj. R2
0.608
0.415
Cons
Note: Standard errors in parentheses; *, **, *** indicate significance levels of 10%, 5%, and 1%, respectively.
4.2. Robust test
Jo
ur
na
lP
re
-p
r
oo
f
To further test the robustness of the results, we conduct a counterfactual test by changing the
policy implementation time. In addition to the policy change of the establishment of the pilot zones,
some other policies or random factors that are not related to the pilot zones may also lead to
differences in the development of cities’ digital economy, which eventually leads to the failure of
the previous regression results. To eliminate the influence of such factors, we assume that the year
of setting up the pilot zones in each city is 1 year, 2 years, or 3 years ahead of schedule. If the core
explanatory variable is significant at the assumed time, it indicates that the development of the
digital economy is likely due to other policy changes or random factors. On the contrary, if the core
explanatory variable is not significant at the assumed time, it shows that the incremental contribution
of digital economy development comes from the establishment of the pilot zones. Columns (1) to
(3) in Table 3 respectively indicate that the assumed establishment time of the pilot zones is 3 years,
2 years, or 1 year ahead of schedule. The counterfactual test shows that the core explanatory variable
is not significant at the assumed time, indicating that the development of the digital economy is not
caused by other factors, but by the establishment of the pilot zones.
In addition to using the counterfactual test to verify the parallel trend, we also use the single
difference method to test the effect of the pilot zones on the development of the digital economy
according to the traditional processing method. The regression results are shown in columns (4) and
(5) of Table 3. Whether other variables are controlled or not, the estimation coefficients of T×PZ are
significantly positive after the city-fixed effect is controlled. However, by observing the coefficients
of T×PZ, it can be found that the coefficients obtained by the single difference method are higher
than those obtained by the DID method in Table 2. It shows that although the traditional single
difference method can explain some problems, this method overestimates the role of the pilot zones
in the development of the digital economy. Therefore, the estimation results obtained by the DID
method are more reliable.
Table 3 The counterfactual test and single difference test
Counterfactual test
(1)
L3. T×PZ
(2)
(3)
0.012
(0.008)
L2. T×PZ
0.010
(0.007)
L1. T×PZ
0.009
13
Single difference test
(4)
(5)
15.
(0.005)T×PZ
0.058***
0.045***
(0.001)
(0.004)
Control variables
Yes
Yes
Yes
No
Yes
Year-fixed effect
Yes
Yes
Yes
No
No
City-fixed effect
Yes
Yes
Yes
Yes
Yes
Observations
2520
2520
2520
2520
2520
R2
0.657
0.657
0.656
0.529
0.556
Adj. R2
0.651
0.651
0.651
0.520
0.551
Note: Standard errors in parentheses; *, **, *** indicate significance levels of 10%, 5%, and 1%, respectively.
oo
f
4.3. Test results for Hypothesis 2
Jo
ur
na
lP
re
-p
r
According to hypothesis 2, the difference between initial resource elements and economic
development degree will lead to different effects of the pilot zones on the development of the digital
economy. Due to the long-term impact of path dependence, the regions with better initial conditions
will obtain higher benefits from the policy than the relatively backward regions. To test hypothesis
2, we first select four groups, namely, municipalities directly under the Central
Government①(MDUCG), sub-provincial cities (SPC), provincial capitals (PC), and larger cities②
(LC), so we set 4 dummy variables. Then we multiply the 4 dummy variables by Tt×PZi to obtain 3
interactive items and redo the regression analysis.
The administrative level of cities is a key factor that cannot be ignored when exploring the
differences in urban development in China. Unlike urbanization in western countries, which is a
process of continuous expansion of the market economy, China’s urbanization relies on a top-down
political and administrative system. Under such a system, the important resources or production
factors are distributed from cities with high administrative levels to those with low administrative
levels. On the one hand, the higher the administrative level of a city, the broader its economic and
social management authority, which helps it to seek more policy facilitation and strategic resources
from the central government. On the other hand, under the “siphon effect”, the profit-driven nature
of production factors such as population, capital, and technology is constantly emerging, which is
more conducive to the high-quality development of cities. Therefore, it is an appropriate perspective
to investigate heterogeneity from the administrative hierarchy.
Drawing on Nie et al., the administrative hierarchy is used to classify cities [48]. First, MDUCG
are administratively designated cities directly under the jurisdiction of the Central Government and
the administrative level is highest. Second, SPC, including 10 provincial capital cities ③ and 5
municipalities with independent planning status under the national social and economic
development④, have part of the legislative power granted by the constitution due to their unique
economic status. They also have greater advantages over other cities in terms of initial resources
and policy preference and they are classified as the second category in this paper. Third, the PC,
including 10 sub-provincial cities mentioned above and 17 general provincial capitals⑤ of which
the overall level is slightly lower than that of the SPC. Fourth, LC are other larger cities approved
by the State Council. They have the same power to formulate local laws and regulations as the PC,
Beijing, Tianjin, Shanghai and Chongqing
Dalian, Benxi, Fushun, Jilin, Qiqihar, Baotou, Luoyang, Handan, Ningbo, Datong, Tangshan, Anshan, Qingdao, Zibo, Wuxi, Huainan,
Suzhou and Xuzhou.
③
Guangzhou, Wuhan, Harbin, Shenyang, Chengdu, Nanjing, Xi’an, Changchun, Jinan and Hangzhou
④
Dalian, Qingdao, Ningbo, Xiamen and Shenzhen
⑤
Taiyuan, Zhengzhou, Shijiazhuang, Hefei, Changsha, Nanchang, Nanning, Kunming, Xining, Fuzhou, Urumqi, Lhasa, Hohhot, Haikou,
Yinchuan, Lanzhou and Guiyang
①
②
14
16.
Jour
na
lP
re
-p
r
oo
f
but their administrative level is lower than that of the PC.
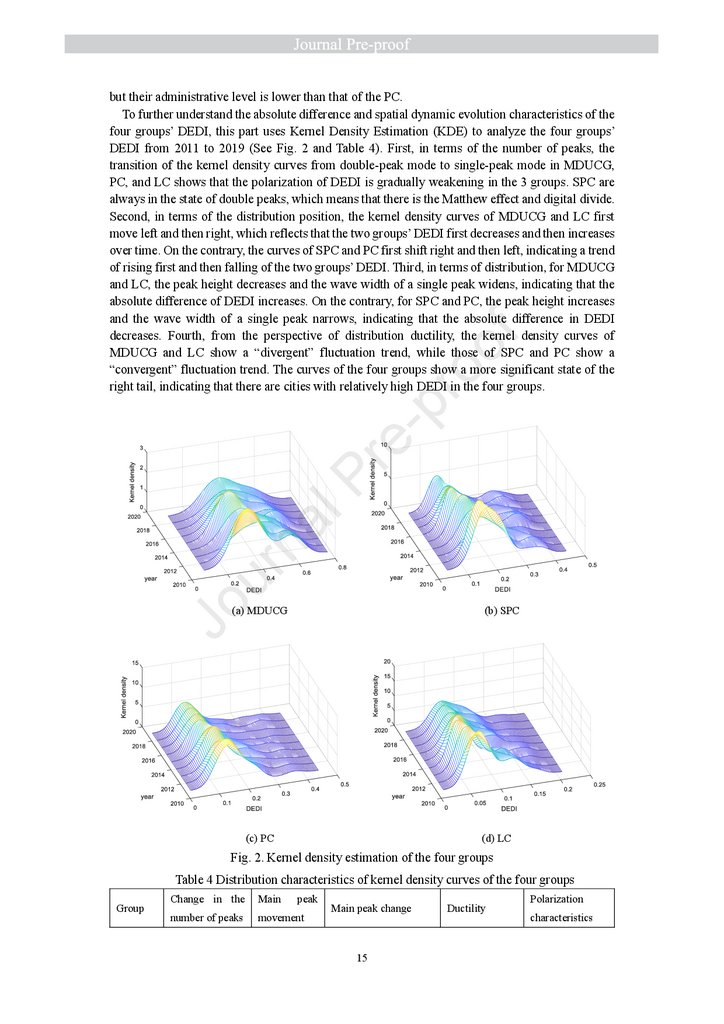
To further understand the absolute difference and spatial dynamic evolution characteristics of the
four groups’ DEDI, this part uses Kernel Density Estimation (KDE) to analyze the four groups’
DEDI from 2011 to 2019 (See Fig. 2 and Table 4). First, in terms of the number of peaks, the
transition of the kernel density curves from double-peak mode to single-peak mode in MDUCG,
PC, and LC shows that the polarization of DEDI is gradually weakening in the 3 groups. SPC are
always in the state of double peaks, which means that there is the Matthew effect and digital divide.
Second, in terms of the distribution position, the kernel density curves of MDUCG and LC first
move left and then right, which reflects that the two groups’ DEDI first decreases and then increases
over time. On the contrary, the curves of SPC and PC first shift right and then left, indicating a trend
of rising first and then falling of the two groups’ DEDI. Third, in terms of distribution, for MDUCG
and LC, the peak height decreases and the wave width of a single peak widens, indicating that the
absolute difference of DEDI increases. On the contrary, for SPC and PC, the peak height increases
and the wave width of a single peak narrows, indicating that the absolute difference in DEDI
decreases. Fourth, from the perspective of distribution ductility, the kernel density curves of
MDUCG and LC show a “divergent” fluctuation trend, while those of SPC and PC show a
“convergent” fluctuation trend. The curves of the four groups show a more significant state of the
right tail, indicating that there are cities with relatively high DEDI in the four groups.
(a) MDUCG
(b) SPC
(c) PC
(d) LC
Fig. 2. Kernel density estimation of the four groups
Table 4 Distribution characteristics of kernel density curves of the four groups
Group
Change in the
Main
peak
number of peaks
movement
Main peak change
15
Ductility
Polarization
characteristics
17.
MDUCGSPC
PC
LC
Double - Single
Left -Right
Double - double
Right-left
Double - Single
Right-left
Double - Single
Left-right
The height decreases
Right
tail,
Polarization
and the width widens
divergence
The height increases
Right
and the width narrows
convergence
The height increases
Right
and the width narrows
convergence
weakening
The height decreases
Right
Polarization
and the width widens
divergence
weakening
tail,
tail,
tail,
Polarization
Polarization
weakening
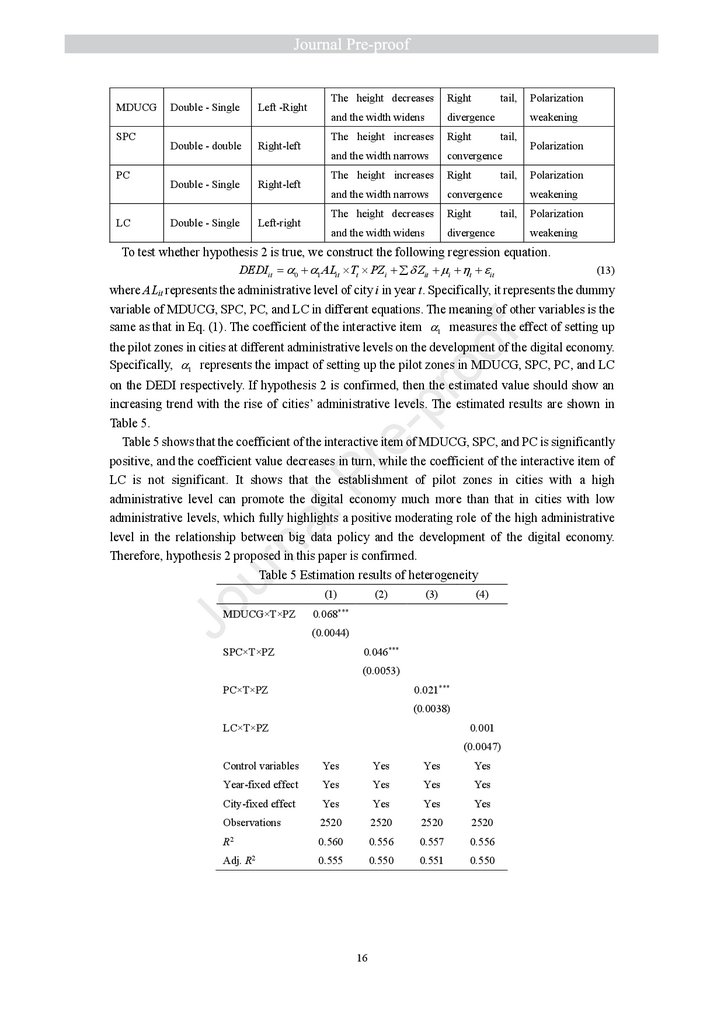
To test whether hypothesis 2 is true, we construct the following regression equation.
DEDIit = 0 + 1 ALit Tt PZi + Zit + i + t + it
(13)
oo
f
where ALit represents the administrative level of city i in year t. Specifically, it represents the dummy
variable of MDUCG, SPC, PC, and LC in different equations. The meaning of other variables is the
same as that in Eq. (1). The coefficient of the interactive item 1 measures the effect of setting up
the pilot zones in cities at different administrative levels on the development of the digital economy.
Specifically, 1 represents the impact of setting up the pilot zones in MDUCG, SPC, PC, and LC
ur
na
lP
re
-p
r
on the DEDI respectively. If hypothesis 2 is confirmed, then the estimated value should show an
increasing trend with the rise of cities’ administrative levels. The estimated results are shown in
Table 5.
Table 5 shows that the coefficient of the interactive item of MDUCG, SPC, and PC is significantly
positive, and the coefficient value decreases in turn, while the coefficient of the interactive item of
LC is not significant. It shows that the establishment of pilot zones in cities with a high
administrative level can promote the digital economy much more than that in cities with low
administrative levels, which fully highlights a positive moderating role of the high administrative
level in the relationship between big data policy and the development of the digital economy.
Therefore, hypothesis 2 proposed in this paper is confirmed.
Table 5 Estimation results of heterogeneity
Jo
(1)
MDUCG×T×PZ
(2)
(3)
(4)
0.068***
(0.0044)
0.046***
SPC×T×PZ
(0.0053)
0.021***
PC×T×PZ
(0.0038)
LC×T×PZ
0.001
(0.0047)
Control variables
Yes
Yes
Yes
Yes
Year-fixed effect
Yes
Yes
Yes
Yes
City-fixed effect
Yes
Yes
Yes
Yes
Observations
2520
2520
2520
2520
R2
0.560
0.556
0.557
0.556
Adj. R2
0.555
0.550
0.551
0.550
16
18.
4.4. Test results for Hypothesis 3Whether the promotion effect of big data policy on the development of the digital economy is
mediated by the technological innovation effect and human capital effect needs to be tested by the
mediating effect model [49]. We set the equations of the mediating effect model as follows:
DEDIit = 0 + 1Tt PZi + Zit + i + t + it
(14)
M it = 0 + 1Tt PZi + Zit + i + t + it
(15)
DEDIit = 0 + 1Tt PZi + 2 M it + Zit + i + t + it
(16)
In these equations, Mit denotes mediators, including technological innovation (TIit) and human
capital (HCit) of city i in year t. The meaning of other variables is the same as that in Eq. (1). 1 is
the total effect of big data policy on the DEDI; 1 is the direct effect of big data policy on the DEDI
oo
f
when the influence of the mediator and other control variables are controlled; β1 γ2 is the mediating
re
-p
r
effect that is also identical to an indirect effect. The relationship between total effect, direct effect,
and mediating effect is as follows [50]:
α1 =γ1 +β1 γ2
(17)
If both β1 and γ 2 in these equations are statistically significant, and γ1 α1 , then the
lP
relationship between big data policy and the development of the digital economy is partially
mediated by the mediating variable. If γ1 is not statistically significant, then the relationship is
Jo
ur
na
totally mediated by the mediator.
TI is measured by the number of patent applications per 10,000 people in each city. Compared
with the number of patent authorizations, the number of patent applications can objectively reflect
the true level of a city’s innovation capacity without being affected by man-made evaluation such
as the ability of patent examination and patent judgment [51]. HC is measured by the proportion of
students in colleges and universities. Relevant data comes from Chinese Research Data Services
(CNRDS) and China City Statistical Yearbook. The estimation results of the mediating effect model
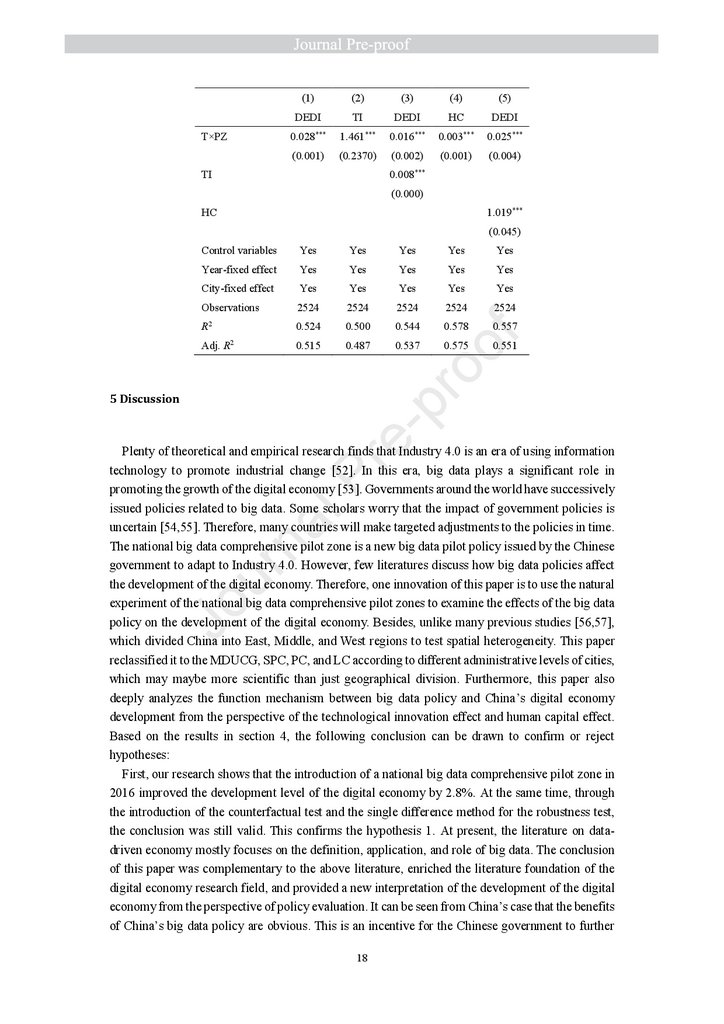
are shown in Table 6. As can be seen from column (1), the total effect of big data policy on the
development of the digital economy is 0.028 with a 1% significance level. Columns (2) and (3)
display that the coefficient of direct effect is 0.016 which is significant and slightly smaller than the
total effect when controlling T×PZ and TI at the same time, suggesting that the relationship between
big data policy on the development of the digital economy is partly mediated by technological
innovation. The mediating effect is 0.012 (1.461×0.008), accounting for 41.7% of the total effect,
which means that the big data policy promotes the development of the digital economy by
stimulating technological innovation. Similarly, Columns (4) and (5) show that the coefficient of
direct effect is 0.025 with a 1% significance level when controlling T×PZ and HC at the same time,
and the mediating effect is 0.003 (0.003×1.019), accounting for 10.9% of the total effect, which
means that the human capital plays a partial mediating role between the big data policy and the
development of the digital economy. Overall, the big data policy can promote the development of
the digital economy through the technological innovation effect and human capital effect, which
verifies hypothesis 3.
Table 6 Estimation results of mediating effect model
17
19.
T×PZ(1)
(2)
(3)
(4)
(5)
DEDI
TI
DEDI
HC
DEDI
0.028***
1.461***
0.016***
0.003***
0.025***
(0.001)
(0.2370)
(0.002)
(0.001)
(0.004)
0.008***
TI
(0.000)
1.019***
HC
(0.045)
Control variables
Yes
Yes
Yes
Yes
Yes
Year-fixed effect
Yes
Yes
Yes
Yes
Yes
Yes
Yes
Yes
Yes
Yes
Observations
2524
2524
2524
2524
2524
R2
0.524
0.500
0.544
0.578
0.557
Adj. R2
0.515
0.487
0.537
oo
f
City-fixed effect
re
-p
r
0.575
5 Discussion
0.551
Jo
ur
na
lP
Plenty of theoretical and empirical research finds that Industry 4.0 is an era of using information
technology to promote industrial change [52]. In this era, big data plays a significant role in
promoting the growth of the digital economy [53]. Governments around the world have successively
issued policies related to big data. Some scholars worry that the impact of government policies is
uncertain [54,55]. Therefore, many countries will make targeted adjustments to the policies in time.
The national big data comprehensive pilot zone is a new big data pilot policy issued by the Chinese
government to adapt to Industry 4.0. However, few literatures discuss how big data policies affect
the development of the digital economy. Therefore, one innovation of this paper is to use the natural
experiment of the national big data comprehensive pilot zones to examine the effects of the big data
policy on the development of the digital economy. Besides, unlike many previous studies [56,57],
which divided China into East, Middle, and West regions to test spatial heterogeneity. This paper
reclassified it to the MDUCG, SPC, PC, and LC according to different administrative levels of cities,
which may maybe more scientific than just geographical division. Furthermore, this paper also
deeply analyzes the function mechanism between big data policy and China’s digital economy
development from the perspective of the technological innovation effect and human capital effect.
Based on the results in section 4, the following conclusion can be drawn to confirm or reject
hypotheses:
First, our research shows that the introduction of a national big data comprehensive pilot zone in
2016 improved the development level of the digital economy by 2.8%. At the same time, through
the introduction of the counterfactual test and the single difference method for the robustness test,
the conclusion was still valid. This confirms the hypothesis 1. At present, the literature on datadriven economy mostly focuses on the definition, application, and role of big data. The conclusion
of this paper was complementary to the above literature, enriched the literature foundation of the
digital economy research field, and provided a new interpretation of the development of the digital
economy from the perspective of policy evaluation. It can be seen from China’s case that the benefits
of China’s big data policy are obvious. This is an incentive for the Chinese government to further
18
20.
Jour
na
lP
re
-p
r
oo
f
strengthen the construction of pilot zones. The US’s Big Data Research and Development Initiative,
the Australian Public Service Information and Communications Technology Strategy, and the EU’s
General Data Protection Regulation are important documents on big data strategies of countries all
over the world. We support the integration of similar documents to implement a unified big data
management system for various countries and create a “prosperous data-driven economy”.
Second, our study finds that the effect of big data policy is the most evident in the MDUCG with
the highest administrative level, followed by the SPC and PC with relatively high administrative
level, while the effect is not significant in the LC with the lowest administrative level, which
confirms the hypothesis 2. This is consistent with the path dependence theory [58,59]. Due to the
long-term impact of path dependence, the regions with better initial conditions will obtain higher
policy benefits than the relatively backward regions. Under the background of China, the initial
conditions of a city are related to the administrative level of the city. The higher the administrative
level of a city, the better its initial resources and economic conditions. Therefore, the establishment
of pilot zones in cities with a high administrative level can promote the digital economy much more
than that in cities with a low administrative level. This paper considers the heterogeneity of policy
effects, more comprehensively reflects the relationship between the big data policy and the digital
economy, and the empirical results have clearer policy implications.
Third, the relationship between big data policy on the development of the digital economy is
partly mediated by technological innovation and human capital. The mediating effects are
respectively 0.012 and 0.003, accounting for 41.7% and 10.9% of the total effects, indicating that
the big data policy can promote the development of the digital economy through the technological
innovation effect and human capital effect, which confirms hypothesis 3. On the one hand, the
widespread application of information technologies such as the Internet and big data has broken the
information gap in the market, to accelerate the dissemination of information among enterprises and
the spread of new technologies between high-tech and non-high-tech industries. This forces the
R&D department of enterprises to continue to develop new technologies, create new business
models, and allow low-cost innovation. On the other hand, mastering information technology
requires high-quality human capital, and industry labor capital directly determines the level of
development of the digital economy. The improvement of labor literacy is a key factor in the rapid
development of the digital economy. We agree with these views and this article provides a new
internal theoretical mechanism for the relationship between the big data policy and the development
of the digital economy from the perspective of technological innovation and human capital.
6. Conclusion, policy implications and limitation
6.1 Conclusion and policy implications
Based on the panel data of 280 cities in China from 2011 to 2019, this paper measures the digital
economy development index by Entropy -TOPSIS method uses the DID model to evaluate the
policy effect of the national big data comprehensive pilot zones on China’s digital economy
development and discusses the heterogeneity of policy effect from the perspective of cities’
administrative level. In addition, from the perspective of technological innovation and human
19
21.
urna
lP
re
-p
r
oo
f
capital, the mediating effect model is used to empirically test the impact mechanism of big data
policy on the development of the digital economy. The results show the following: (1) The big data
policy significantly promotes China’s digital economy development. (2) Cities at a higher
administrative level receive higher policy benefits than cities at a lower administrative level. (3) The
big data policy strengthens its positive impact on the development of the digital economy through
the technological innovation effect and the human capital effect.
Based on the above conclusions, this paper proposes the following policy recommendations:
First, the construction of big data pilot zones should continue to be expanded, giving full play to
the radiation-driven and demonstration-led effects of pilot zones on the digital economy. Since big
data policies can effectively promote the digital economy development, it is necessary to actively
utilize big data policies, efficiently use government digital subsidies, guide the flow of social capital
to the key technological areas of the big data industry, and form a digital industry agglomeration.
Second, we suggest expanding the pilot area to cities with high administrative levels, which will
maximize the total policy benefits in the short term. The results of the heterogeneity analysis suggest
that the pilot zones in cities with higher administrative levels play a more positive role. However,
the government also needs to pay attention to providing financial and technical assistance to cities
at lower administrative levels to narrow the digital divide between regions.
Third, we should enhance the capacity for independent innovation in digital technology and
strengthen the cultivation of digital talents. Mechanism analysis shows that technological innovation
and human capital are important channels for the pilot zone to promote the development of the
digital economy. Therefore, it is necessary to focus on the coordination of digital resources and
encourage the R&D of basic digital technologies to realize technological breakthroughs in key areas
and promote the transformation of scientific and technological achievements. Meanwhile, it is
necessary to strengthen the training of digital talents and provide them with talent subsidies and a
favorable innovation environment.
Jo
6.2. Limitations and Future Recommendations
However, there are still some limitations. On the one hand, the impact of big data pilot zones on
the digital transformation of enterprises can be further explored, and spatial econometrics can be
used to analyze the radiation effect of big data pilot zones on the digital economy of neighboring
regions. On the other hand, due to the different stages and backgrounds in which each country finds
itself, there may be limitations in extending the conclusions to a new context, location, or culture,
and thus more cross-border data are needed for comparative studies. Therefore, the impact of big
data pilot zones on the digital economy can be examined in the future in conjunction with other data
and methods. In addition, in recent years, China has launched new digital policies, such as the “AI
innovative development pilot zones”, whose policy effects can be studied in depth.
Funding information
This work was supported by the National Social Science Foundation (21CJL013), Humanities and
20
22.
Social Sciences Research Project of Chongqing Municipal Education Commission (22SKGH234),China Postdoctoral Science Foundation(2023M740457), Chongqing Higher Education Teaching
Reform Research Key Project (232084), Chongqing Technology and Business University
Foundation (2155009).
Consent to participate
Informed consent was obtained from all individual participants included in the study.
oo
f
Consent to publish
Author contribution statement
re
-p
r
Patients signed informed consent regarding publishing their data and photographs.
ur
na
Data availability statement
lP
All authors listed have significantly contributed to the development and the writing of this article.
Jo
Has data associated with your study been deposited into a publicly available repository? No.
Please select why.
Data will be made available on request.
Additional information
No additional information is available for this paper.
Declaration of competing interest
The authors declare that they have no known competing financial interests or personal relationships
that could have appeared to influence the work reported in this paper.
21
23.
References[1]
B. Yuan, Q. Xiang, Environmental regulation, industrial innovation and green development of Chinese
manufacturing: Based on an extended CDM model, J. Clean Prod. 176 (2018 Mar 1) 895-908.
[2]
B. Yuan, Y. Zhang, Flexible environmental policy, technological innovation and sustainable development of
China’s industry: The moderating effect of environment regulatory enforcement, J. Clean Prod. 243 (2020 Jan
10) 118543.
[3]
S. Chen, Z. Sun, S. Tang, D. Wu, Government intervention and investment efficiency: Evidence from China,
J. Corp. Financ. 17(2) (2011 Apr) 259-271.
[4]
H. Wen, Z. Zhao, How does China’s industrial policy affect firms’ R&D investment? Evidence from ‘Made in
China 2025’, Appl. Econ. 53(55) (2020 Jan 21) 6333-6347.
X. Tian, J. Zheng, L. Hu, Y. Liu, H. Wen, X. Dong, Impact of China’s waste import policy on the scrap copper
oo
f
[5]
recovery pattern and environmental benefits, Waste Manage. 135 (2021 Nov) 287-297.
[6]
D. Tapscott, Blueprint to the digital economy: Creating wealth in the era of e-business, New York: McGraw
re
-p
r
Hill (1999).
[7]
H. Wen, C. Wen, C.C. Lee, Impact of digitalization and environmental regulation on total factor
productivity. Inf. Econ. Policy 61 (2022 Dec) 101007.
[8]
S. Md, L. Allan, A. Khorshed, On the contribution of information and communication technology to
[9]
lP
productivity growth in Australia, Econ. Chang. Restruct. 48 (2015 August 11) 281–304.
F. Machlup, The production and distribution of knowledge in the United States, Princeton university press
(1962).
(1977).
ur
na
[10] M.U. Porat, M.R. Rubin, The information economy, Department of Commerce, Office of Telecommunications
[11] C. Watanabe, K. Naveed, Y. Tou, P. Neittaanmäki, Measuring GDP in the digital economy: Increasing
dependence on uncaptured GDP, Technol. Forecast. Soc. Chang. 137 (2018 Dec) 226-240.
Jo
[12] OECD., Measuring digital trade: Towards a conceptual framework, Pairs: OECD Publishing (2017).
[13] K. Barefoot, D. Curtis, W. Jolliff, J.R. Nicholson, R. Omohundro, Defining and measuring the digital economy,
US Department of Commerce Bureau of Economic Analysis, Washington, DC, 15 (2018 Mar).
[14] M. Dobrota, V. Jeremic, A. Markovic, A new perspective on the ICT Development Index, Inf. Dev. 28(4) (2012
June 6) 271-280.
[15] A. Stavytskyy, G. Kharlamova, E.A. Stoica, The analysis of the digital economy and society index in the EU,
TalTech J. Eur. Stud. 9(3) (2019 Sept) 245-261.
[16] S. Ojanperä, M. Graham, M. Zook, The digital knowledge economy index: mapping content production. J.
Dev. Stud. 55(12) (2019 Jan 30) 2626-2643.
[17] Q. Wang, J. Sun, U.K. Pata, R. Li, M.T. Kartal, Digital economy and carbon dioxide emissions: Examining
the role of threshold variables, Geosci. Front. (2023 June 5) 101644.
[18] M. Mueller, K. Grindal, Data flows and the digital economy: information as a mobile factor of production,
Digit. Policy Regul. Gov. 21(1) (2018 Dec) 71-87.
[19] S.F. Wamba, S. Akter, A. Edwards, G. Chopin, D. Gnanzou, How ‘big data’ can make big impact: Findings
from a systematic review and a longitudinal case study, Int. J. Prod. Econ. 165 (2015 July) 234-246.
[20] M.K. Saggi, S. Jain, A survey towards an integration of big data analytics to big insights for value-creation,
Inf. Process. Manage. 54(5) (2018 Sept) 758-790.
[21] J. Manyika, M. Chui, B. Brown, J. Bughin, R. Dobbs, C. Roxburgh, A. Hung Byers, Big data: The next frontier
22
24.
for innovation, competition, and productivity, McKinsey Global Institute (2011).[22] S. Yilmaz, K.E. Haynes, M. Dinc, Geographic and network neighbors: Spillover effects of telecommunications
infrastructure, J. Reg. Sci. 42(2) (2002 Dec 17) 339-360.
[23] C.L. McNeely, J.O. Hahm, The big (data) bang: Policy, prospects, and challenges, Rev. Policy Res. 31(4)
(2014 July 16) 304-310.
[24] I.A.T. Hashem, V. Chang, N.B. Anuar, K. Adewole, I. Yaqoob, A. Gani, ... H. Chiroma, The role of big data in
smart city, Int. J. Inf. Manage. 36(5) (2016 Oct) 748-758.
[25] P. Casanovas, L. De Koker, D. Mendelson, D. Watts, Regulation of Big Data: Perspectives on strategy, policy,
law and privacy, Health Technol. 7(4) (2017 May 08) 335-349.
[26] V. Albino, U. Berardi, R.M. Dangelico, Smart cities: Definitions, dimensions, performance, and initiatives, J.
Urban Technol. 22(1) (2015 Feb 04) 3-21.
[27] A. Visvizi, M.D. Lytras, E. Damiani, H. Mathkour, Policy making for smart cities: Innovation and social
oo
f
inclusive economic growth for sustainability, J. Sci. Technol. Policy Manag. 9(2) (2018 July 12) 126-133.
[28] S. Qureshi, L. Najjar, Information and communications technology use and income growth: Evidence of the
multiplier effect in very small island states, Inform. Technol. Dev. 23(2) (2017 Apr 26) 212-234.
Strateg. Manag. 23(1) (2018 Jan) 20-28.
re
-p
r
[29] I. Domazet, J. Zubović, M. Lazić, Driving factors of Serbian competitiveness: Digital economy and ICT,
[30] C. Corrado, J. Haskel, C. Jona‐Lasinio, Knowledge spillovers, ICT and productivity growth, Oxf. Bull. Econ.
Stat. 79(4) (2017 Mar 24) 592-618.
11(6) (2019 Mar 25) 1783.
lP
[31] Y. Lu, K. Cao, Spatial analysis of big data industrial agglomeration and development in China, Sustainability
[32] Z. Song, C. Wang, L. Bergmann, China’s prefectural digital divide: Spatial analysis and multivariate
ur
na
determinants of ICT diffusion, Int. J. Inf. Manage. 52 (2020 Jun) 102072.
[33] R. Jedwab, E. Kerby, A. Moradi, History, path dependence and development: Evidence from colonial railways,
settlers and cities in Kenya, Econ. J. 127(603) (2017 Aug) 1467-1494.
[34] R.H. Lin, Z. Xie, Y. Hao, J. Wang, Improving high-tech enterprise innovation in big data environment: A
Jo
combinative view of internal and external governance, Int. J. Inf. Manage. 50 (2020 Feb) 575–585.
[35] J.Q. Dong, J. Netten, Information technology and external search in the open innovation age: New findings
from Germany, Technol. Forecast. Soc. Chang. 120 (2017 Jul) 223–231.
[36] H.M. Zhang, Industrial cluster innovation based on 5G network and internet of things, Microprocess.
Microsyst. 83(1) (2021 Jun) 103974.
[37] R. Howell, C. Beers, N. Doorn, Value capture and value creation: The role of information technology in
business models for frugal innovations in Africa, Technol. Forecast. Soc. Chang. 131 (2018 Jun) 227–239.
[38] H. Wen, W. Chen, F. Zhou, Does digital service trade boost technological innovation?: International evidence,
Socio-Econ. Plan. Sci. (2023 Aug) 101647.
[39] J. Liu, H. Chang, J.Y.L. Forrest, B. Yang, Influence of artificial intelligence on technological innovation:
Evidence from the panel data of China’s manufacturing sectors, Technol. Forecast. Soc. Chang. 158 (2020
Sept) 120-142.
[40] M. Wang, M. Xu, S.J. Ma, The effect of the spatial heterogeneity of human capital structure on regional green
total factor productivity, Struct. Change and Econ. Dyn. 59 (2021 Dec) 427-441.
[41] Q. Wang, F. Zhang, R. Li, Revisiting the environmental kuznets curve hypothesis in 208 counties: The roles
of trade openness, human capital, renewable energy and natural resource rent, Environ. Res. 216 (2023 Jan 1)
114637.
[42] M. Falk, F. Biagi, Relative demand for highly skilled workers and use of different ICT technologies, Appl.
23
25.
Econ. 49(9) (2016 Aug 21) 903-914.[43] Y. Zhu, D. Xu, J. Cheng, S.H. Ali, Estimating the impact of China’s export policy on tin prices: a mode
decomposition counterfactual analysis method, Resour. Policy 59 (2018 Dec) 250-264.
[44] W. Pan, T. Xie, Z. Wang, L. Ma, Digital economy: An innovation driver for total factor productivity, J. Bus.
Res. 139 (2022 Feb) 303-311.
[45] L. Liang, Y. Li, How does government support promote digital economy development in China? The mediating
role of regional innovation ecosystem resilience, Technol. Forecast. Soc. Chang. 188 (2023 Mar) 122328.
[46] G. Zekos, Foreign direct investment in a digital economy, Eur. Bus. Rev. 17(1) (2005 Feb 1) 52-68.
[47] Q. Wang, X. Wang, R. Li, Does urbanization redefine the environmental Kuznets curve? An empirical analysis
of 134 Countries, Sustain. Cities Soc. 76 (2022 Jan) 103382.
[48] C. Nie, Z. Zhong, Y. Feng, Can digital infrastructure induce urban green innovation? New insights from China,
Clean Techn Environ Policy (2023 Oct 13).
oo
f
[49] R.M. Baron, D.A. Kenny, The moderator–mediator variable distinction in social psychological research:
Conceptual, strategic, and statistical considerations. J. Pers. Soc. Psychol. 51(6) (1986) 11-73.
[50] D.P. Mackinnon, G. Warsi, J.H. Dwyer, A simulation study of mediated effect measures, Multivariate Behav.
re
-p
r
Res. 30 (1) (1995) 41-62.
[51] E. Pelinescu, Pauna, C., Saman, C., Diaconescu, T., Human capital, innovation and economic growth the EU
countries, Rom. J. Econ. Forecast 22(4) (2019)160-173.
[52] C.S. Tang, L.P. Veelenturf, The strategic role of logistics in the industry 4.0 era, Transp. Res. Pt. e-Logist.
Transp. Rev. 129 (2019 Sept) 1-11.
May 27) 756-762.
lP
[53] S.V. Novikov, Data science and big data technologies role in the digital economy, TEM Journal, 9(2) (2020
ur
na
[54] U. Bhattacharya, P.H. Hsu, X. Tian, Y. Xu, What affects innovation more: policy or policy uncertainty? J.
Financ. Quant. Anal. 52(5) (2017 Aug 29) 1869-1901.
[55] W. Drobetz, S. El Ghoul, O. Guedhami, M. Janzen, Policy uncertainty, investment, and the cost of capital, J.
Financ. Stab. 39 (2018 Dec) 28-45.
Jo
[56] H. Daiyue, L. Chao, G. Puel, A study of new industrialization and foreign direct investment (FDI) based on
China’s East, Middle and West regions, Afr. J. Bus. Manag. 6(27) (2012 Jul 11) 7931-7937.
[57] S. Wu, X. Zheng, C. You, C. Wei, Household energy consumption in rural China: Historical development,
present pattern and policy implication, J. Clean Prod. 211 (2019 Feb 20) 981-991.
[58] R. Martin, P. Sunley, Path dependence and regional economic evolution, J. Econ. Geogr. 6(4) (2006 Aug) 395437.
[59] R. Bohnsack, H. Kurtz, A. Hanelt, Re-examining path dependence in the digital age: The evolution of
connected car business models, Res. Policy 50(9) (2021 Nov) 104-328.
24
26.
Declaration of interests☒ The authors declare that they have no known competing financial interests or personal relationships
that could have appeared to influence the work reported in this paper.
Jo
ur
na
lP
re
-p
ro
of
☐ The authors declare the following financial interests/personal relationships which may be considered
as potential competing interests: