


 economics
 pedagogy
Similar presentations:
")


Topics in Macroeconomics
1.
2.
MODULETopics in Macroeconomics
WIUT
Date: January 8, 2018
Presenter: Dr. Bilol Buzurukov
3.
Module LeaderModule leader: Bilol Buzurukov
Email: bbuzurukov@wiut.uz
Office hours: Thursday 09:00-11:00
Room number: ATB-216
Telephone number: (+998) 71 2387418
Extension: 644 (office)
4.
Module DeliveryThe module will be taught by a combination of lectures and tutorials.
Lectures are aimed at introducing the theoretical part of
the topic.
Tutorials are designed to blend the theory and practice
and provide students with real-life cases and examples.
During tutorials the students will be analyzing the recent
debate in academic literature on the topics concerned
and discussing them with the tutors and peers.
5.
Module ContentTW-1: Introduction to growth theory;
TW-2: Solow Model of Economic Growth I;
TW-3: Solow Model of Economic Growth II;
TW-4: Exchange Rate Policy and its Impact on Trade;
TW-5: The Keynesian Cross Model, the Money Market and IS-LM Model;
TW-6: Coursework Presentation Week;
TW-7: Monetary Policy: Time Inconsistency and Credibility Problem;
TW-8: Aggregate Demand and Aggregate Supply: Business Cycles;
TW-9: The Goals of Stabilization Policy: Low Inflation and Low Unemployment;
TW-10: Government Debt and Budget Deficits;
TW-11: The Financial System: Opportunities and Dangers;
TW-12: Revision Week.
6.
Learning OutcomesUpon completion of the module, successful students will be able to:
1. Critically evaluate recent developments in macroeconomic analysis;
2. Thoroughly appraise current economic developments in a
variety of contemporary economies;
3. Critically analyze the quality of available economic data and the
difficulties facing policy makers when interpreting this data;
4. Utilize and apply, with confidence, the standard algebraic and
diagrammatic representations of relevant models.
7.
Learning PlatformUniversity Intranet System
Lecture and Seminar slides posted weekly;
Support materials, such as articles, case studies and
data posted:
- for classroom discussions;
- for classroom analysis;
- for classroom practices.
8.
Textbooks and Reading ResourcesCore Textbooks
• Sorensen & Whitta Jacobsen (2010), " Introducing Advanced
Macroeconomics: Growth and Business Cycles", 2nd ed. McGraw-Hill Higher
Education;
• Manfred Gartner (2016), “Macroeconomics”, 5th ed. Pearson;
• Blanchard O., Amighini A. and Giavazzi F. (2017), “Macroeconomics: A European
Perspective”, 3rd ed. Pearson;
• Mankiw, G. (2013). Macroeconomics. 8th ed. Houndmills: Palgrave Macmillan;
Optional Textbooks
• Gordon, R.J (2011), Macroeconomics, 12th edition, Harper Collins;
• Romer, D. (2011), Advanced Macroeconomics, 4th edition, McGraw-Hill Education;
• Stone, G. (2011), “CoreMacroeconomics”, 2nd ed. Worth Publishers.
Periodical references
• Academic Journal Articles and Reports: Journal of Economic Literature, American
Economic Review, Economic Journal, Economic Policy, etc.
9.
AssessmentAssessment 1 – Coursework
40%
Assessment 2 – Final Exam
60%
10.
Guidelines for Assessment 1Each team should consist of 5 students who belong to the same group.
The students should set up their own teams based on mutual respect and
understanding.
I cannot
To accomplish the assignment the following 5 tasks should be completed:
come to the
presentation.
Task 3
2
5
4
1
(25 marks)
(15
(20
Conduct the regression analysis of economic
Obtain
macroeconomic statistics – GDP,
growth relevant
for both country-groups:
GDP
peronly
capita,
rate,per
Inflation
rate,
Review
threeUnemployment
academic
articles
• Specify
the
dependent
variable journal
as GDP
capitathat
and
The
students
should
choose
two
groups
of countries
Government
budget,
Public
debt,
etc.
–
and
critically
construct
relevant
determinants
of
the
regressand;
discuss
cross-country
comparative
analysis
of
Considering the countries under the observation, explain
and
each
containing
two
countries.
• Estimate
results
using The
the Ordinary
Least
analyze
thetherecent
development
trends
inSquares;
both
test
the convergence
hypotheses
within
and
between
the
macroeconomic
factors.
students
are
Provide
relevant
evidence
for
the choice
• Provide
the regression
results
estimated
with of
andcountries
without
Group
REWARD
Presentation
country-groups.
country-groups.
The
use
of
comparative
analysis
encouraged
to choose
academic articles that
robust
standard
errors;specification criterion.
that
meet
the
country
within
and
between the
country-groups
is highly
conduct
comparative
analysis
of country-groups.
• Conduct
specification
tests
to avoid
biased outcomes;
recommended.
• Interpret the results and compare the findings of both
country-groups.
11.
LECTURE 1Introduction to Growth Theory
12.
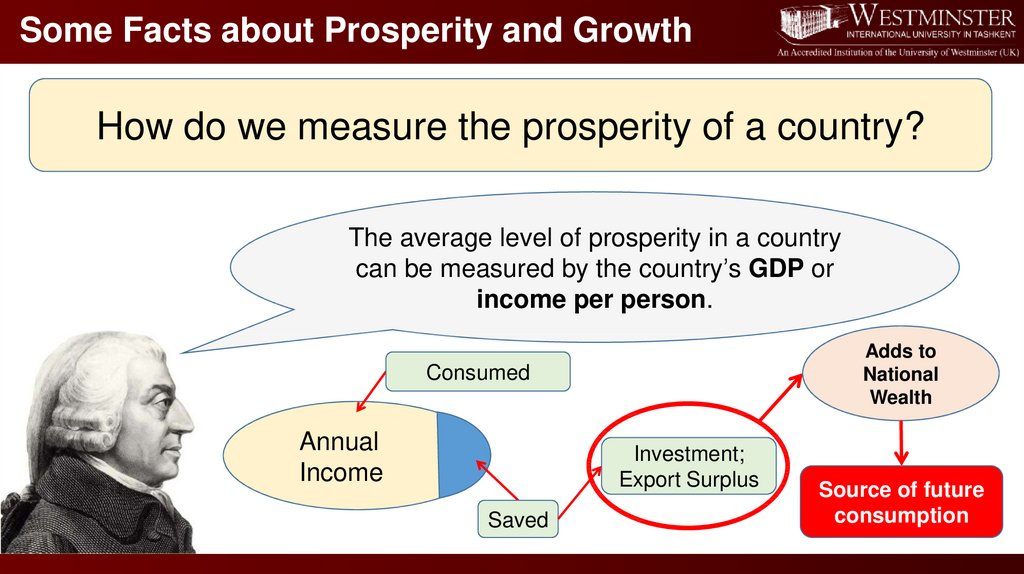
Some Facts about Prosperity and GrowthHow do we measure the prosperity of a country?
The average level of prosperity in a country
can be measured by the country’s GDP or
income per person.
Adds to
National
Wealth
Consumed
Annual
Income
Investment;
Export Surplus
Saved
Source of future
consumption
13.
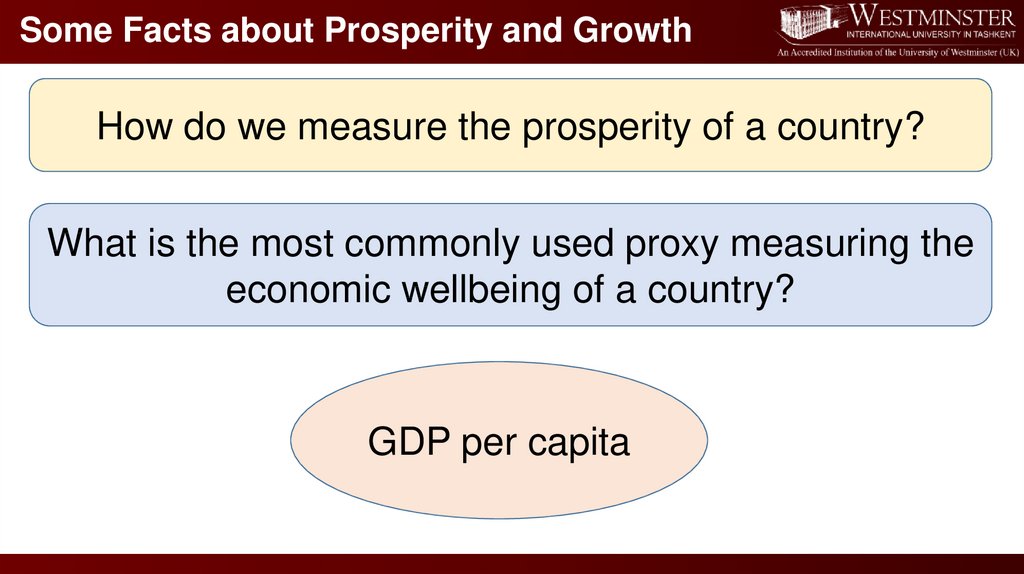
Some Facts about Prosperity and GrowthHow do we measure the prosperity of a country?
What is the most commonly used proxy measuring the
economic wellbeing of a country?
GDP per capita
14.
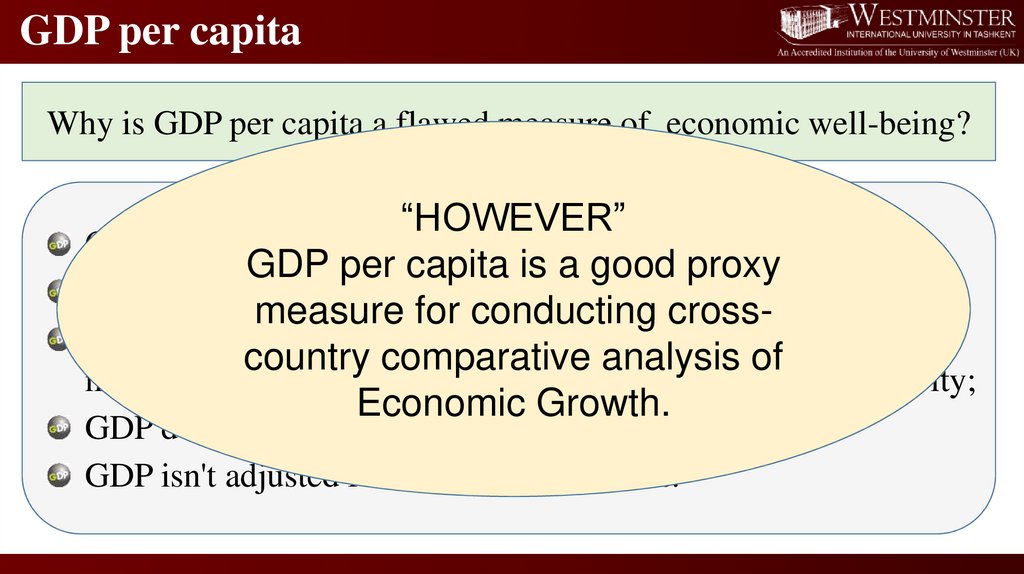
GDP per capitaWhy is GDP per capita a flawed measure of economic well-being?
“HOWEVER”
GDP counts “bads” as well as “goods”;
GDP per capita is a good proxy
GDP makes no adjustment for leisure time;
measure for conducting crossGDP only counts goods that pass through official, organized
country comparative analysis of
markets, so it misses home production and black market activity;
Economic Growth.
GDP doesn't adjust for the distribution of goods;
GDP isn't adjusted for environmental costs.
15.
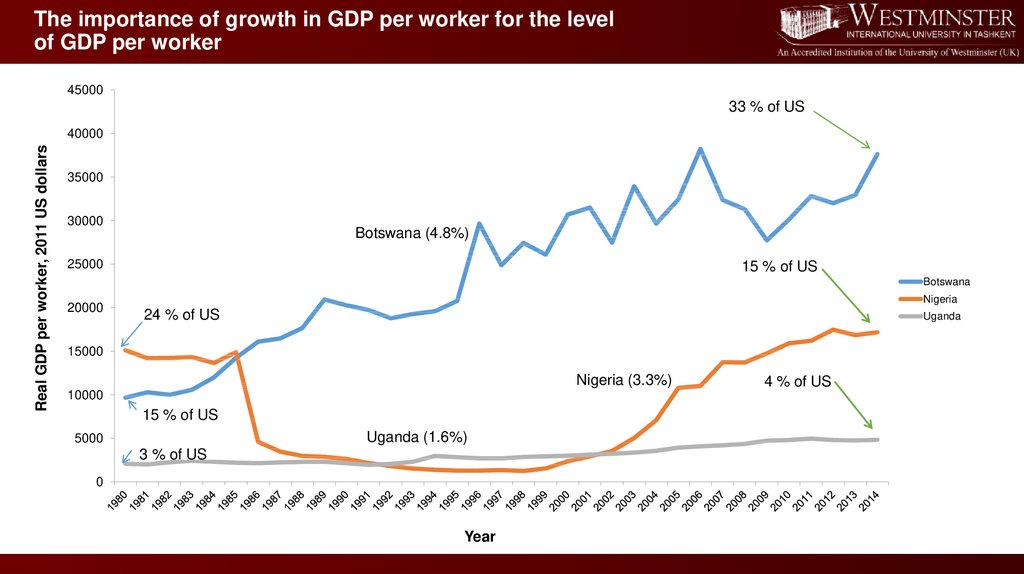
The importance of growth in GDP per worker for the levelof GDP per worker
45000
33 % of US
Real GDP per worker, 2011 US dollars
40000
35000
30000
Botswana (4.8%)
25000
15 % of US
Botswana
20000
Nigeria
24 % of US
Uganda
15000
Nigeria (3.3%)
10000
15 % of US
Uganda (1.6%)
5000
3 % of US
0
Year
4 % of US
16.
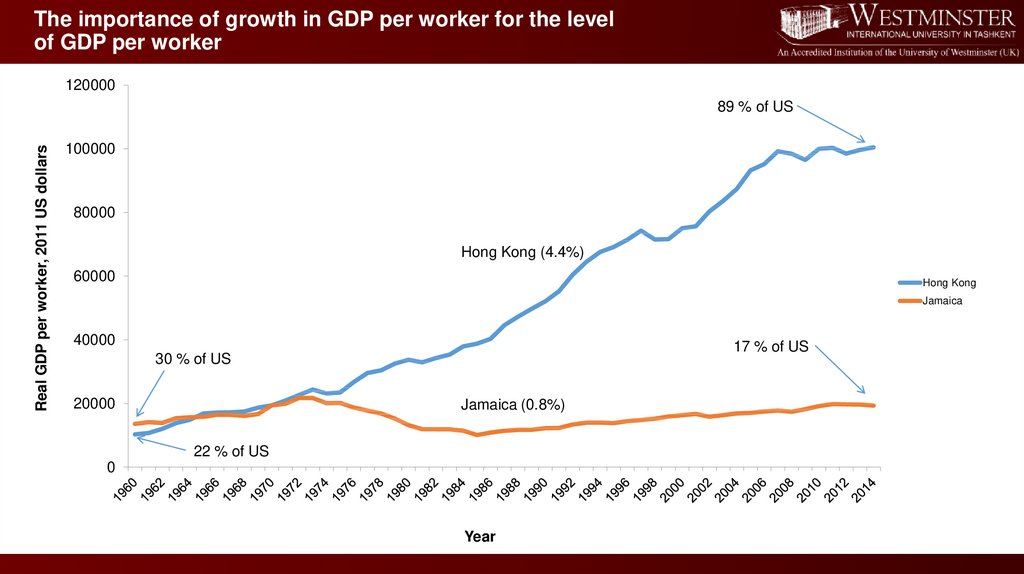
The importance of growth in GDP per worker for the levelof GDP per worker
120000
Real GDP per worker, 2011 US dollars
89 % of US
100000
80000
Hong Kong (4.4%)
60000
Hong Kong
Jamaica
40000
17 % of US
30 % of US
20000
Jamaica (0.8%)
22 % of US
0
Year
17.
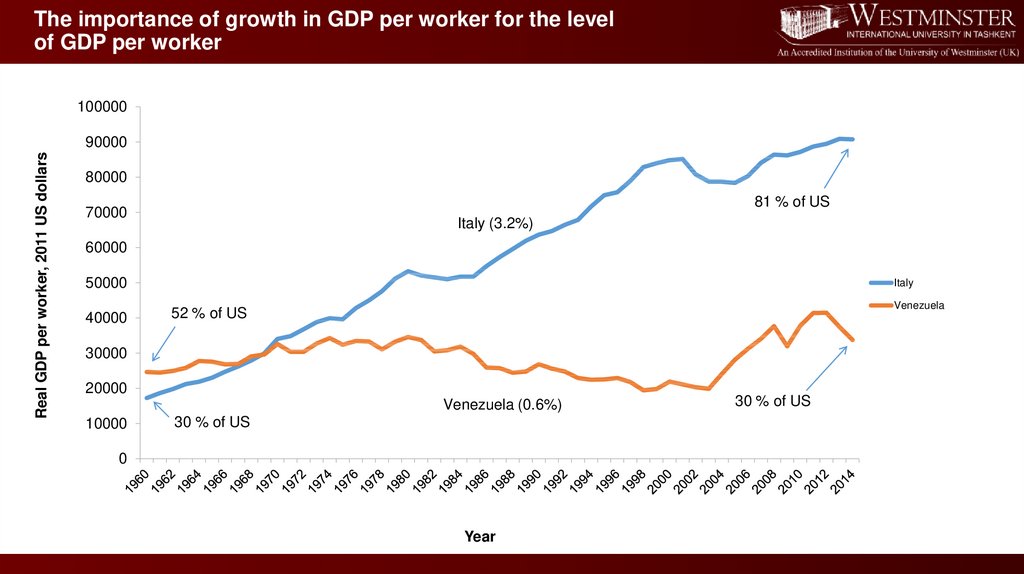
The importance of growth in GDP per worker for the levelof GDP per worker
100000
Real GDP per worker, 2011 US dollars
90000
80000
81 % of US
70000
Italy (3.2%)
60000
50000
40000
Italy
Venezuela
52 % of US
30000
20000
Venezuela (0.6%)
10000
30 % of US
0
Year
30 % of US
18.
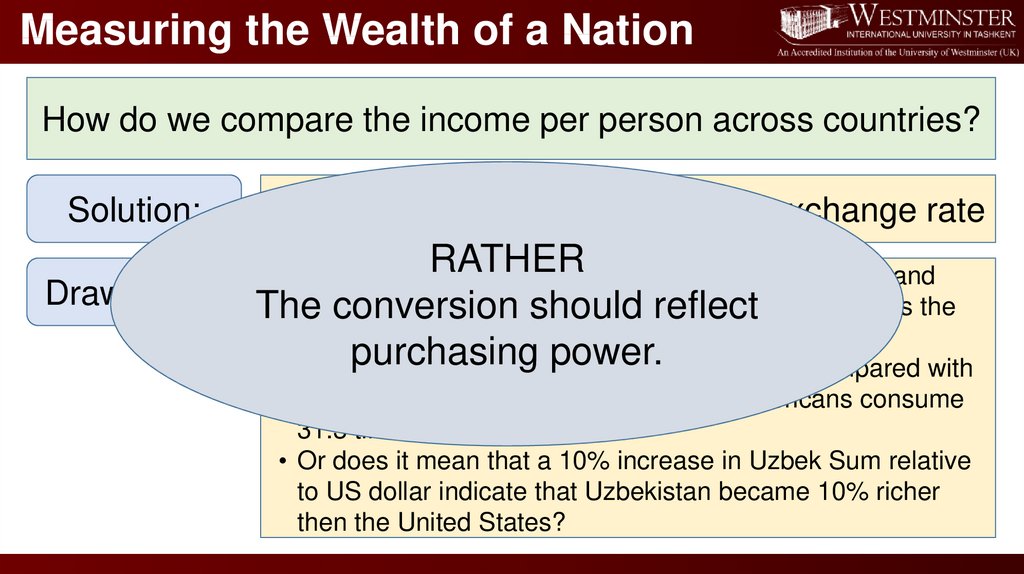
Measuring the Wealth of a NationHow do we compare the income per person across countries?
Solution:
Drawbacks:
Compare GDP per person using exchange rate
RATHER
• Exchange rates
vary a lot. E.g., the dollar increased and
then
decreased in the
1980’s byreflect
roughly 50% vis-à-vis the
The
conversion
should
currencies of the trading partners of the U.S.
purchasing
power.
• In 2011,
GDP per capita
in India was $1,529 compared with
$47,880 in the U.S. Does it mean that Americans consume
31.3 times more?
• Or does it mean that a 10% increase in Uzbek Sum relative
to US dollar indicate that Uzbekistan became 10% richer
then the United States?
19.
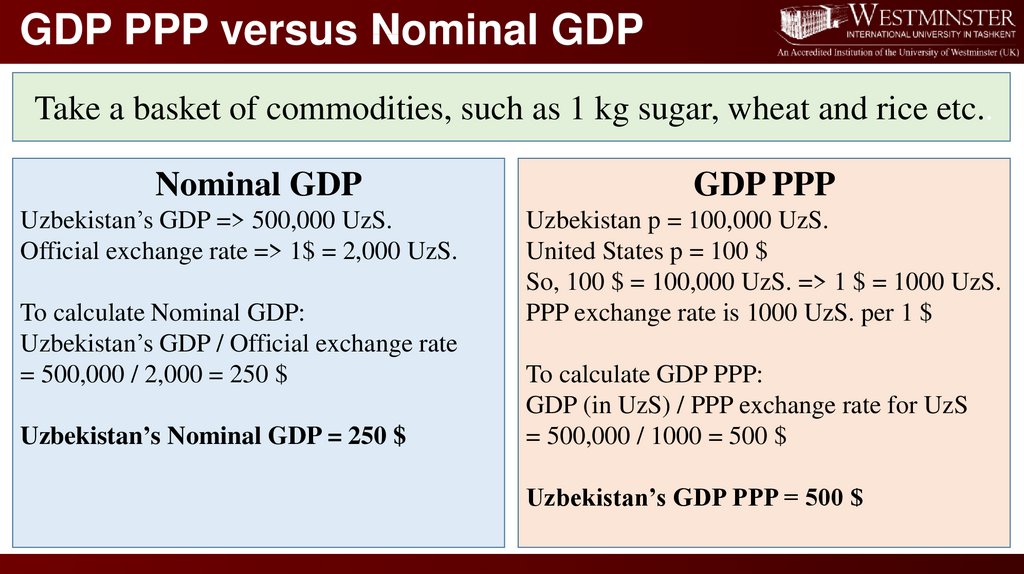
GDP PPP versus Nominal GDPTake a basket of commodities, such as 1 kg sugar, wheat and rice etc..
Nominal GDP
Uzbekistan’s GDP => 500,000 UzS.
Official exchange rate => 1$ = 2,000 UzS.
To calculate Nominal GDP:
Uzbekistan’s GDP / Official exchange rate
= 500,000 / 2,000 = 250 $
Uzbekistan’s Nominal GDP = 250 $
GDP PPP
Uzbekistan p = 100,000 UzS.
United States p = 100 $
So, 100 $ = 100,000 UzS. => 1 $ = 1000 UzS.
PPP exchange rate is 1000 UzS. per 1 $
To calculate GDP PPP:
GDP (in UzS) / PPP exchange rate for UzS
= 500,000 / 1000 = 500 $
Uzbekistan’s GDP PPP = 500 $
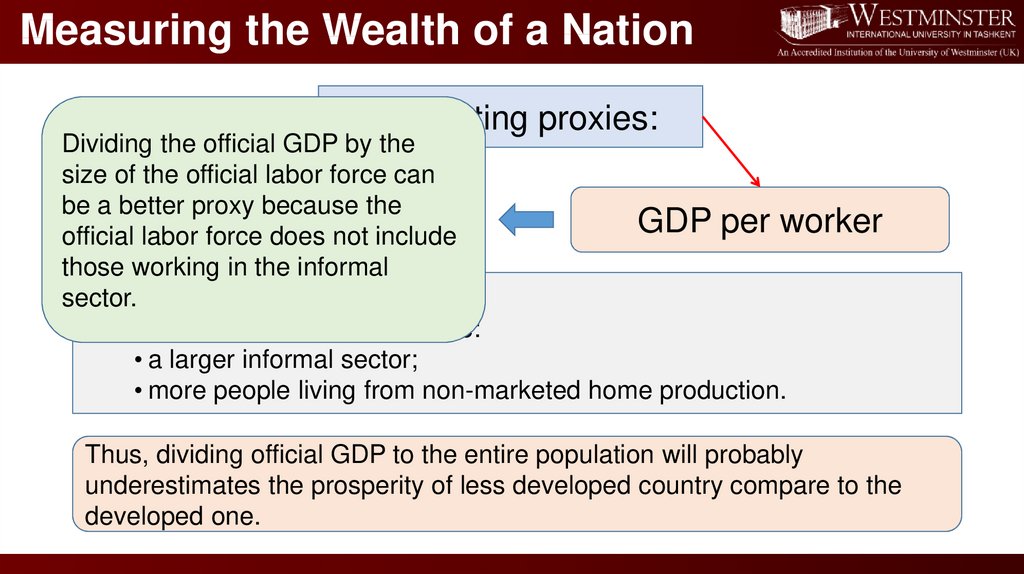
20.
Measuring the Wealth of a NationCompeting proxies:
Dividing the official GDP by the
size of the official labor force can
be a better proxy because the
GDPforce
perdoes
capita
GDP per worker
official labor
not include
those working in the informal
sector.
Some issues
Less developed countries have:
• a larger informal sector;
• more people living from non-marketed home production.
Thus, dividing official GDP to the entire population will probably
underestimates the prosperity of less developed country compare to the
developed one.
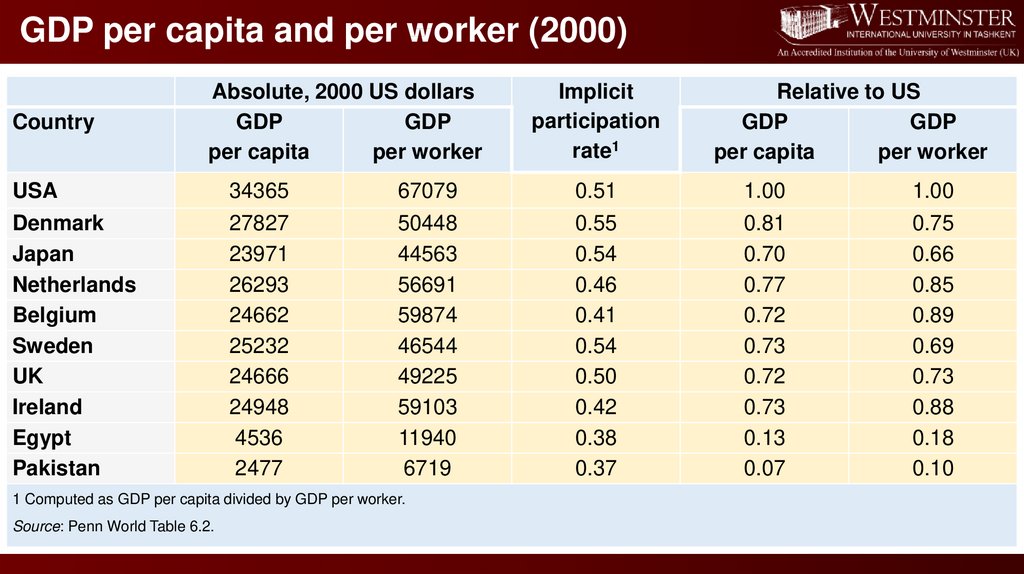
21.
GDP per capita and per worker (2000)Country
Absolute, 2000 US dollars
GDP
GDP
per capita
per worker
Implicit
participation
rate1
Relative to US
GDP
GDP
per capita
per worker
USA
34365
67079
0.51
1.00
1.00
Denmark
Japan
Netherlands
Belgium
Sweden
UK
Ireland
Egypt
Pakistan
27827
23971
26293
24662
25232
24666
24948
4536
2477
50448
44563
56691
59874
46544
49225
59103
11940
6719
0.55
0.54
0.46
0.41
0.54
0.50
0.42
0.38
0.37
0.81
0.70
0.77
0.72
0.73
0.72
0.73
0.13
0.07
0.75
0.66
0.85
0.89
0.69
0.73
0.88
0.18
0.10
1 Computed as GDP per capita divided by GDP per worker.
Source: Penn World Table 6.2.
22.
The rich and the poor,the growing and the declining
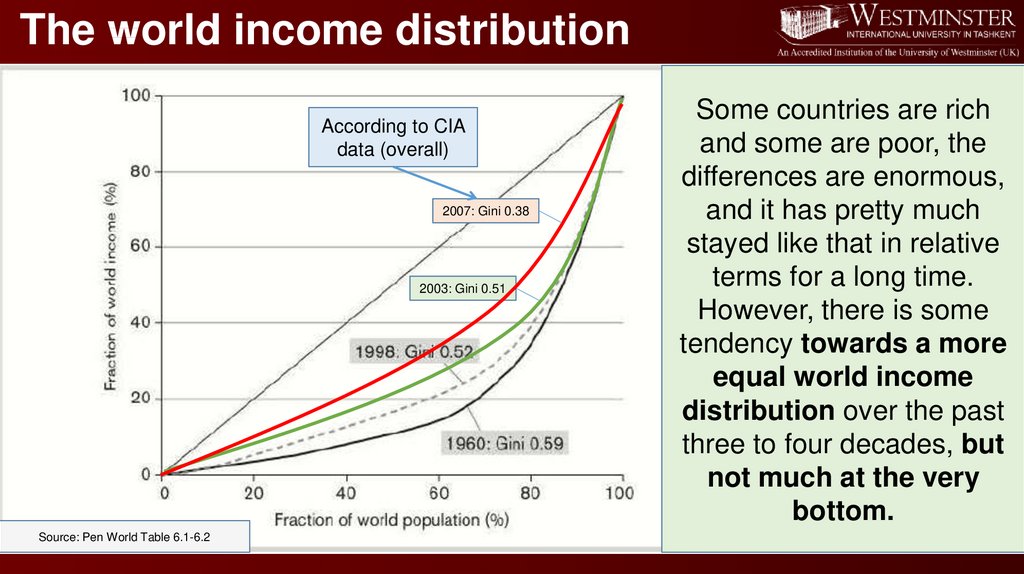
23.
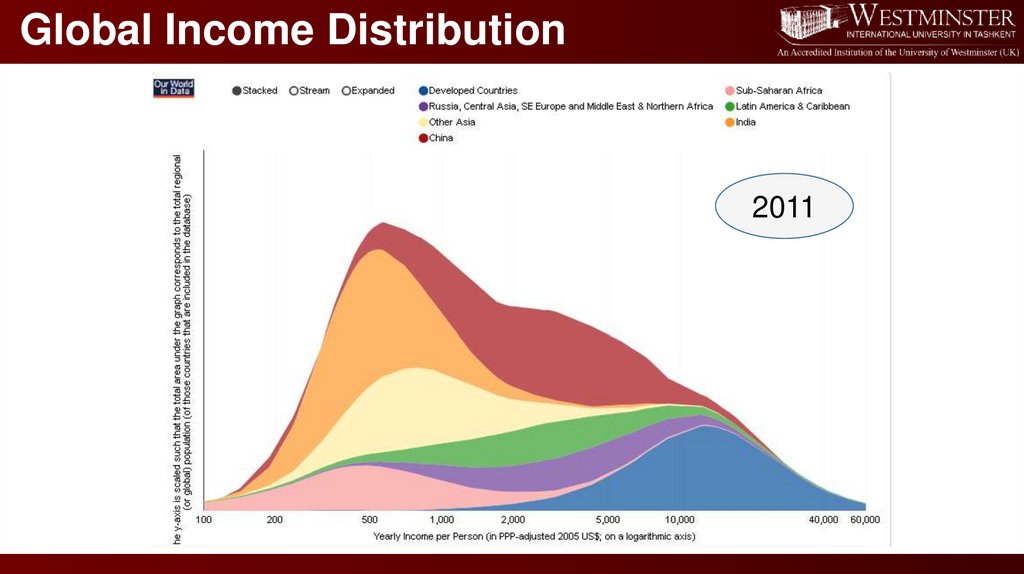
The world income distributionAccording to CIA
data (overall)
2007: Gini 0.38
2003: Gini 0.51
Source: Pen World Table 6.1-6.2
Some countries are rich
and some are poor, the
differences are enormous,
and it has pretty much
stayed like that in relative
terms for a long time.
However, there is some
tendency towards a more
equal world income
distribution over the past
three to four decades, but
not much at the very
bottom.
24.
Global Income Distribution1988
2011
25.
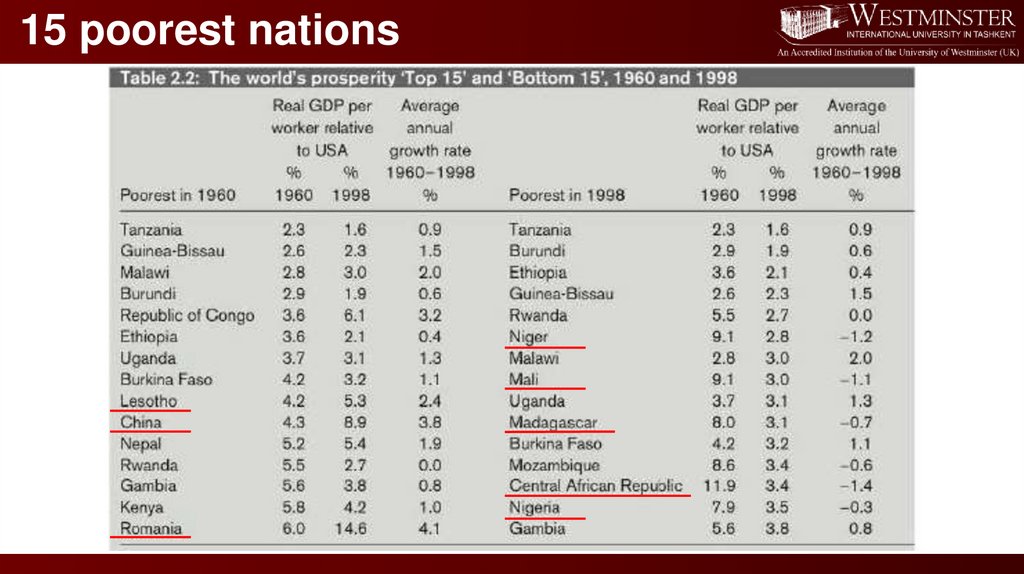
15 poorest nations26.
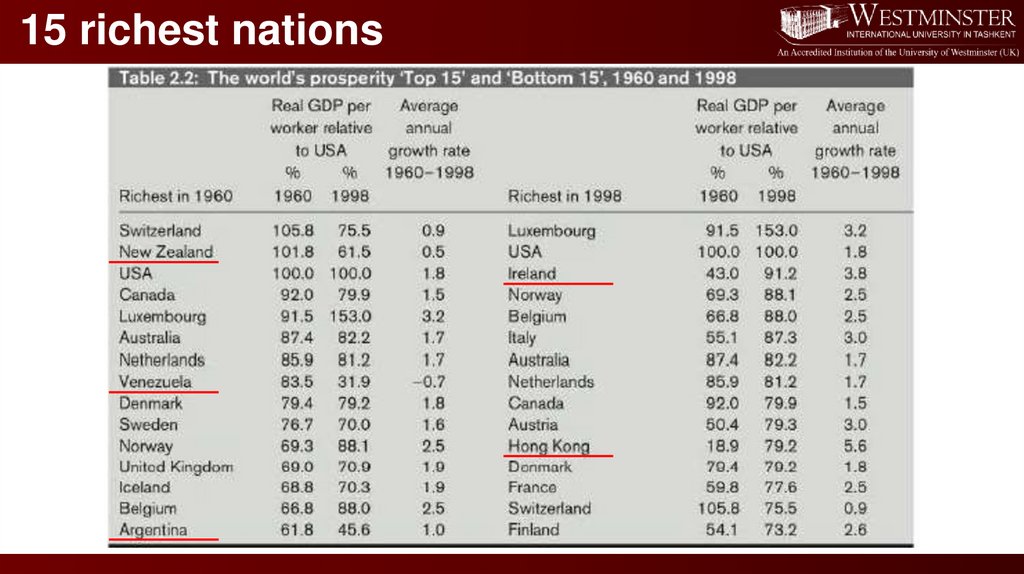
15 richest nations27.
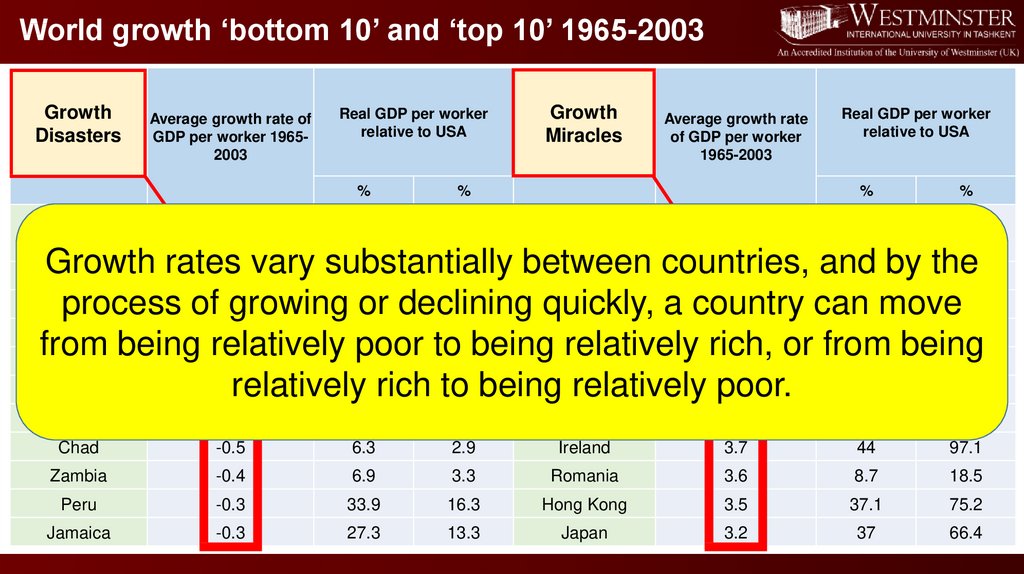
World growth ‘bottom 10’ and ‘top 10’ 1965-2003Growth
Disasters
10 slowest
growing
Average growth rate of
GDP per worker 19652003
%
Real GDP per worker
relative to USA
%
%
1965
2003
Growth
Miracles
Average growth rate
of GDP per worker
1965-2003
10 fastest
growing
%
Real GDP per worker
relative to USA
%
%
1965
2003
Growth rates
vary substantially
between
countries,
and
by the
-1.9
48.9
12.7
China
6.1
2.4
12.2
Jordan
16.8
South
Korea
5.2
13.4move
49.8
process of-1.3growing50.8
or declining
quickly,
a country
can
Venezuela
-1.2
63.5
21.9
Thailand
4.2
6.9
18
from being relatively
poor to2.3beingMalaysia
relatively rich,
or from
being
Madagascar
-1.1
6.5
4
16.9
41.2
Niger
-0.9
2.7 beingGhana
3.8
1.9
4.2
relatively6.8rich to
relatively poor.
Nicaragua
Togo
-0.6
6.2
2.7
Singapore
3.8
35.7
80
Chad
-0.5
6.3
2.9
Ireland
3.7
44
97.1
Zambia
-0.4
6.9
3.3
Romania
3.6
8.7
18.5
Peru
-0.3
33.9
16.3
Hong Kong
3.5
37.1
75.2
Jamaica
-0.3
27.3
13.3
Japan
3.2
37
66.4
28.
QuizWhat do you think?
What are the main reasons for some sub-Saharan and
Middle East countries not being able to grow over time?
29.
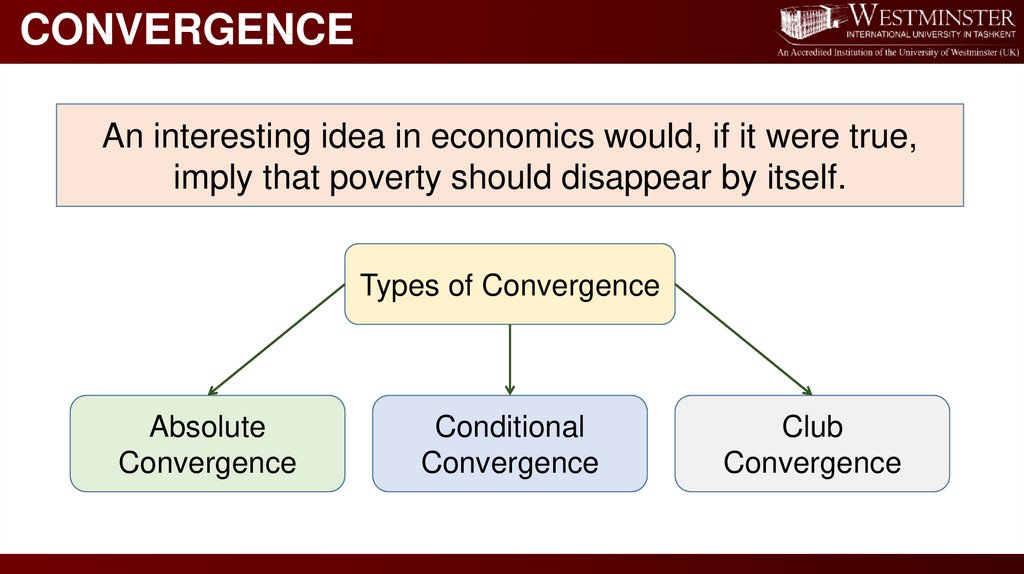
CONVERGENCEAn interesting idea in economics would, if it were true,
imply that poverty should disappear by itself.
Types of Convergence
Absolute
Convergence
Conditional
Convergence
Club
Convergence
30.
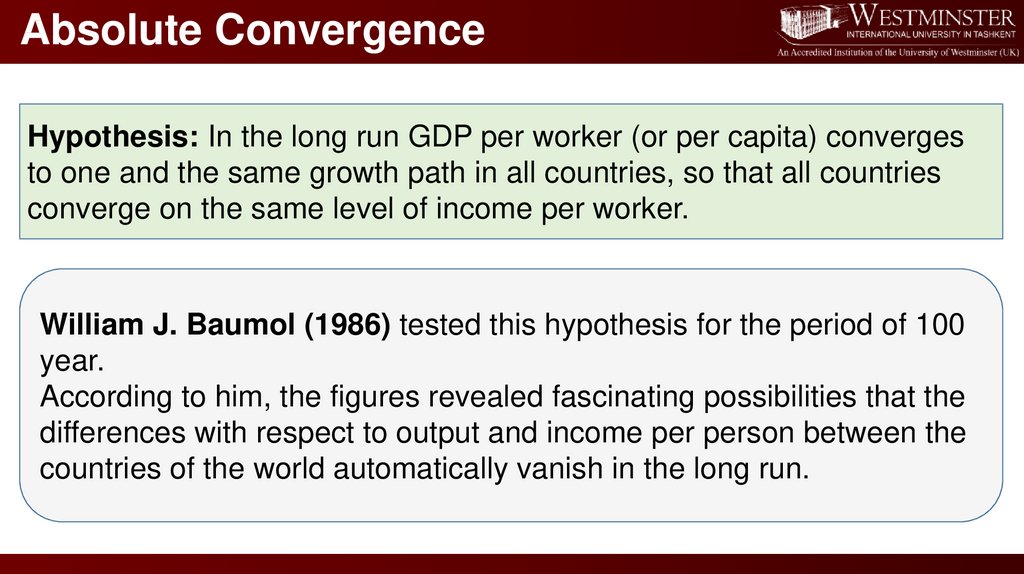
Absolute ConvergenceHypothesis: In the long run GDP per worker (or per capita) converges
to one and the same growth path in all countries, so that all countries
converge on the same level of income per worker.
William J. Baumol (1986) tested this hypothesis for the period of 100
year.
According to him, the figures revealed fascinating possibilities that the
differences with respect to output and income per person between the
countries of the world automatically vanish in the long run.
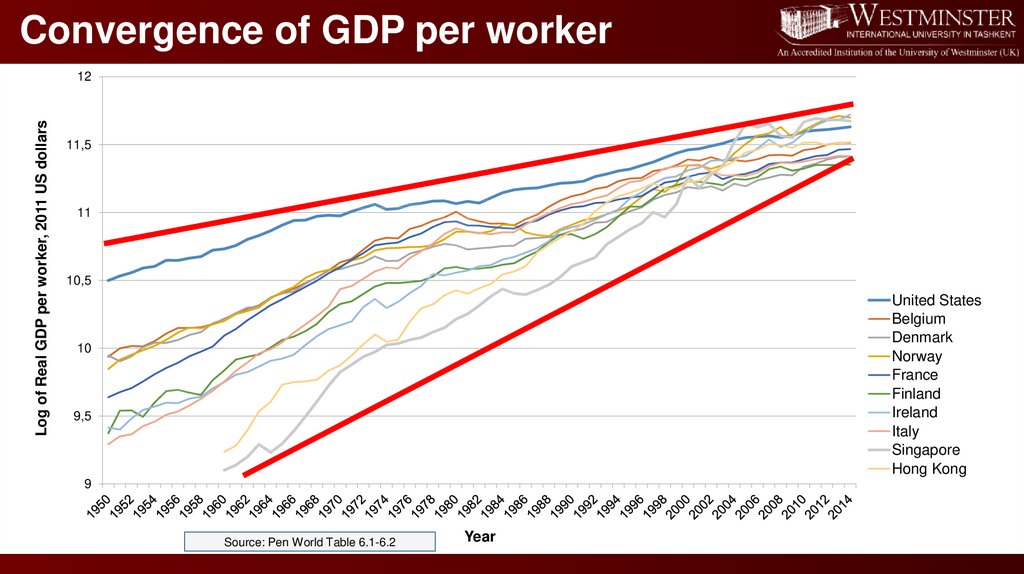
31.
Convergence of GDP per workerLog of Real GDP per worker, 2011 US dollars
12
11,5
11
10,5
United States
Belgium
Denmark
Norway
France
Finland
Ireland
Italy
Singapore
Hong Kong
10
9,5
9
Source: Pen World Table 6.1-6.2
Year
32.
Foreign AidAs you witnessed from the graph, if the
poverty disappears by itself, doesn’t it
make foreign aid less necessary for poor
countries?
33.
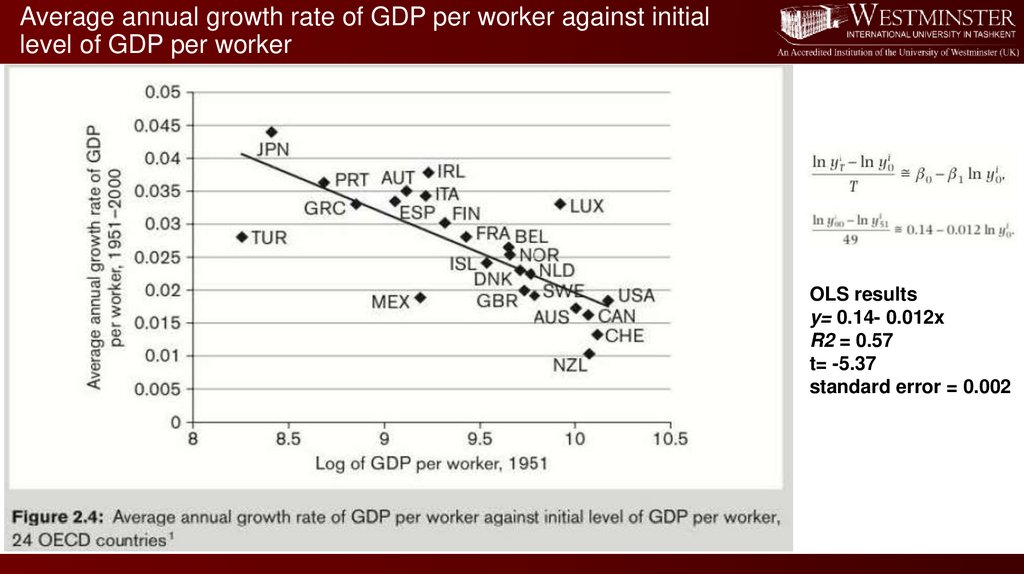
Absolute ConvergenceThe hypothesis of absolute
convergence implies that countries
with relatively low levels of GDP per
worker in an initial year will grow
relatively fast after that initial year.
In other words, average growth in GDP per worker from year 0 to year
T. say, should be negatively correlated with GDP per worker in year 0 .
34.
Average annual growth rate of GDP per worker against initiallevel of GDP per worker
OLS results
y= 0.14- 0.012x
R2 = 0.57
t= -5.37
standard error = 0.002
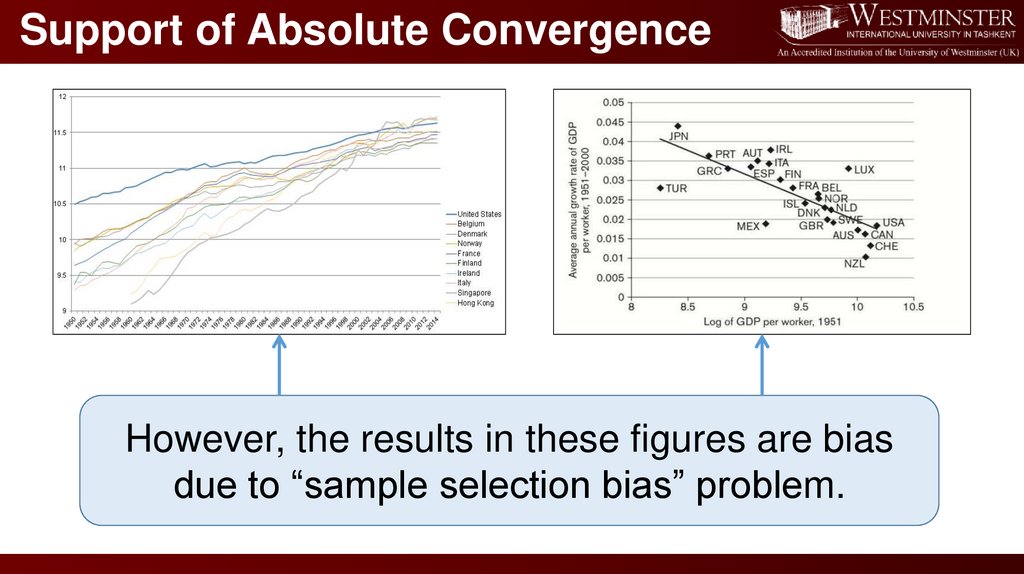
35.
Support of Absolute ConvergenceHowever, the results in these figures are bias
due to “sample selection bias” problem.
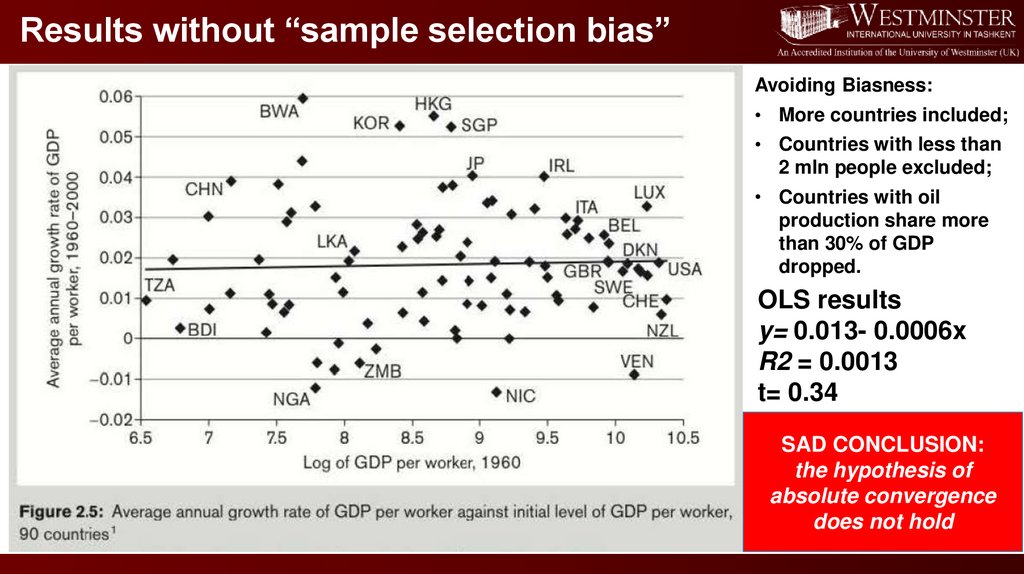
36.
Results without “sample selection bias”Avoiding Biasness:
• More countries included;
• Countries with less than
2 mln people excluded;
• Countries with oil
production share more
than 30% of GDP
dropped.
OLS results
y= 0.013- 0.0006x
R2 = 0.0013
t= 0.34
SAD CONCLUSION:
the hypothesis of
absolute convergence
does not hold
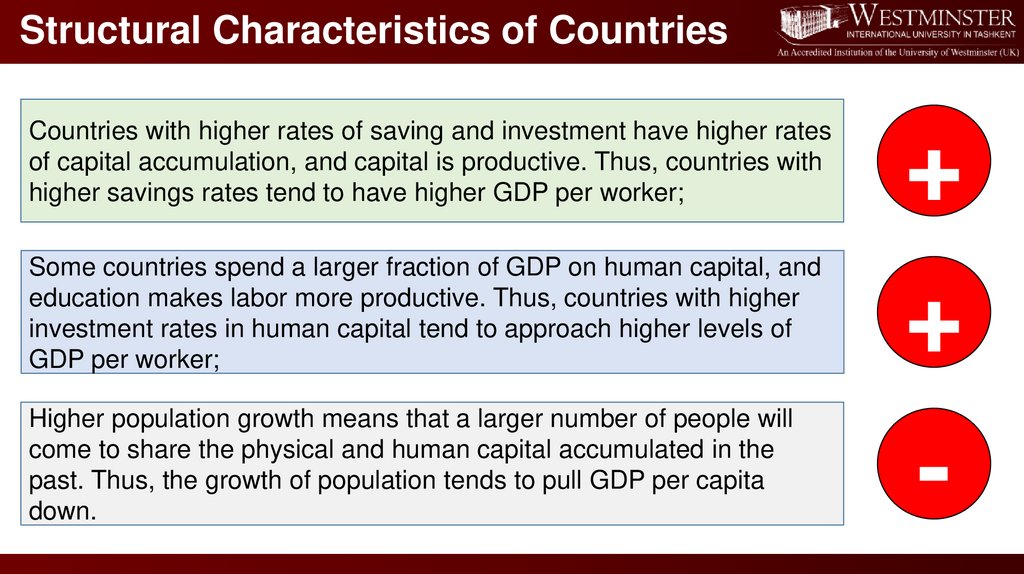
37.
Structural Characteristics of CountriesCountries with higher rates of saving and investment have higher rates
of capital accumulation, and capital is productive. Thus, countries with
higher savings rates tend to have higher GDP per worker;
Some countries spend a larger fraction of GDP on human capital, and
education makes labor more productive. Thus, countries with higher
investment rates in human capital tend to approach higher levels of
GDP per worker;
Higher population growth means that a larger number of people will
come to share the physical and human capital accumulated in the
past. Thus, the growth of population tends to pull GDP per capita
down.
+
+
-
38.
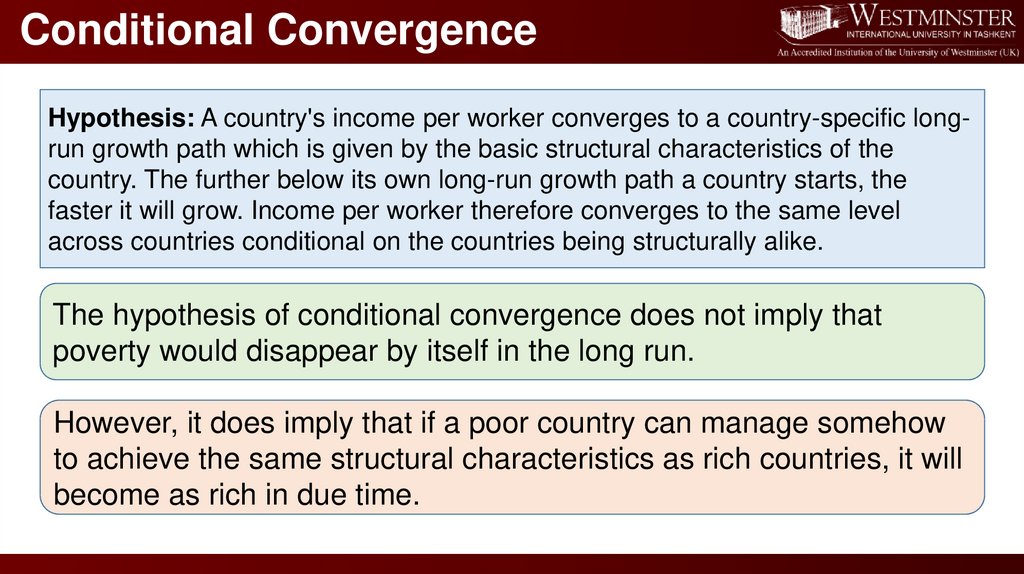
Conditional ConvergenceHypothesis: A country's income per worker converges to a country-specific longrun growth path which is given by the basic structural characteristics of the
country. The further below its own long-run growth path a country starts, the
faster it will grow. Income per worker therefore converges to the same level
across countries conditional on the countries being structurally alike.
The hypothesis of conditional convergence does not imply that
poverty would disappear by itself in the long run.
However, it does imply that if a poor country can manage somehow
to achieve the same structural characteristics as rich countries, it will
become as rich in due time.
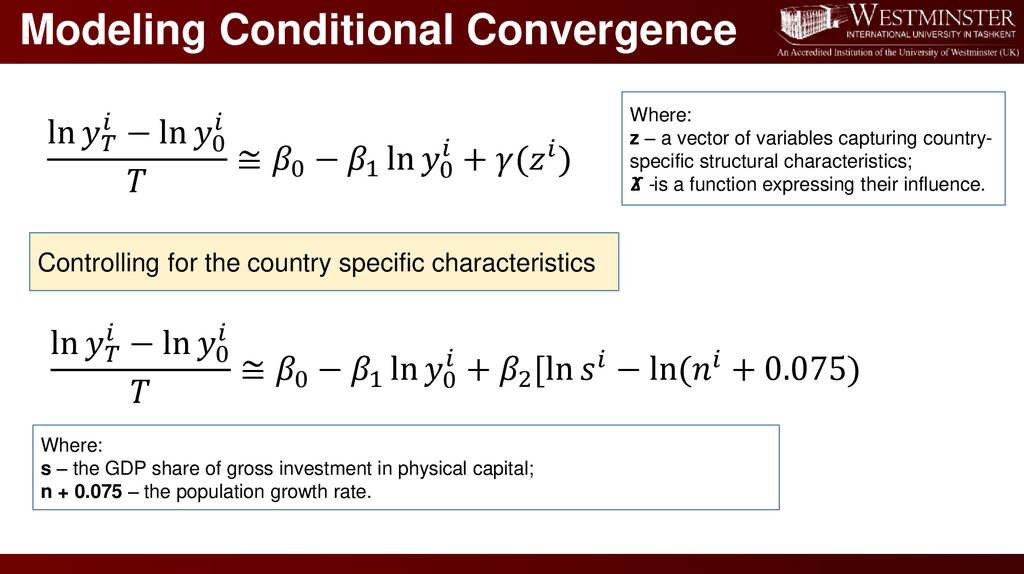
39.
Modeling Conditional Convergenceln