


 software
Similar presentations:


 in MS power bi. DAX functions")


")

Microsoft Office Excel 2013 Expert
1.
Microsoft OfficeExcel 2013 Expert
Lesson 6 & 7 Introduction to MS Excel
1
2.
Microsoft OfficeExcel 2013 Expert
Learning Outcomes
• On completion of this topics, students will understand
the following topics:
i. Introduction to Microsoft Excel
ii. Entering and Editing Data
iii. Understanding Workbooks
iv. Basic Editing Features
v. Formatting Features
vi. Using Formulas and Functions
vii. Printing Functions
viii. Multiple Worksheets
ix. Working with Charts
2
3.
Microsoft OfficeExcel 2013 Expert
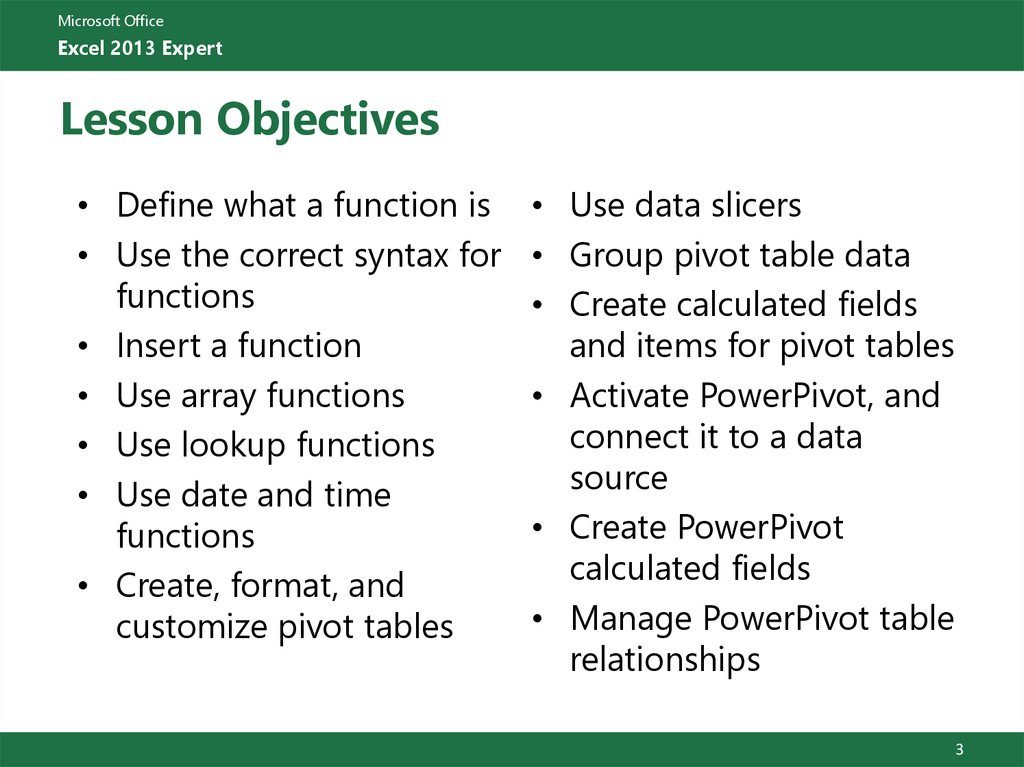
Lesson Objectives
• Define what a function is
• Use the correct syntax for
functions
• Insert a function
• Use array functions
• Use lookup functions
• Use date and time
functions
• Create, format, and
customize pivot tables
• Use data slicers
• Group pivot table data
• Create calculated fields
and items for pivot tables
• Activate PowerPivot, and
connect it to a data
source
• Create PowerPivot
calculated fields
• Manage PowerPivot table
relationships
3
4.
Microsoft OfficeExcel 2013 Expert
What new features exist in Excel 2013?
Like all of the applications within Office 2013, Excel
introduces several new features for the end user.
1. Quick Analysis tool.
Instant Data Analysis
Incorporates “Live Preview”
“Recommended Charts”
Chart Elements, Chart Styles, and Chart Filters
buttons.
2. Flash Fill.
3. Videos.
4
5.
Microsoft OfficeExcel 2013 Expert
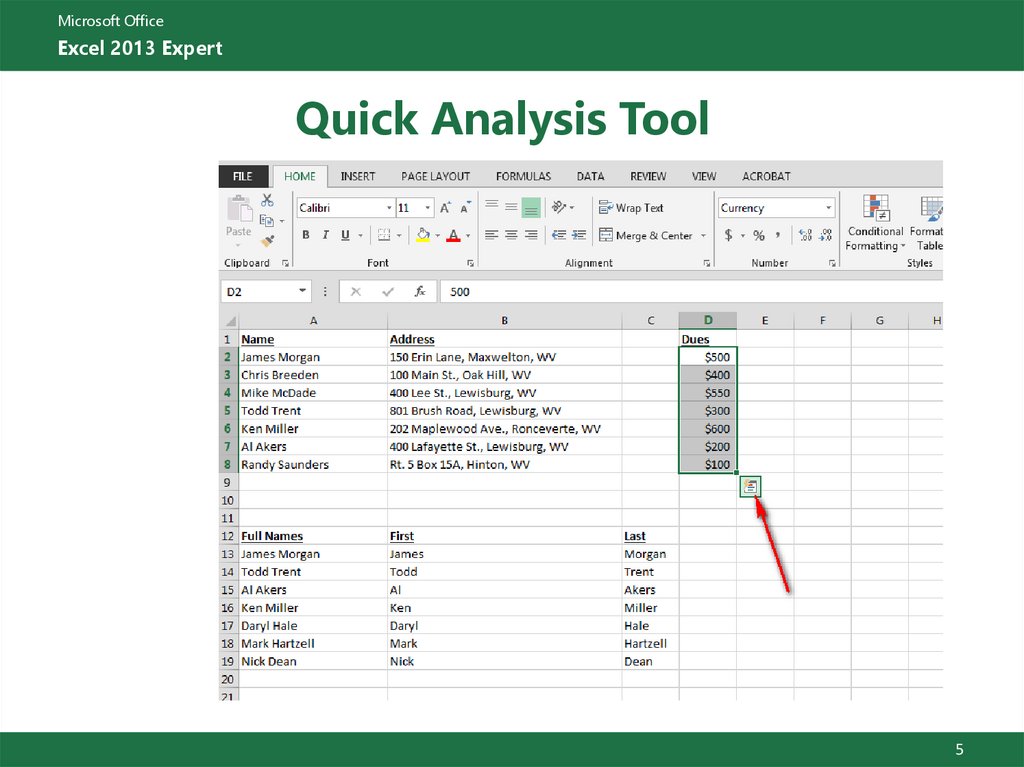
Quick Analysis Tool
5
6.
Microsoft OfficeExcel 2013 Expert
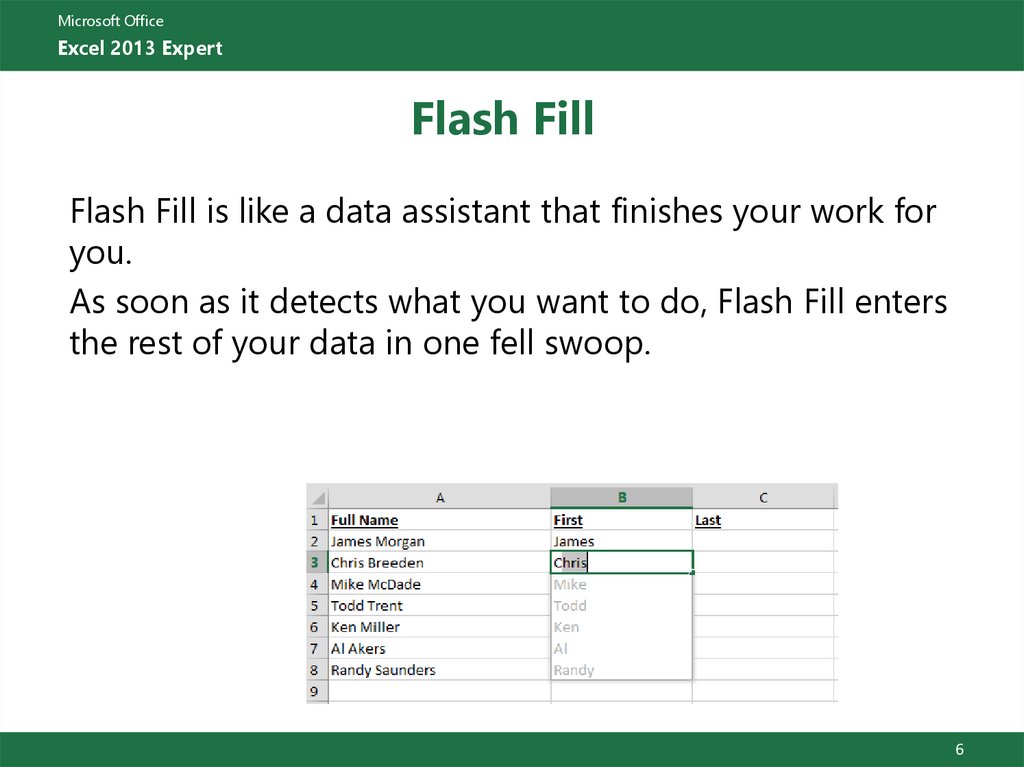
Flash Fill
Flash Fill is like a data assistant that finishes your work for
you.
As soon as it detects what you want to do, Flash Fill enters
the rest of your data in one fell swoop.
6
7.
Microsoft OfficeExcel 2013 Expert
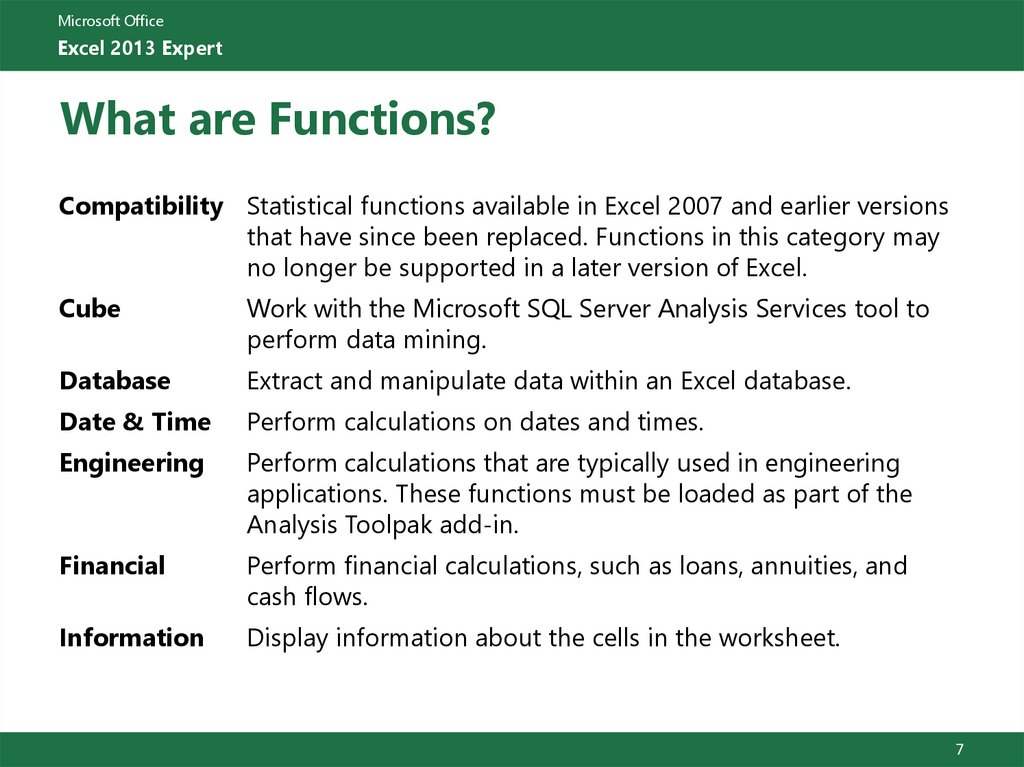
What are Functions?
Compatibility Statistical functions available in Excel 2007 and earlier versions
that have since been replaced. Functions in this category may
no longer be supported in a later version of Excel.
Cube
Work with the Microsoft SQL Server Analysis Services tool to
perform data mining.
Database
Extract and manipulate data within an Excel database.
Date & Time
Perform calculations on dates and times.
Engineering
Perform calculations that are typically used in engineering
applications. These functions must be loaded as part of the
Analysis Toolpak add-in.
Financial
Perform financial calculations, such as loans, annuities, and
cash flows.
Information
Display information about the cells in the worksheet.
7
8.
Microsoft OfficeExcel 2013 Expert
What are Functions?
Logical
Control the actions of the spreadsheet based on evaluations of
data in the spreadsheet.
Lookup &
Reference
Locate information in tables or on the Internet.
Math &
Trigonometry
Perform mathematical and trigonometric calculations, such as
logarithms, cosine, and rounding.
Statistical
Perform statistical evaluations, such as average, mean, and
standard deviation.
Text
Manipulate text strings and convert numbers and text.
Web
Exchange data with other systems located on the Internet or in
the local network using web functionality.
8
9.
Microsoft OfficeExcel 2013 Expert
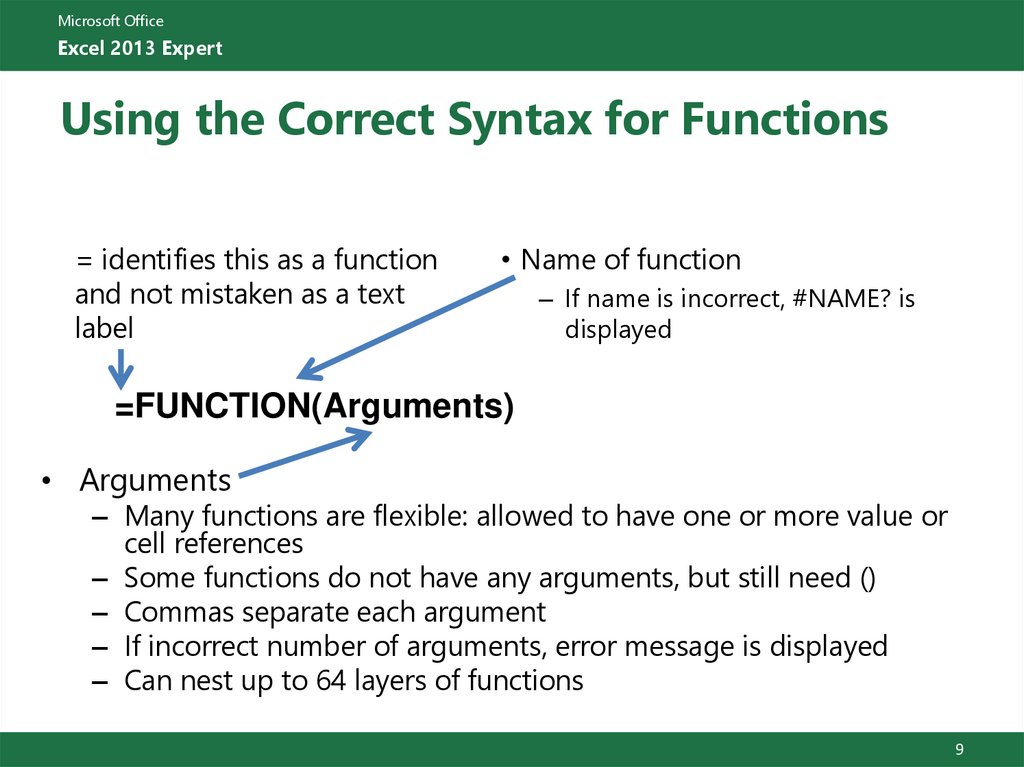
Using the Correct Syntax for Functions
= identifies this as a function
and not mistaken as a text
label
• Name of function
– If name is incorrect, #NAME? is
displayed
=FUNCTION(Arguments)
• Arguments
– Many functions are flexible: allowed to have one or more value or
cell references
– Some functions do not have any arguments, but still need ()
– Commas separate each argument
– If incorrect number of arguments, error message is displayed
– Can nest up to 64 layers of functions
9
10.
Microsoft OfficeExcel 2013 Expert
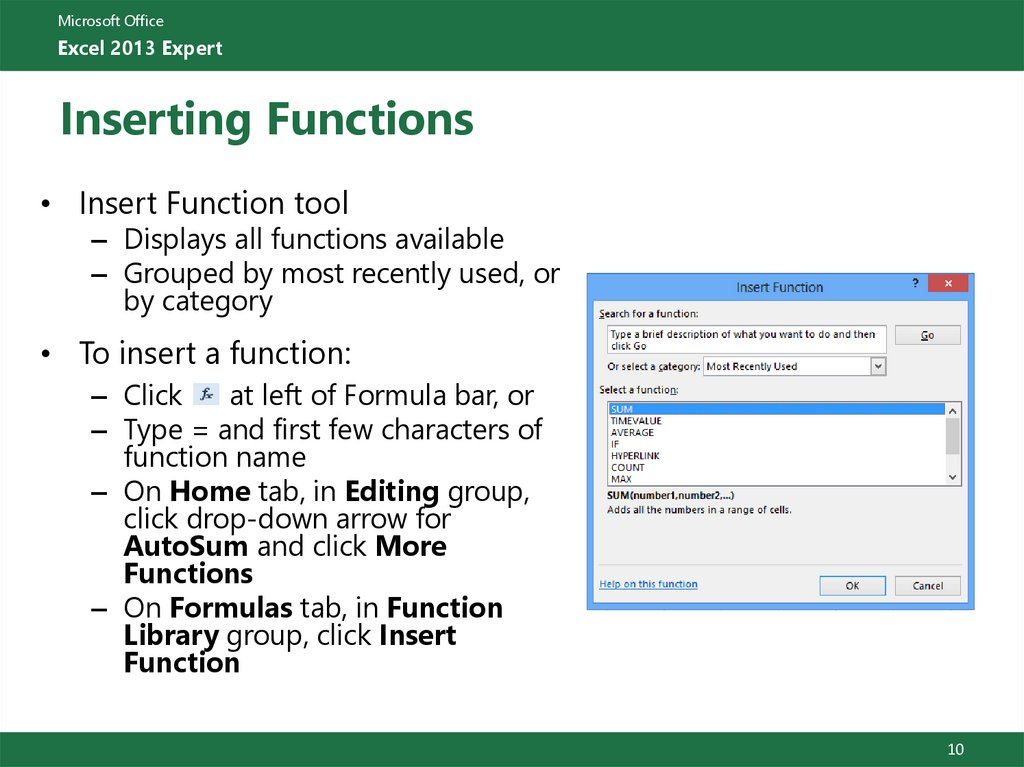
Inserting Functions
• Insert Function tool
– Displays all functions available
– Grouped by most recently used, or
by category
• To insert a function:
– Click
at left of Formula bar, or
– Type = and first few characters of
function name
– On Home tab, in Editing group,
click drop-down arrow for
AutoSum and click More
Functions
– On Formulas tab, in Function
Library group, click Insert
Function
10
11.
Microsoft OfficeExcel 2013 Expert
Inserting Functions
• Function Arguments dialog box
– Helps you enter all of the correct
values as function arguments
– Each argument is listed, required
ones are in bold
– Help info displayed for current
argument text box
– Preview of data at right
– Results are instantly calculated and displayed if enough arguments
entered
• Function arguments dialog box shrinks temporarily using collapse
button
– Restores to full size when done
11
12.
Microsoft OfficeExcel 2013 Expert
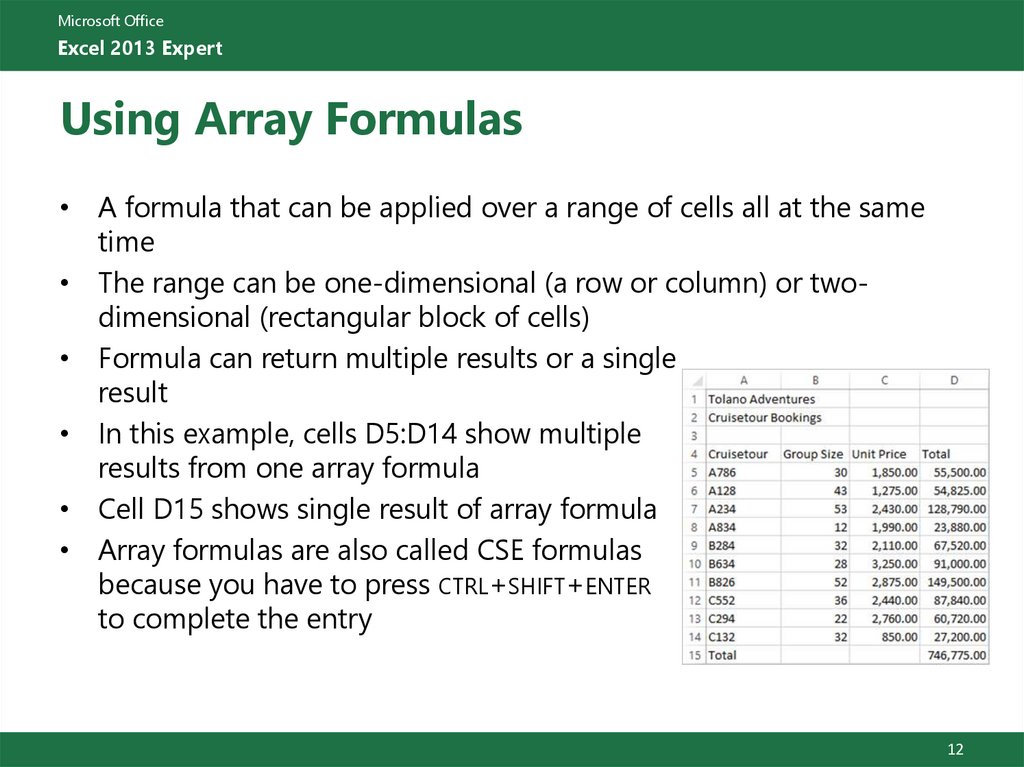
Using Array Formulas
• A formula that can be applied over a range of cells all at the same
time
• The range can be one-dimensional (a row or column) or twodimensional (rectangular block of cells)
• Formula can return multiple results or a single
result
• In this example, cells D5:D14 show multiple
results from one array formula
• Cell D15 shows single result of array formula
• Array formulas are also called CSE formulas
because you have to press CTRL+SHIFT+ENTER
to complete the entry
12
13.
Microsoft OfficeExcel 2013 Expert
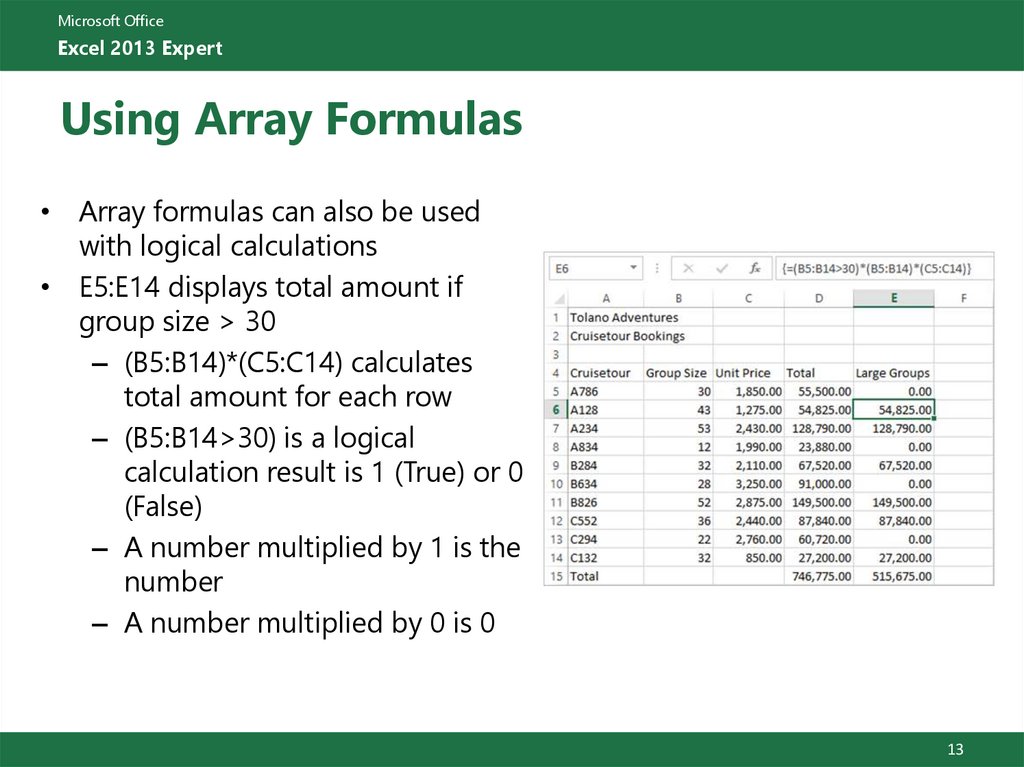
Using Array Formulas
• Array formulas can also be used
with logical calculations
• E5:E14 displays total amount if
group size > 30
– (B5:B14)*(C5:C14) calculates
total amount for each row
– (B5:B14>30) is a logical
calculation result is 1 (True) or 0
(False)
– A number multiplied by 1 is the
number
– A number multiplied by 0 is 0
13
14.
Microsoft OfficeExcel 2013 Expert
Using Lookup Functions
• Find information in lists or arrays using:
– Known value
– Index number for 1- or 2-dimensional list
– First row or column of 2-dimensional array
– Table array must be sorted
14
15.
Microsoft OfficeExcel 2013 Expert
CHOOSE Function
• Select from a simple one-dimensional list of values
=CHOOSE(A1,C10,C9,C8,C7)
• If cell A1 = 3, C10 = 10, C9 = 20, C8 = 30, and C7 = 40
then 30 will be displayed
15
16.
Microsoft OfficeExcel 2013 Expert
INDEX Function
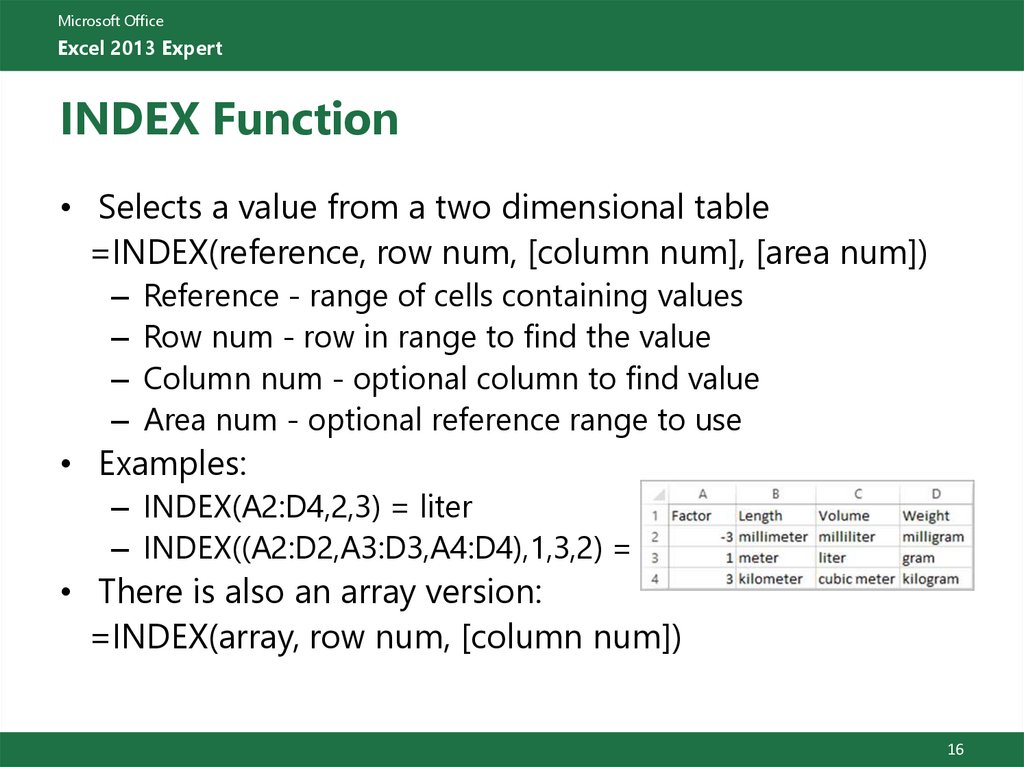
• Selects a value from a two dimensional table
=INDEX(reference, row num, [column num], [area num])
– Reference - range of cells containing values
– Row num - row in range to find the value
– Column num - optional column to find value
– Area num - optional reference range to use
• Examples:
– INDEX(A2:D4,2,3) = liter
– INDEX((A2:D2,A3:D3,A4:D4),1,3,2) = liter
• There is also an array version:
=INDEX(array, row num, [column num])
16
17.
Microsoft OfficeExcel 2013 Expert
LOOKUP Function
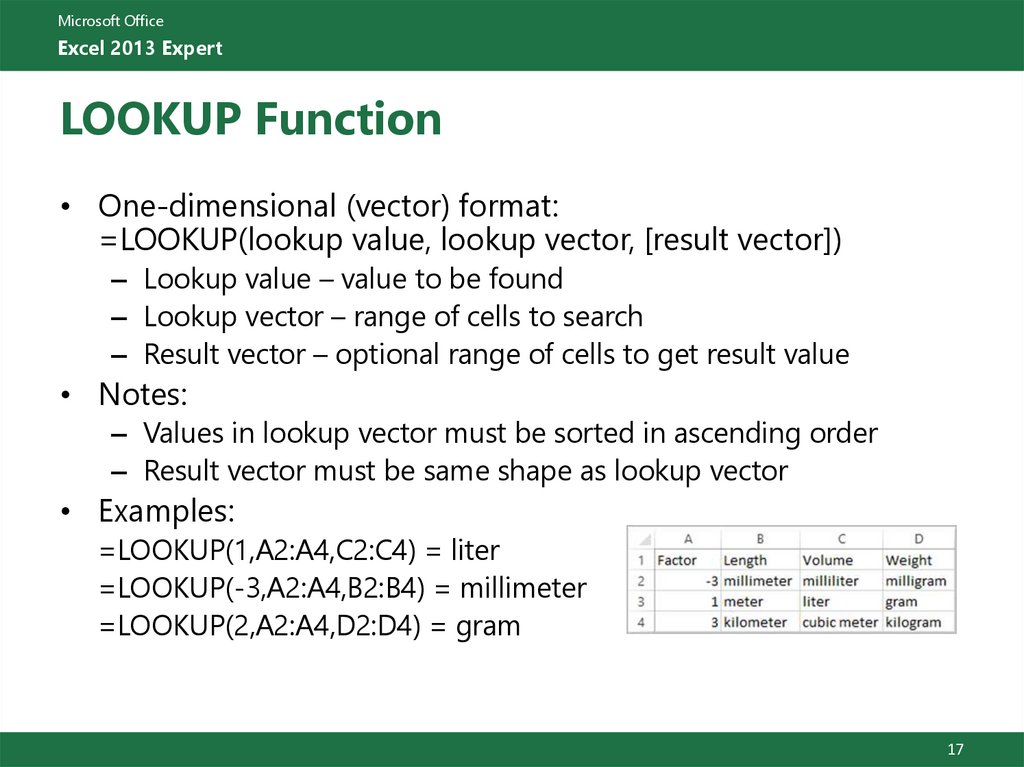
• One-dimensional (vector) format:
=LOOKUP(lookup value, lookup vector, [result vector])
– Lookup value – value to be found
– Lookup vector – range of cells to search
– Result vector – optional range of cells to get result value
• Notes:
– Values in lookup vector must be sorted in ascending order
– Result vector must be same shape as lookup vector
• Examples:
=LOOKUP(1,A2:A4,C2:C4) = liter
=LOOKUP(-3,A2:A4,B2:B4) = millimeter
=LOOKUP(2,A2:A4,D2:D4) = gram
17
18.
Microsoft OfficeExcel 2013 Expert
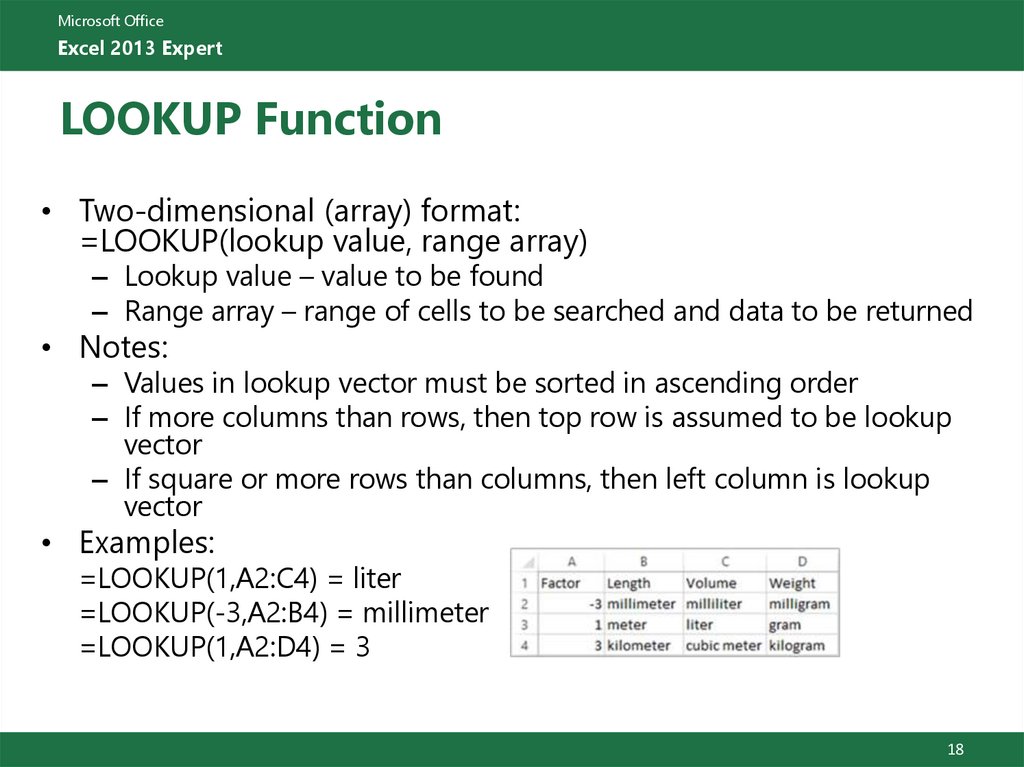
LOOKUP Function
• Two-dimensional (array) format:
=LOOKUP(lookup value, range array)
– Lookup value – value to be found
– Range array – range of cells to be searched and data to be returned
• Notes:
– Values in lookup vector must be sorted in ascending order
– If more columns than rows, then top row is assumed to be lookup
vector
– If square or more rows than columns, then left column is lookup
vector
• Examples:
=LOOKUP(1,A2:C4) = liter
=LOOKUP(-3,A2:B4) = millimeter
=LOOKUP(1,A2:D4) = 3
18
19.
Microsoft OfficeExcel 2013 Expert
HLOOKUP and VLOOKUP Functions
• Search for a lookup value in the first column of a two-dimensional array:
=VLOOKUP(lookup value,table array,column index number,range lookup)
– Lookup value – value to be found
– Table array – range of cells to be searched and data to be returned
– Column index – column containing value to be returned
– Range lookup – “0” or “false” for exact match, “1” or “true” for
approximate
• Range lookup value is optional, but important
– Example: if range lookup is “true”, then a student
with mark of 65% will receive correct grade of “C”
– If range lookup is “false”, the correct grade will not
be found
19
20.
Microsoft OfficeExcel 2013 Expert
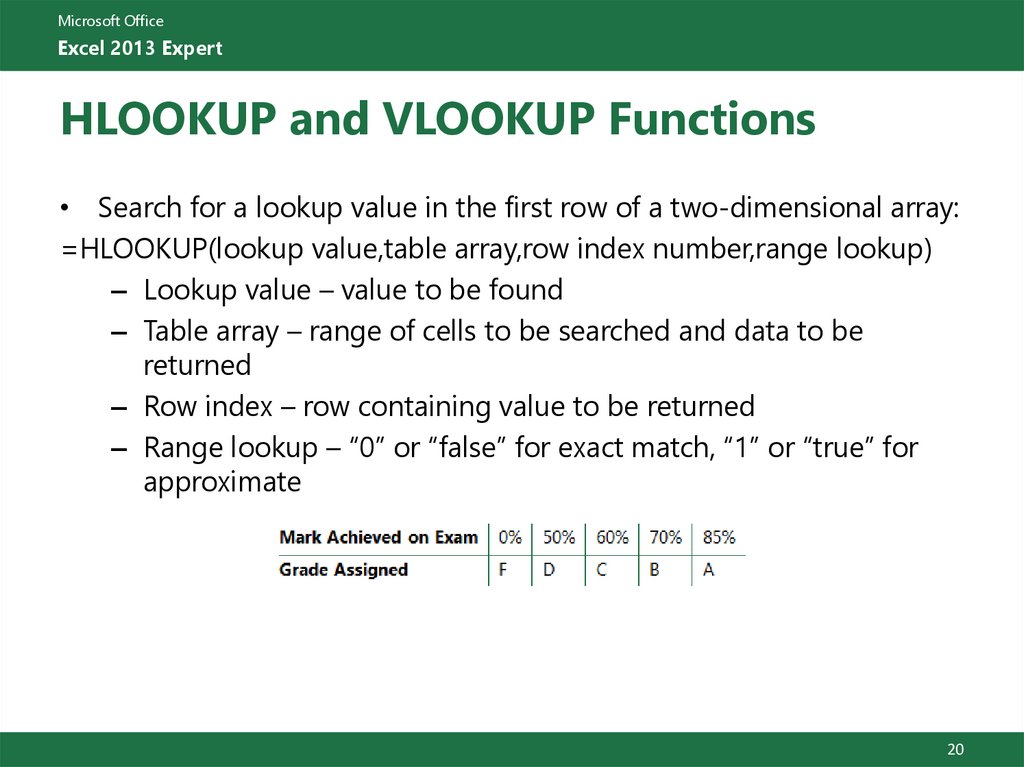
HLOOKUP and VLOOKUP Functions
• Search for a lookup value in the first row of a two-dimensional array:
=HLOOKUP(lookup value,table array,row index number,range lookup)
– Lookup value – value to be found
– Table array – range of cells to be searched and data to be
returned
– Row index – row containing value to be returned
– Range lookup – “0” or “false” for exact match, “1” or “true” for
approximate
20
21.
Microsoft OfficeExcel 2013 Expert
Using Date and Time Functions
• Date and time values are just numbers
– Integer portion being number of days since January 1, 1900
– Fractional part is portion of 24 hours
• Special functions
– Determine date and time serial numbers
– Extract month, day, year, hours, minutes and second values
from serial numbers
• Format:
=DATE(YEAR,MONTH,DAY)
=TIME(HOUR,MINUTE,SECOND)
• Press CTRL+SEMICOLON to display current date
• Press CTRL+SHIFT+SEMICOLON to display current time
21
22.
Microsoft OfficeExcel 2013 Expert
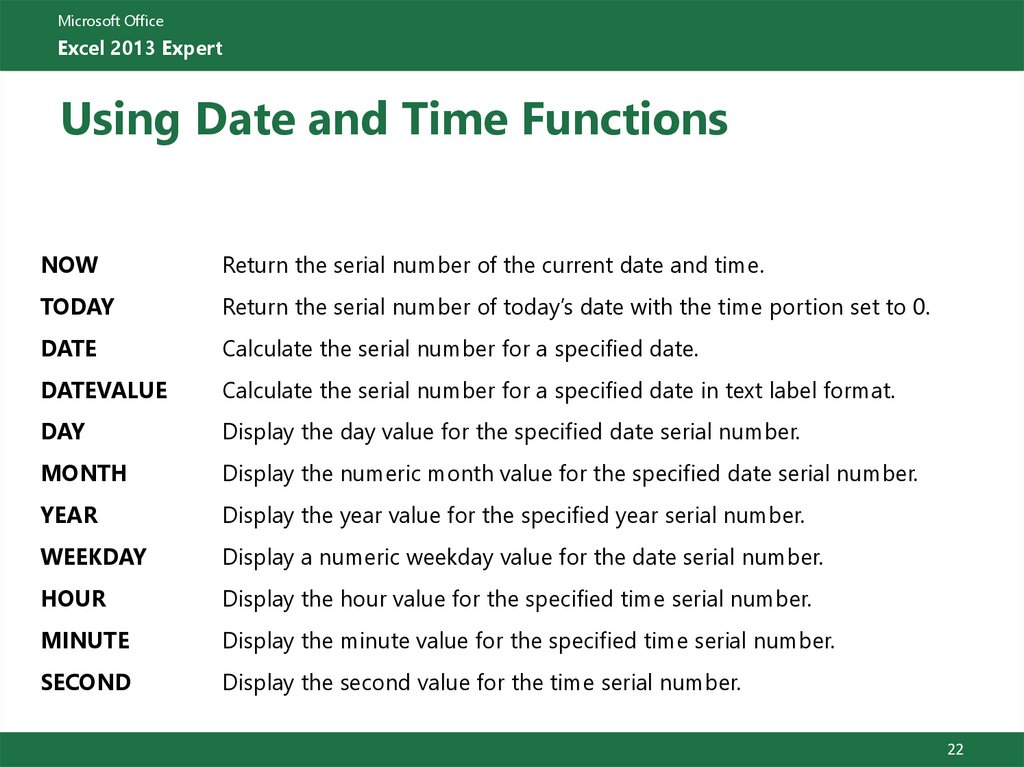
Using Date and Time Functions
NOW
Return the serial number of the current date and time.
TODAY
Return the serial number of today’s date with the time portion set to 0.
DATE
Calculate the serial number for a specified date.
DATEVALUE
Calculate the serial number for a specified date in text label format.
DAY
Display the day value for the specified date serial number.
MONTH
Display the numeric month value for the specified date serial number.
YEAR
Display the year value for the specified year serial number.
WEEKDAY
Display a numeric weekday value for the date serial number.
HOUR
Display the hour value for the specified time serial number.
MINUTE
Display the minute value for the specified time serial number.
SECOND
Display the second value for the time serial number.
22
23.
Microsoft OfficeExcel 2013 Expert
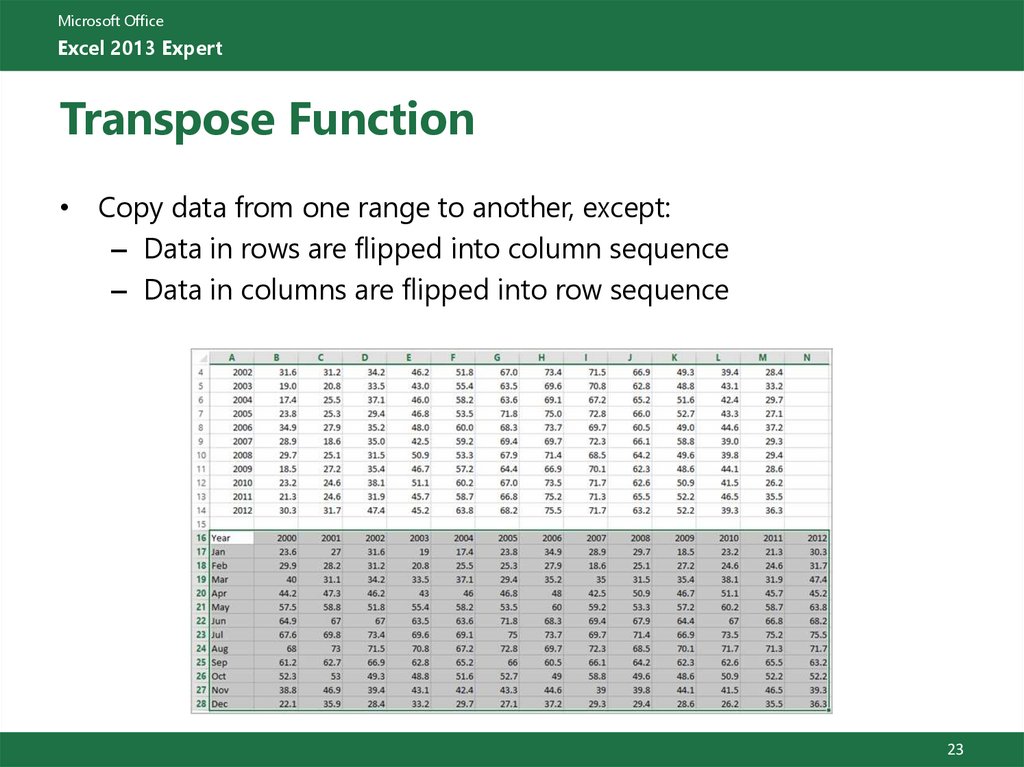
Transpose Function
• Copy data from one range to another, except:
– Data in rows are flipped into column sequence
– Data in columns are flipped into row sequence
23
24.
Microsoft OfficeExcel 2013 Expert
Creating and Managing Pivot Tables
• Summarizes or cross-tabulates large amounts of data using
fields
• Performs summary function on intersections of row and
column fields
• Frequently used to analyze large volumes of data
– Usually found in corporate databases
• Strength of pivot tables based on same values that show up
many times in many data records:
– By pairing these repeating values in different combinations, you
will find underlying trends that were not obvious
– Key is making the data values as row or column headers in
different ways
24
25.
Microsoft OfficeExcel 2013 Expert
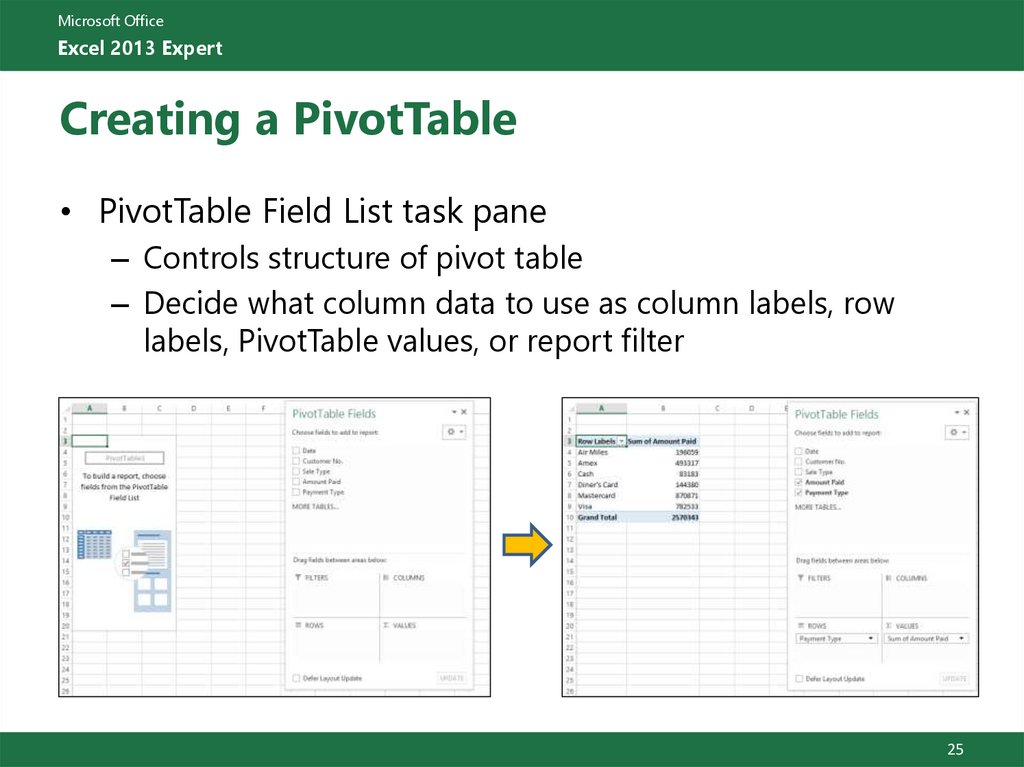
Creating a PivotTable
• PivotTable Field List task pane
– Controls structure of pivot table
– Decide what column data to use as column labels, row
labels, PivotTable values, or report filter
25
26.
Microsoft OfficeExcel 2013 Expert
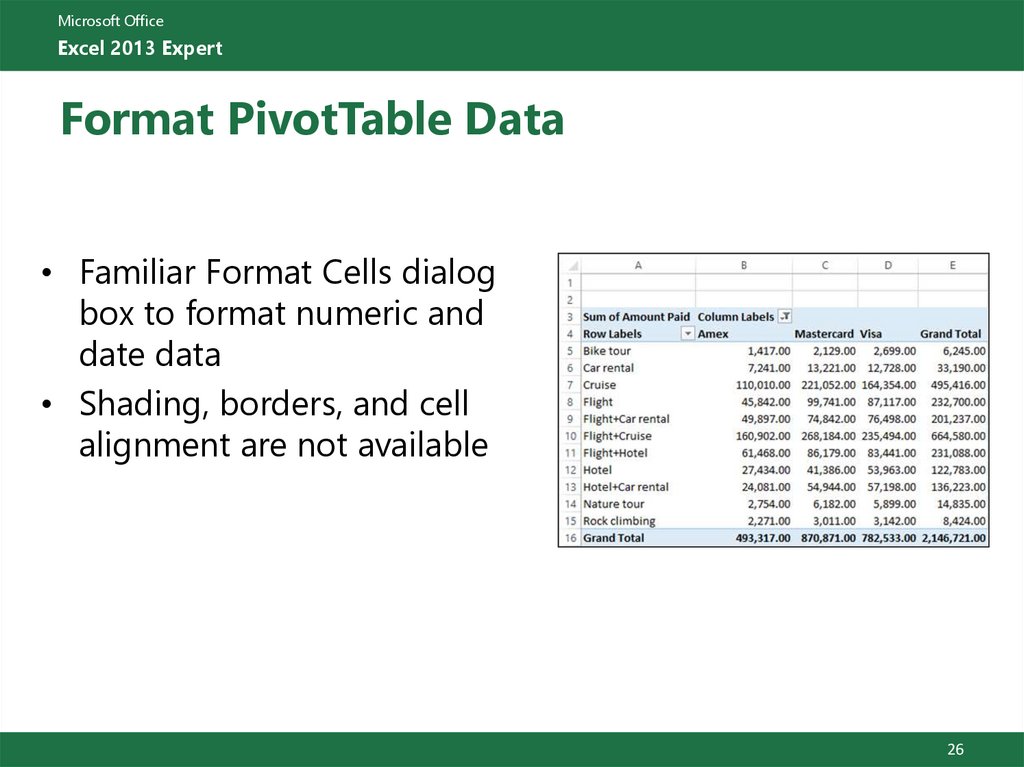
Format PivotTable Data
• Familiar Format Cells dialog
box to format numeric and
date data
• Shading, borders, and cell
alignment are not available
26
27.
Microsoft OfficeExcel 2013 Expert
Customizing PivotTables
• PivotTables allow you to
rotate and filter data in
different ways
– Filter options
– Grouping options
– Sum options
27
28.
Microsoft OfficeExcel 2013 Expert
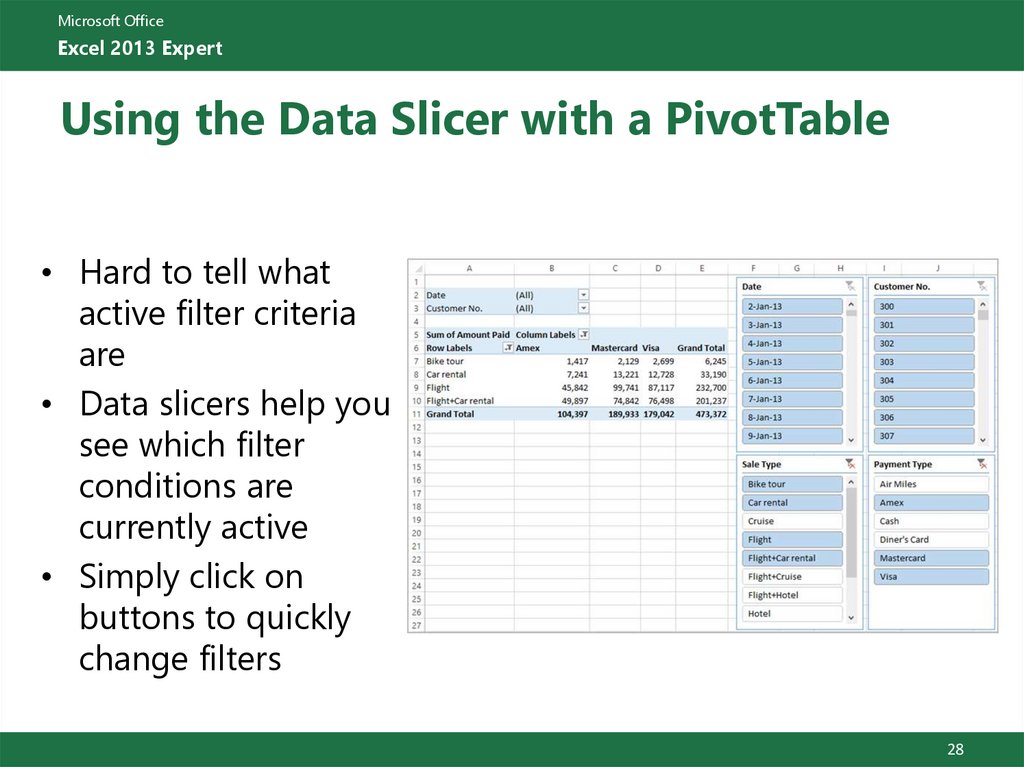
Using the Data Slicer with a PivotTable
• Hard to tell what
active filter criteria
are
• Data slicers help you
see which filter
conditions are
currently active
• Simply click on
buttons to quickly
change filters
28
29.
Microsoft OfficeExcel 2013 Expert
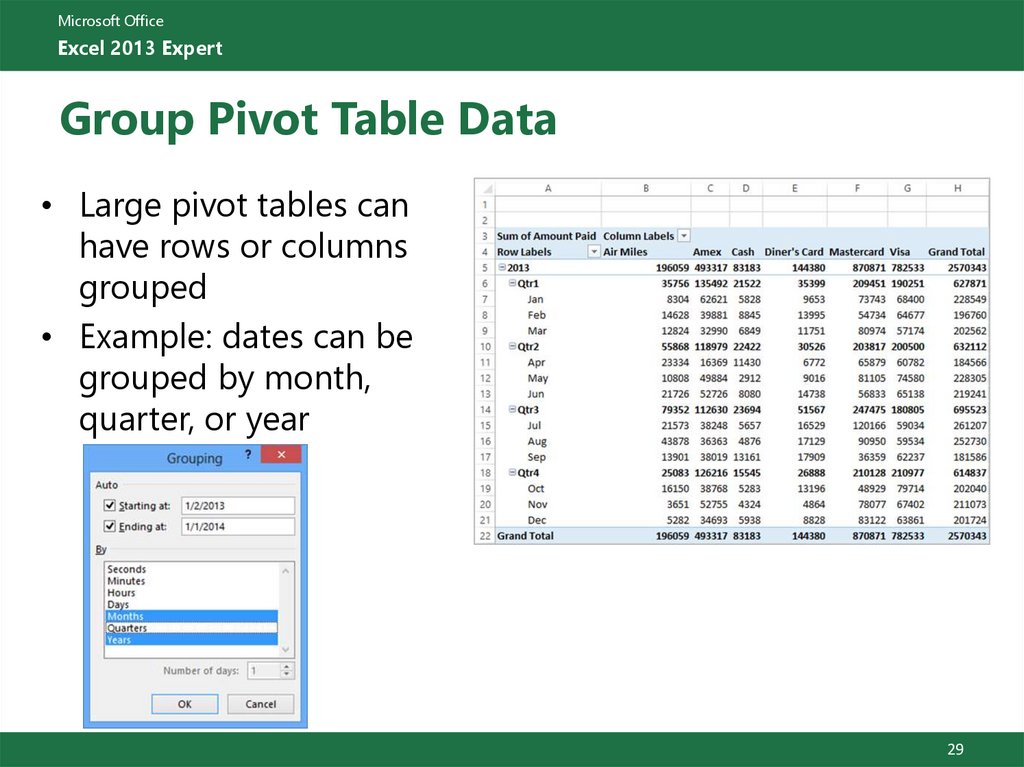
Group Pivot Table Data
• Large pivot tables can
have rows or columns
grouped
• Example: dates can be
grouped by month,
quarter, or year
29
30.
Microsoft OfficeExcel 2013 Expert
Calculated Fields and Items
• Create calculated fields using formulas
• Limitations of calculated fields:
– Can’t refer to cells outside pivot table
– Can’t use functions that reference cells outside pivot table
– Pivot table labels must use single quotes
– Can’t refer to pivot table totals or subtotals
– Calculated fields can’t be used in OLAP-based pivot table
• Calculated fields must be simple formulas or functions
referencing labels inside pivot table
30
31.
Microsoft OfficeExcel 2013 Expert
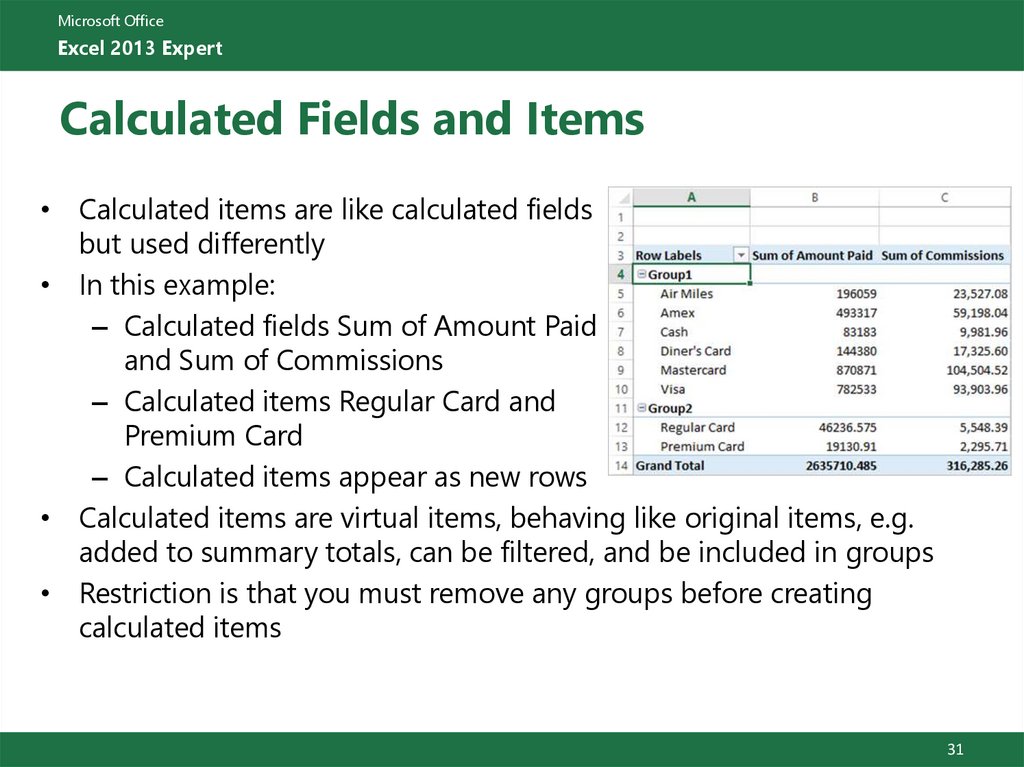
Calculated Fields and Items
• Calculated items are like calculated fields
but used differently
• In this example:
– Calculated fields Sum of Amount Paid
and Sum of Commissions
– Calculated items Regular Card and
Premium Card
– Calculated items appear as new rows
• Calculated items are virtual items, behaving like original items, e.g.
added to summary totals, can be filtered, and be included in groups
• Restriction is that you must remove any groups before creating
calculated items
31
32.
Microsoft OfficeExcel 2013 Expert
PowerPivot
• An extension of a pivot table, but designed for corporate
environment with large complex databases
• Underneath is a high-performance engine
• Pivot tables are limited to Excel’s 1 million rows and 16,000
columns
• Corporate data typically can have billions of rows of data
• Pivot table is an excellent data analysis tool but is slow and
limited to what Excel can access
• PowerPivot bridges the gap by allowing corporate users to
use Excel to connect to high-powered centralized database
servers
32
33.
Microsoft OfficeExcel 2013 Expert
Activating PowerPivot
• PowerPivot is an add-in that must be activated
• To activate:
– Click File, Options
– Click Add-ins
– Select COM Add-ins
– Click Microsoft Office PowerPivot for Excel 2013
• Once activated, the PowerPivot tab is displayed in the
Ribbon
33
34.
Microsoft OfficeExcel 2013 Expert
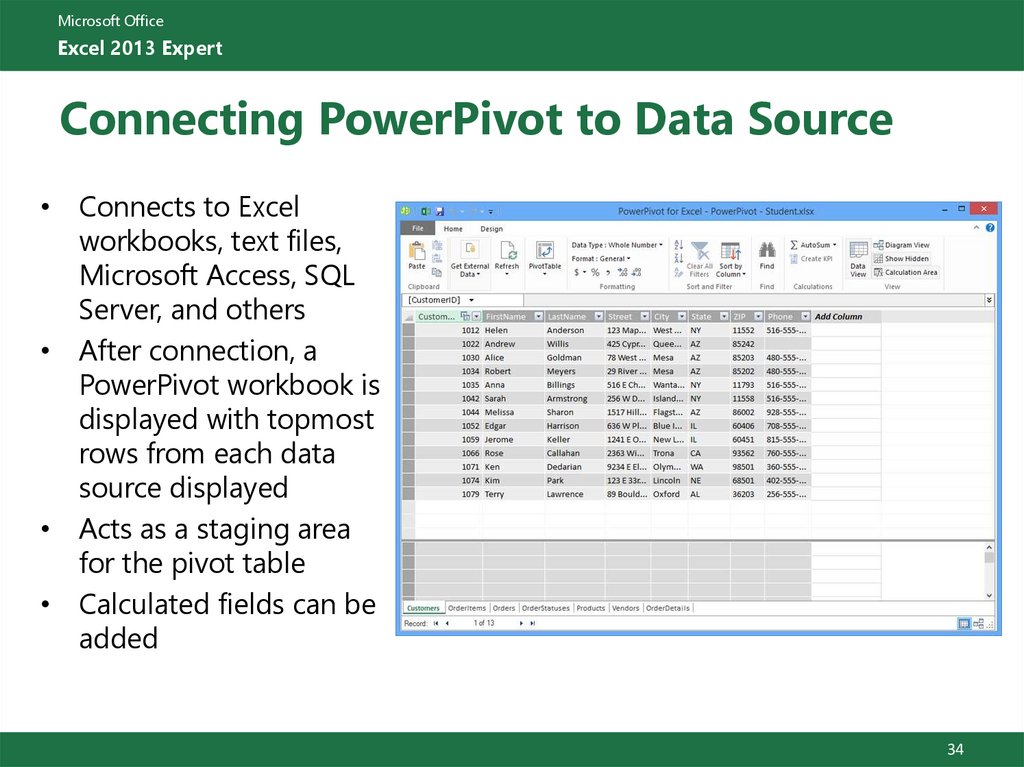
Connecting PowerPivot to Data Source
• Connects to Excel
workbooks, text files,
Microsoft Access, SQL
Server, and others
• After connection, a
PowerPivot workbook is
displayed with topmost
rows from each data
source displayed
• Acts as a staging area
for the pivot table
• Calculated fields can be
added
34
35.
Microsoft OfficeExcel 2013 Expert
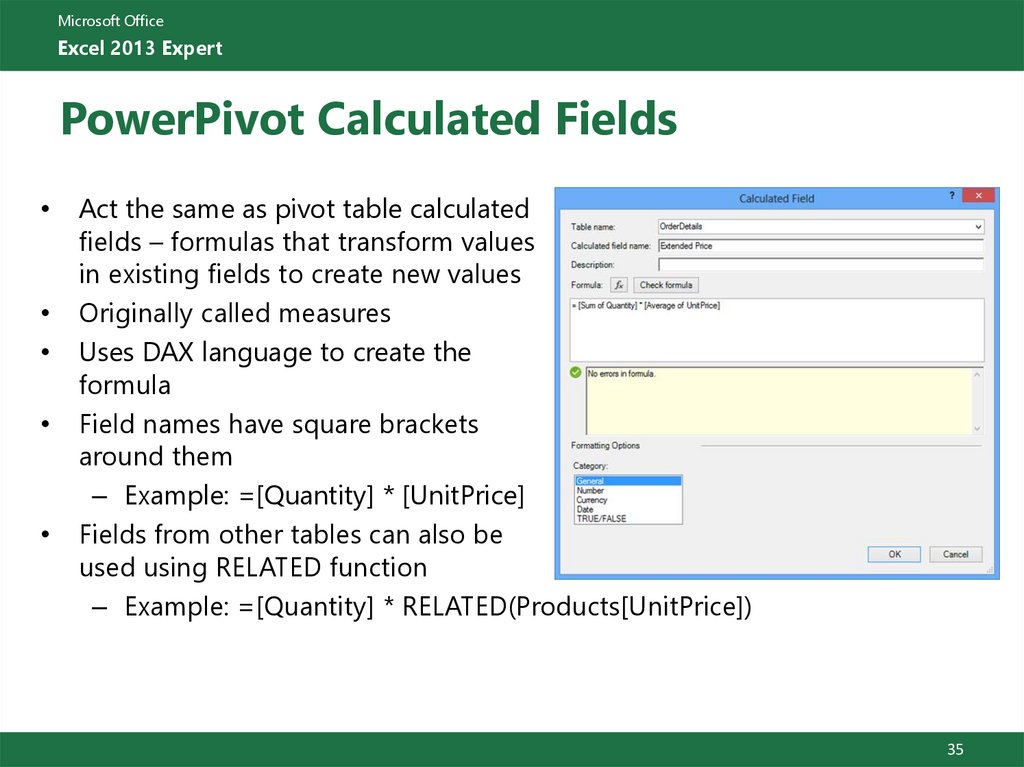
PowerPivot Calculated Fields
Act the same as pivot table calculated
fields – formulas that transform values
in existing fields to create new values
Originally called measures
Uses DAX language to create the
formula
Field names have square brackets
around them
– Example: =[Quantity] * [UnitPrice]
Fields from other tables can also be
used using RELATED function
– Example: =[Quantity] * RELATED(Products[UnitPrice])
35
36.
Microsoft OfficeExcel 2013 Expert
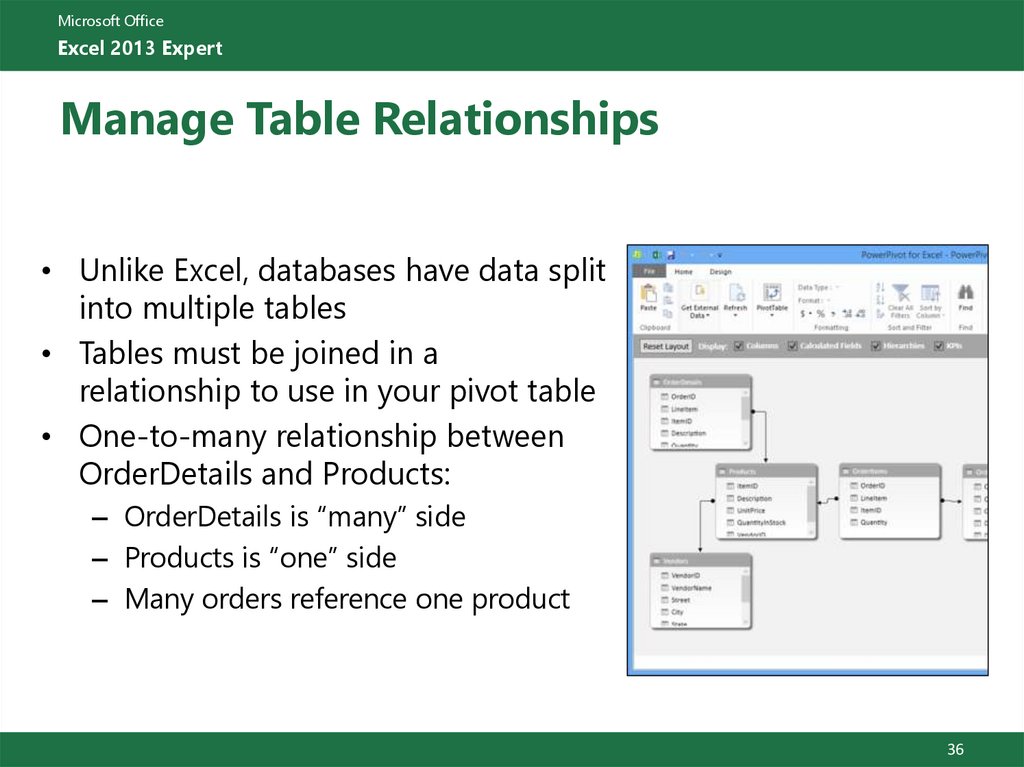
Manage Table Relationships
• Unlike Excel, databases have data split
into multiple tables
• Tables must be joined in a
relationship to use in your pivot table
• One-to-many relationship between
OrderDetails and Products:
– OrderDetails is “many” side
– Products is “one” side
– Many orders reference one product
36
37.
Microsoft OfficeExcel 2013 Expert
Manage Table Relationships
• Significance of understanding
relationships is when you need to
create one
• The table on the “many” side of
the relationship is the “Table”
• The table on the “one” side is the
“Related Lookup Table”
• If you make a mistake, PowerPivot may alert you with an icon
• Ask your IT department for help to create any new relationships
• Once relationships are set up, the data in the pivot table will display
correctly
37
38.
Microsoft OfficeExcel 2013 Expert
Lesson Summary
• Define what a function is
• Use the correct syntax for
functions
• Insert a function
• Use array functions
• Use lookup functions
• Use date and time functions
• Create, format, and
customize pivot tables
• Use data slicers
• Group pivot table data
• Create calculated fields and
items for pivot tables
• Activate PowerPivot, and
connect it to a data source
• Create PowerPivot
calculated fields
• Manage PowerPivot table
relationships
38
39.
Microsoft OfficeExcel 2013 Expert
Review Questions
1. List each of the components of a function, and explain
why it is important to ensure that the syntax of the
function is correct.
2. The vector version of the LOOKUP function will generate
the same results as either the VLOOKUP or HLOOKUP
function.
a. True b. False
3. What is the formula for adding 10 days to the current
date? Will this formula still be accurate even if today is
December 29?
4. Explain why you might create a PivotTable.
39
40.
Microsoft OfficeExcel 2013 Expert
Review Questions
5. What are the similarities and differences between a data
slicer and the AutoFilter tool in the PivotTable?
6. The formula =SUM(B5:B10) can be used in the calculated
field for a pivot table.
a. True
b. False
7. Under what circumstance would a user use PowerPivot
instead of pivot tables?
8. Under what circumstance would a user have to manage
table relationships in PowerPivot?
40
41.
Microsoft OfficeExcel 2013 Expert
Online Assistance with Excel 2013
• http://office.microsoft.com/en-us/excel-help/what-snew-in-excel-2013-HA102809308.aspx
• http://www.gcflearnfree.org/excel2013
• http://office.microsoft.com/en-us/excel-help/trainingcourses-for-excel-2013-HA104032083.aspx
41