


 software
Similar presentations:


")
")
")


Windows crash dump analysis
1.
2.
SVR422Windows Hang and
Crash Dump Analysis
Mark Russinovich
Chief Software Architect
Winternals Software
Copyright © 2006 Mark Russinovich
3.
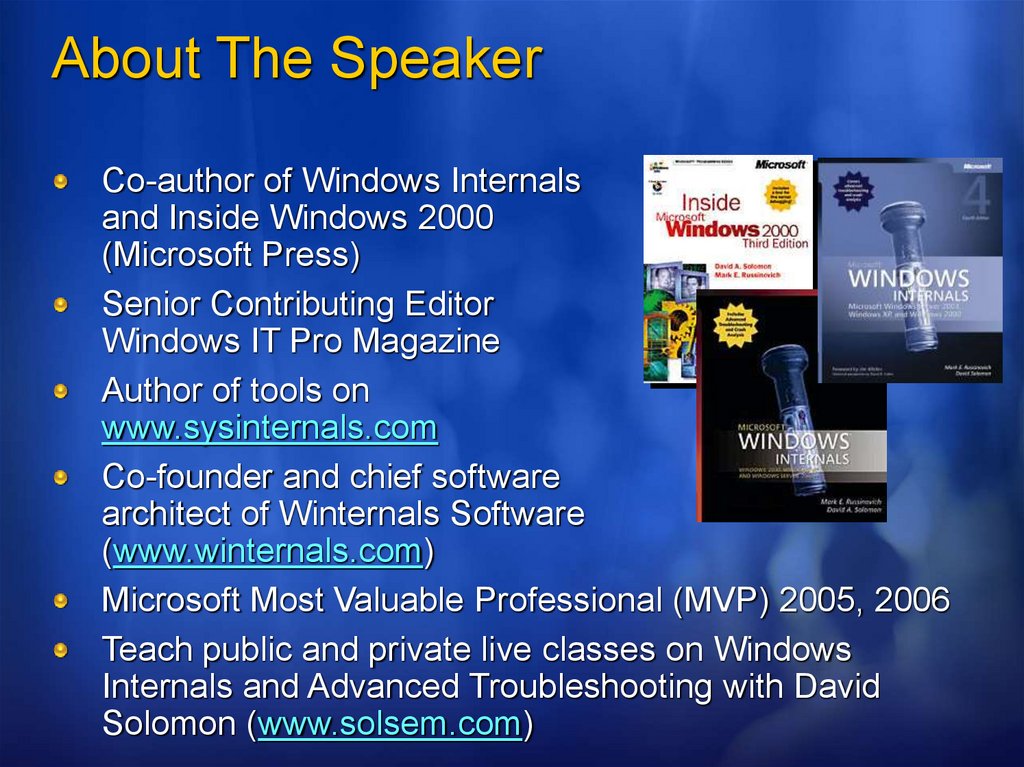
About The SpeakerCo-author of Windows Internals
and Inside Windows 2000
(Microsoft Press)
Senior Contributing Editor
Windows IT Pro Magazine
Author of tools on
www.sysinternals.com
Co-founder and chief software
architect of Winternals Software
(www.winternals.com)
Microsoft Most Valuable Professional (MVP) 2005, 2006
Teach public and private live classes on Windows
Internals and Advanced Troubleshooting with David
Solomon (www.solsem.com)
4.
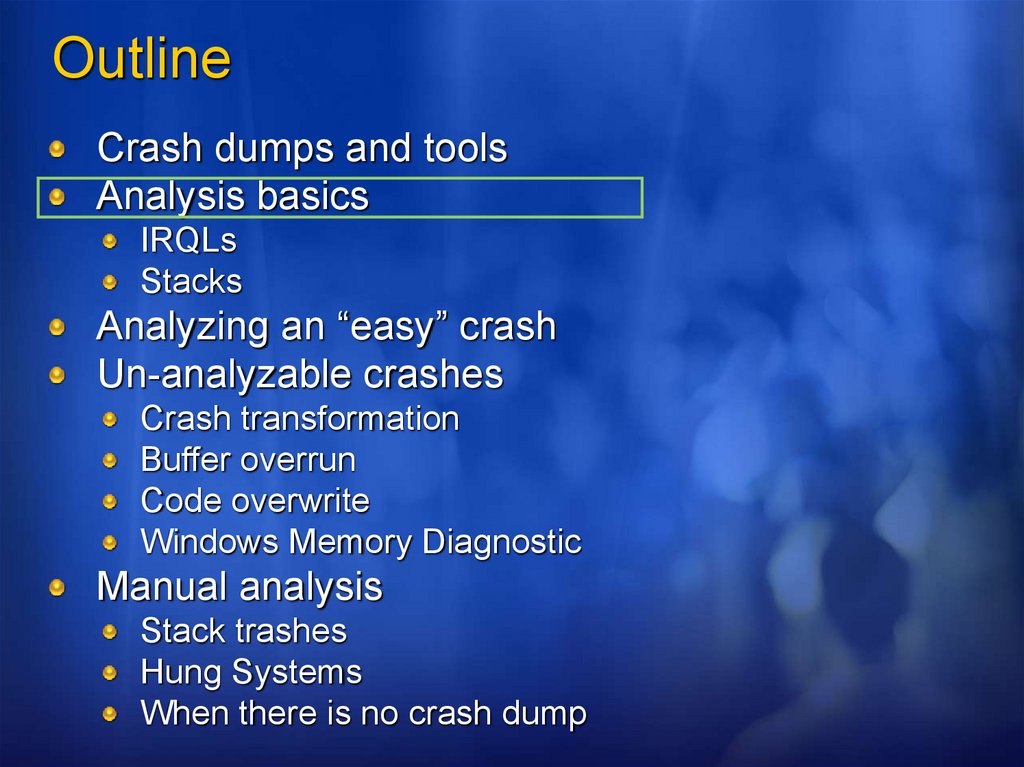
OutlineCrash dumps and tools
Analysis basics
IRQLs
Stacks
Analyzing an “easy” crash
Un-analyzable crashes
Crash transformation
Buffer overrun
Code overwrite
Microsoft Windows Memory Diagnostic
Manual analysis
Stack trashes
Hung Systems
When there is no crash dump
5.
IntroductionMany systems administrators ignore Windows crash
dump options
“I didn’t know I could analyze crashes”
“Crash analysis too hard”
“A crash dump won’t tell me anything anyway”
Basic crash dump analysis is actually
pretty straightforward
Even if only 1 out of 5 or 10 dumps tells you what’s wrong, isn’t it worth
spending a few minutes?
More advanced crash dump analysis much harder
Not well documented
Requires advanced internals, compiler and CPU knowledge
Requires lots of experience
Often difficult to pinpoint cause
More often than not, victim is not the culprit
For example, a driver corrupts an operating system structure; Windows crashes later
6.
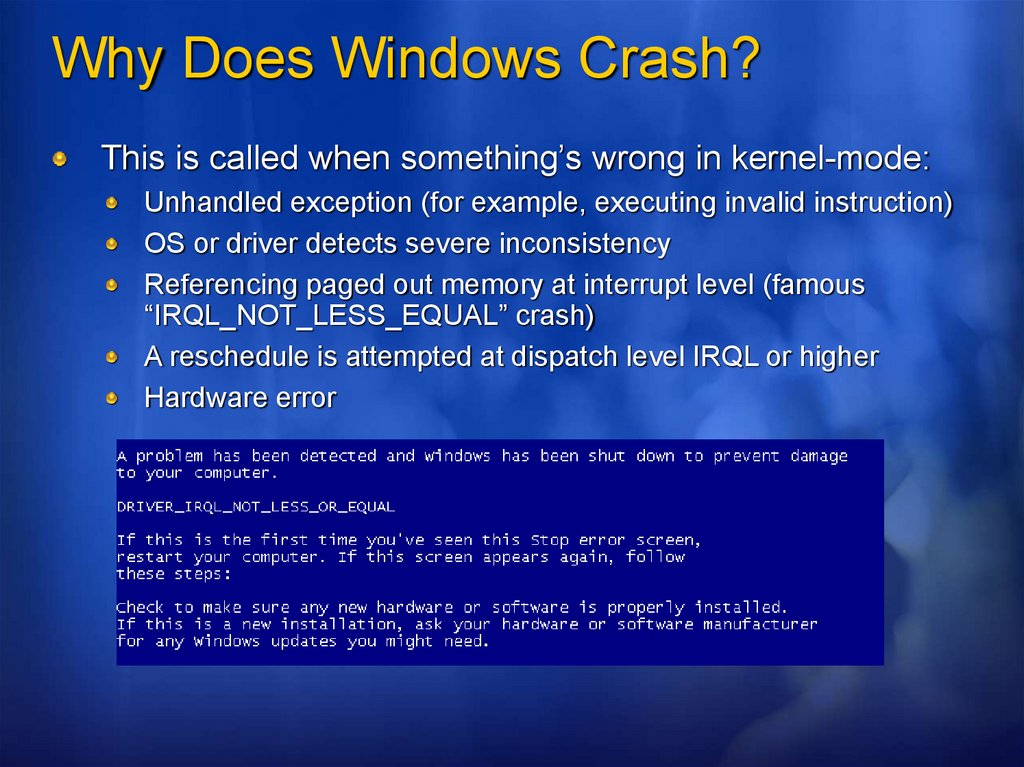
Why Does Windows Crash?This is called when something’s wrong in kernel-mode:
Unhandled exception (for example, executing invalid instruction)
OS or driver detects severe inconsistency
Referencing paged out memory at interrupt level (famous
“IRQL_NOT_LESS_EQUAL” crash)
A reschedule is attempted at dispatch level IRQL or higher
Hardware error
7.
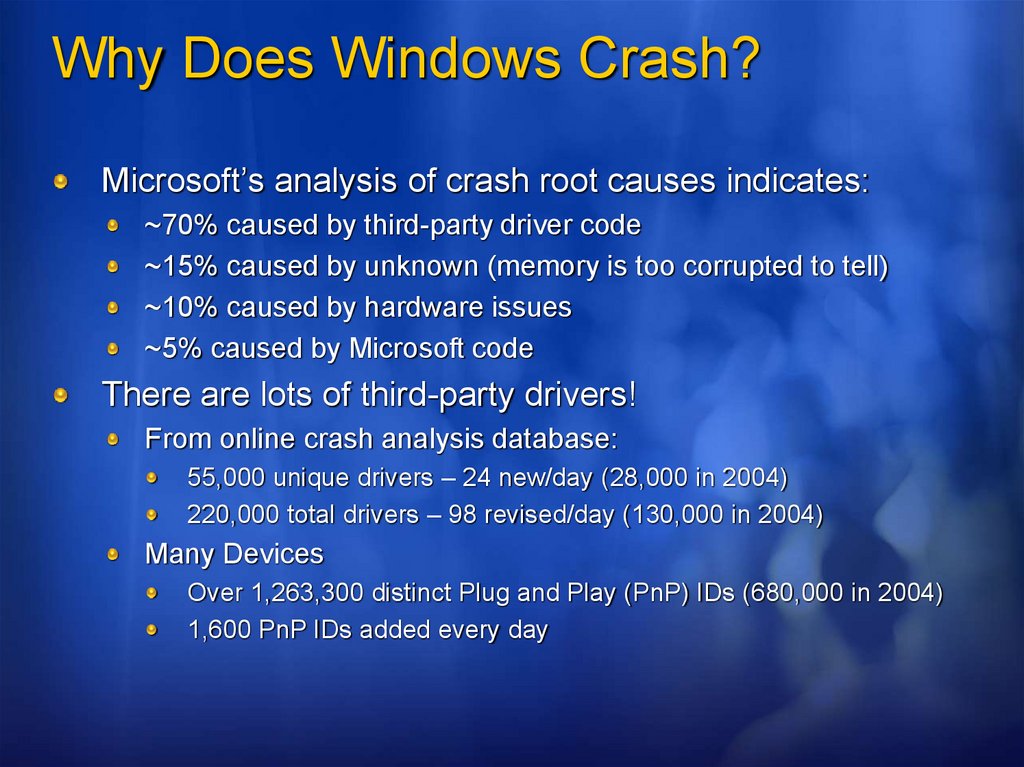
Why Does Windows Crash?Microsoft’s analysis of crash root causes indicates:
~70% caused by third-party driver code
~15% caused by unknown (memory is too corrupted to tell)
~10% caused by hardware issues
~5% caused by Microsoft code
There are lots of third-party drivers!
From online crash analysis database:
55,000 unique drivers – 24 new/day (28,000 in 2004)
220,000 total drivers – 98 revised/day (130,000 in 2004)
Many Devices
Over 1,263,300 distinct Plug and Play (PnP) IDs (680,000 in 2004)
1,600 PnP IDs added every day
8.
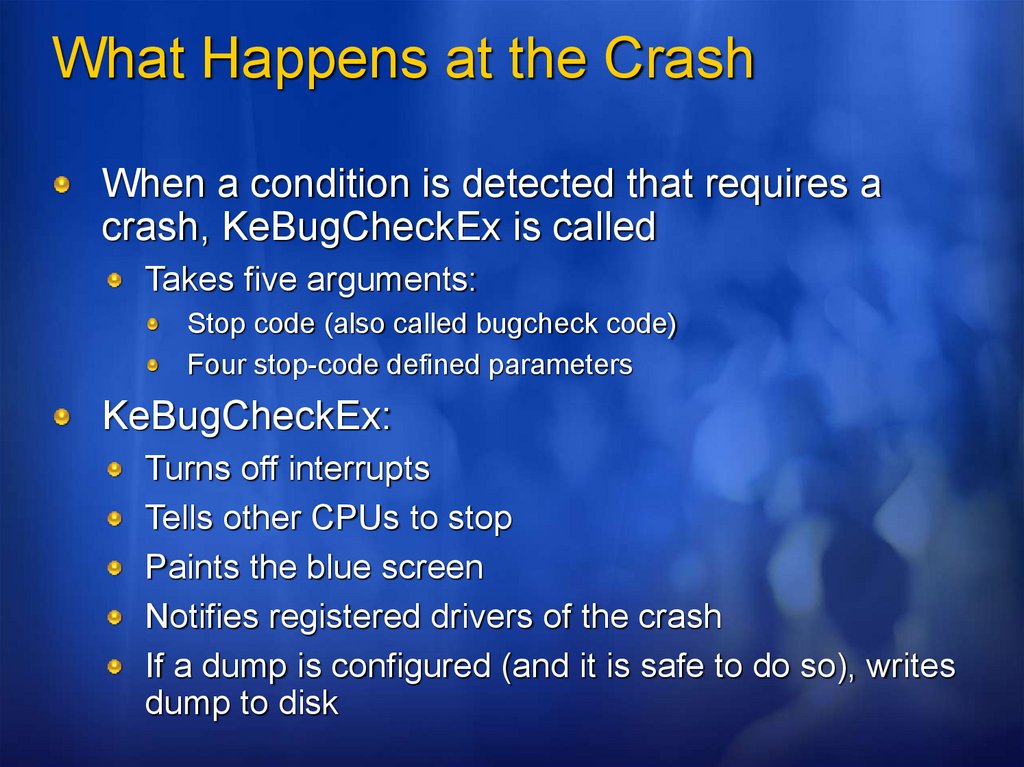
What Happens at the CrashWhen a condition is detected that requires a
crash, KeBugCheckEx is called
Takes five arguments:
Stop code (also called bugcheck code)
Four stop-code defined parameters
KeBugCheckEx:
Turns off interrupts
Tells other CPUs to stop
Paints the blue screen
Notifies registered drivers of the crash
If a dump is configured (and it is safe to do so), writes
dump to disk
9.
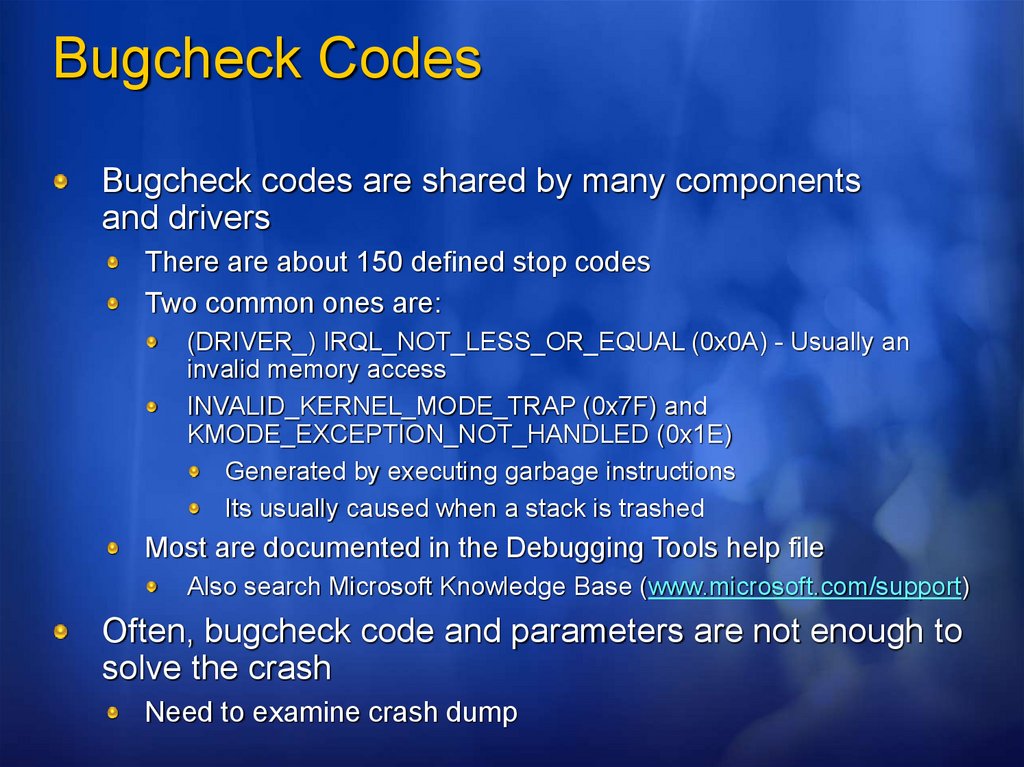
Bugcheck CodesBugcheck codes are shared by many components
and drivers
There are about 150 defined stop codes
Two common ones are:
(DRIVER_) IRQL_NOT_LESS_OR_EQUAL (0x0A) - Usually an
invalid memory access
INVALID_KERNEL_MODE_TRAP (0x7F) and
KMODE_EXCEPTION_NOT_HANDLED (0x1E)
Generated by executing garbage instructions
Its usually caused when a stack is trashed
Most are documented in the Debugging Tools help file
Also search Microsoft Knowledge Base (www.microsoft.com/support)
Often, bugcheck code and parameters are not enough to
solve the crash
Need to examine crash dump
10.
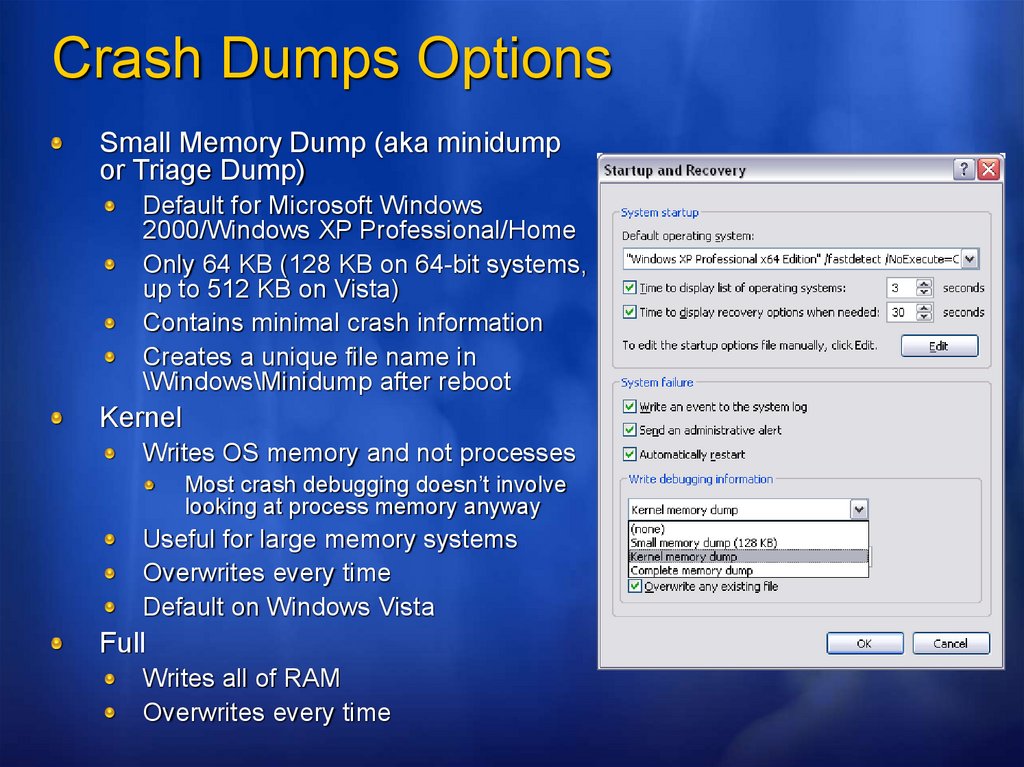
Crash Dumps OptionsSmall Memory Dump (aka minidump
or Triage Dump)
Default for Microsoft Windows
2000/Windows XP Professional/Home
Only 64 KB (128 KB on 64-bit systems,
up to 512 KB on Vista)
Contains minimal crash information
Creates a unique file name in
\Windows\Minidump after reboot
Kernel
Writes OS memory and not processes
Most crash debugging doesn’t involve
looking at process memory anyway
Useful for large memory systems
Overwrites every time
Default on Windows Vista
Full
Writes all of RAM
Overwrites every time
11.
MinidumpsOn Windows XP, Windows Server 2003, and
Windows Vista, minidump is always created,
even if system set to full or kernel dump
Can extract a minidump from a kernel or full
dump using the debugger “.dump /m” command
To analyze, requires access to the images on the
system that crashed
At least must have have access to the Ntoskrnl.exe
Microsoft Symbol Server now has images for Windows
XP and later
Set image path to same as symbol path (covered later)
12.
Writing a Crash DumpCrash dumps are written to the paging file
Too risky to try and create a new file
(no guarantee you will get a dump anyway)
How is even this protected?
When the system boots it checks
HKEY_LOCAL_MACHINE\System\
CurrentControlSet\Control\CrashControl
The boot volume paging file’s on-disk mapping is obtained
Relevant components are checksummed:
Boot disk miniport driver
Crash I/O functions
Page file map
On crash, if checksum doesn’t match, dump is not written
13.
Why Would You Not Get a Dump?Crash occurred before paging file was open
For example a crash during driver initialization
The crash corrupted components involved in the
dump process
Spontaneous reboot
Paging file on boot volume is too small
Not enough free space for extracted dump
Hung system
We’ll cover how to troubleshoot these problems later
14.
At The RebootWinLogon
Session
Manager
2
Memory.dmp
3
SaveDump
User mode
Kernel mode
1
NtCreatePagingFile
4
Paging
File
15.
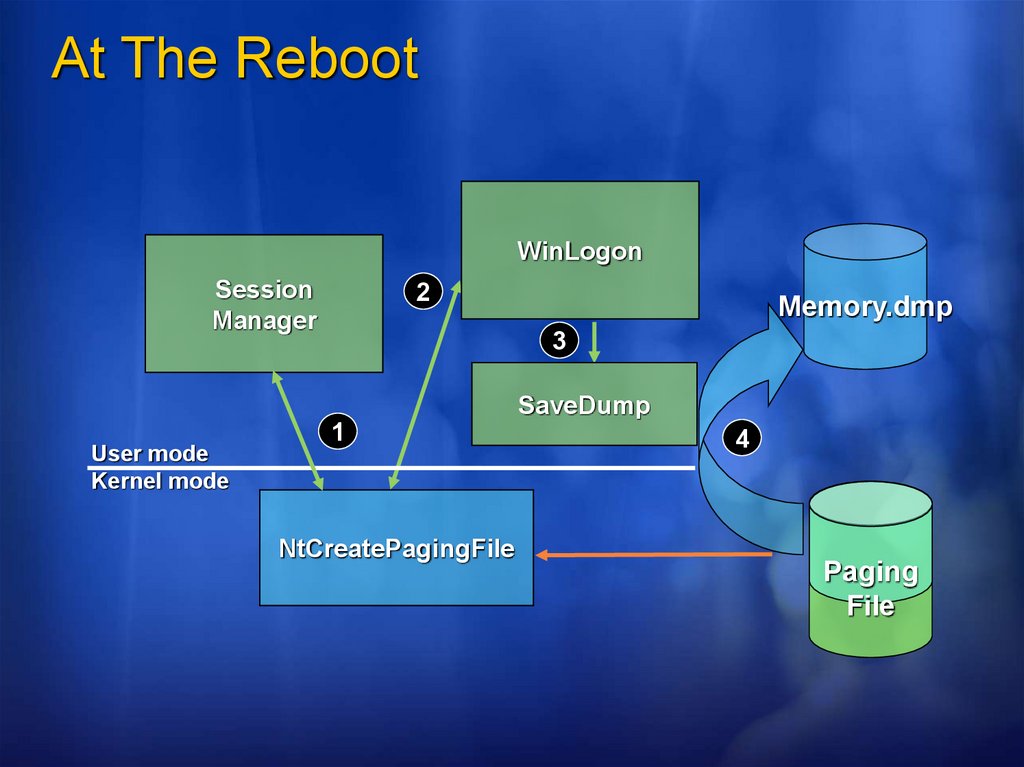
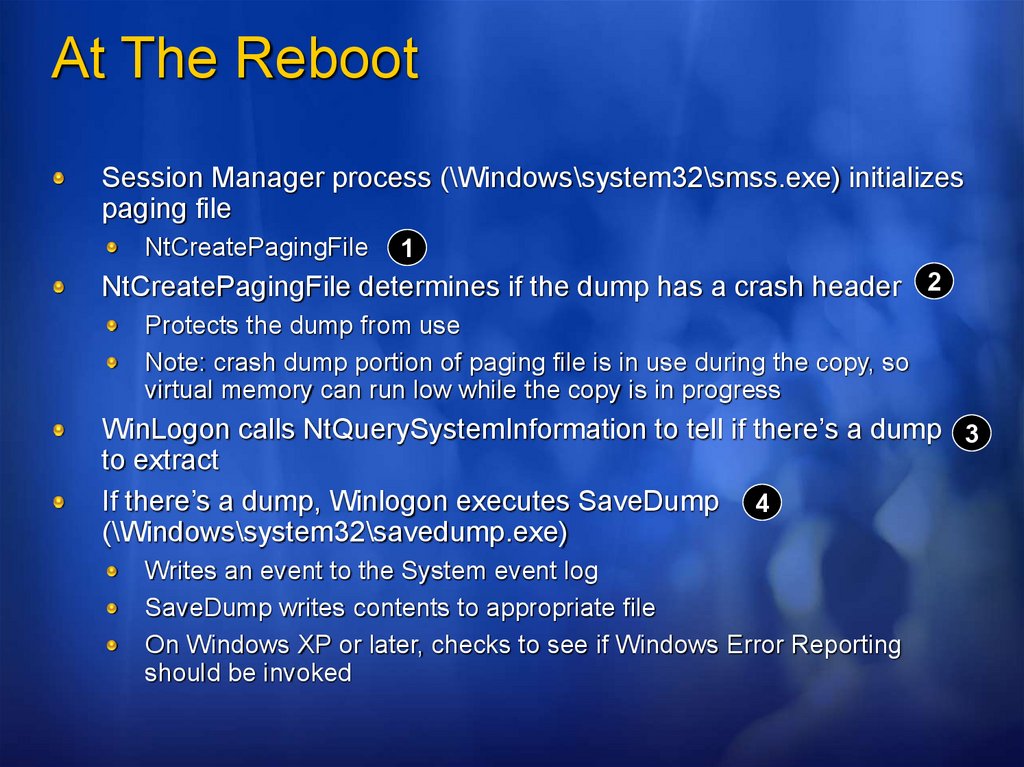
At The RebootSession Manager process (\Windows\system32\smss.exe) initializes
paging file
NtCreatePagingFile
1
NtCreatePagingFile determines if the dump has a crash header 2
Protects the dump from use
Note: crash dump portion of paging file is in use during the copy, so
virtual memory can run low while the copy is in progress
WinLogon calls NtQuerySystemInformation to tell if there’s a dump 3
to extract
If there’s a dump, Winlogon executes SaveDump 4
(\Windows\system32\savedump.exe)
Writes an event to the System event log
SaveDump writes contents to appropriate file
On Windows XP or later, checks to see if Windows Error Reporting
should be invoked
16.
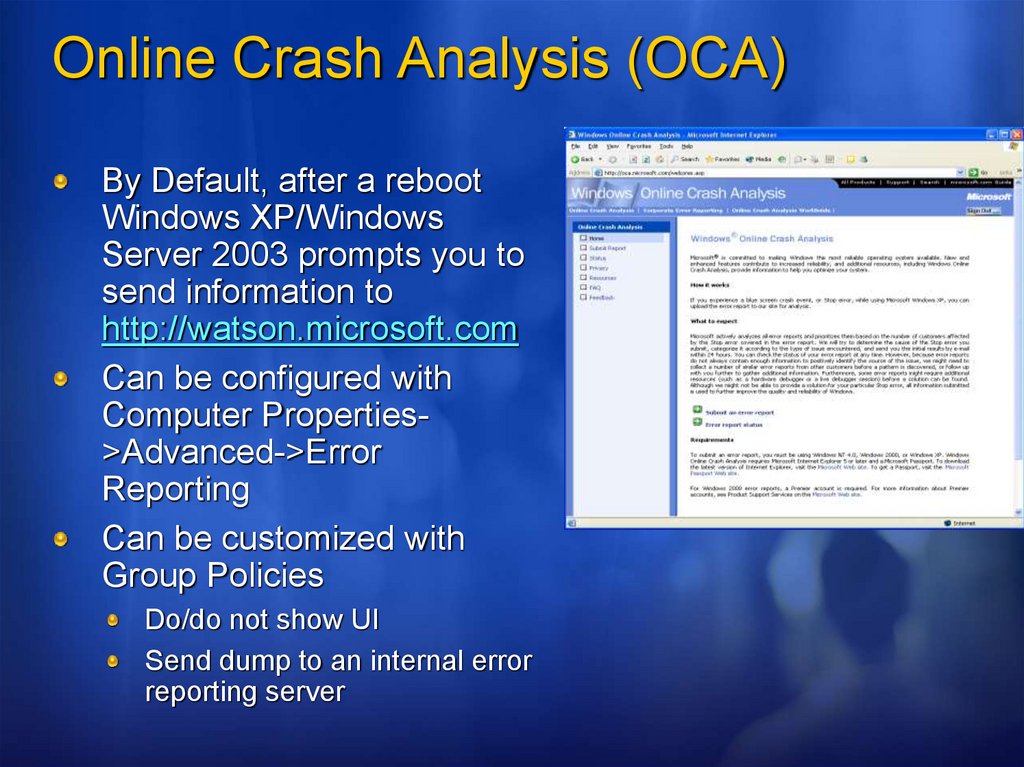
Online Crash Analysis (OCA)By Default, after a reboot
Windows XP/Windows
Server 2003 prompts you to
send information to
http://watson.microsoft.com
Can be configured with
Computer Properties>Advanced->Error
Reporting
Can be customized with
Group Policies
Do/do not show UI
Send dump to an internal error
reporting server
17.
Windows Error ReportingSavedump checks if kernel error reporting is enabled
Checks two values under
HKLM\Software\Microsoft\PCHealth\ErrorReporting:
IncludeKernelFaults and DoReport
If crash reporting is enabled, Savedump:
Extracts a minidump from the dump file (if system set to full or
kernel dumps)
Writes the name of the minidump under
HKLM\Software\Microsoft\PCHealth\ErrorReporting\KernelFaults
Adds a command to execute Dumprep.exe to
HKLM\Software\Microsoft\Windows\CurrentVersion\Run
This will cause it to run at the first user log on
Dumpprep then:
Generates an XML description of system version, drivers present,
loaded plug and play drivers and depending on the configuration
Displays the message box (if enabled) to send the dump
Submits to dump for automatic analysis
18.
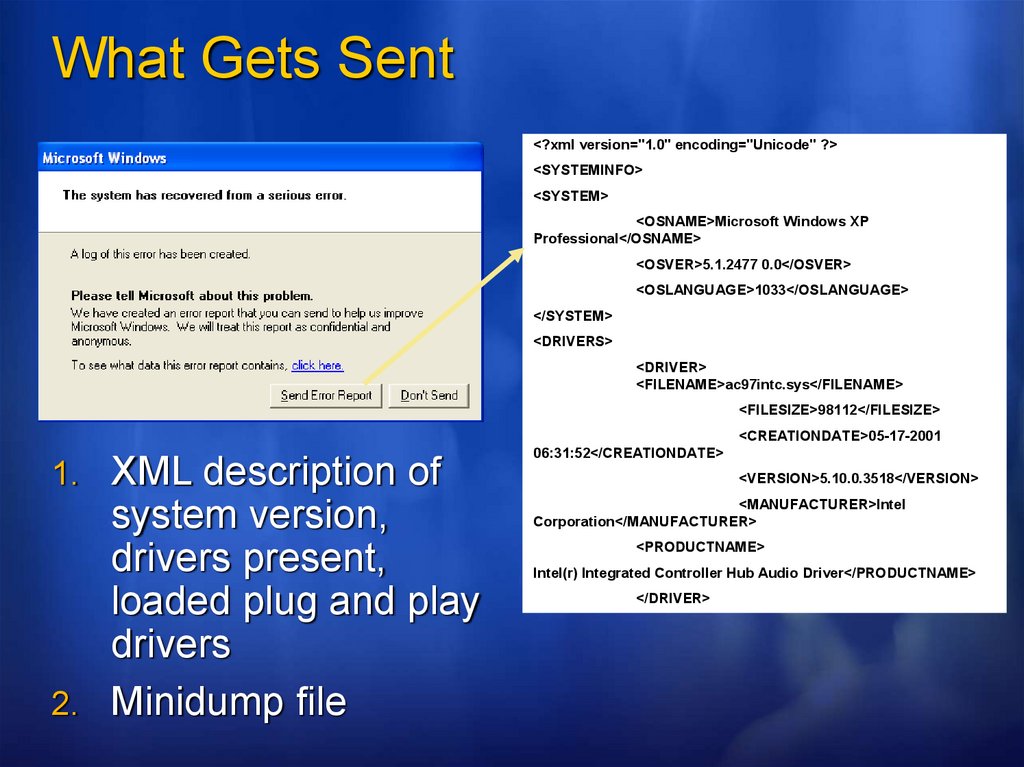
What Gets Sent<?xml version="1.0" encoding="Unicode" ?>
<SYSTEMINFO>
<SYSTEM>
<OSNAME>Microsoft Windows XP
Professional</OSNAME>
<OSVER>5.1.2477 0.0</OSVER>
<OSLANGUAGE>1033</OSLANGUAGE>
</SYSTEM>
<DRIVERS>
<DRIVER>
<FILENAME>ac97intc.sys</FILENAME>
<FILESIZE>98112</FILESIZE>
<CREATIONDATE>05-17-2001
1. XML description of
system version,
drivers present,
loaded plug and play
drivers
2. Minidump file
06:31:52</CREATIONDATE>
<VERSION>5.10.0.3518</VERSION>
<MANUFACTURER>Intel
Corporation</MANUFACTURER>
<PRODUCTNAME>
Intel(r) Integrated Controller Hub Audio Driver</PRODUCTNAME>
</DRIVER>
19.
What Does OCA Do?Server farm uses !analyze, but looks up
crash fingerprint in Microsoft’s crash
resolution database
Sometimes OCA will point you at KB articles that
describe the problem
KB articles may tell you to use Windows Update to get newer
drivers, a hotfix, or install a Service Pack
Many times OCA will say “A driver caused a problem”
OCA can’t tell you when it suspects a driver that
hasn’t been conclusively identified as being
responsible by hand analysis
20.
OutlineCrash dumps and tools
Analysis basics
IRQLs
Stacks
Analyzing an “easy” crash
Un-analyzable crashes
Crash transformation
Buffer overrun
Code overwrite
Windows Memory Diagnostic
Manual analysis
Stack trashes
Hung Systems
When there is no crash dump
21.
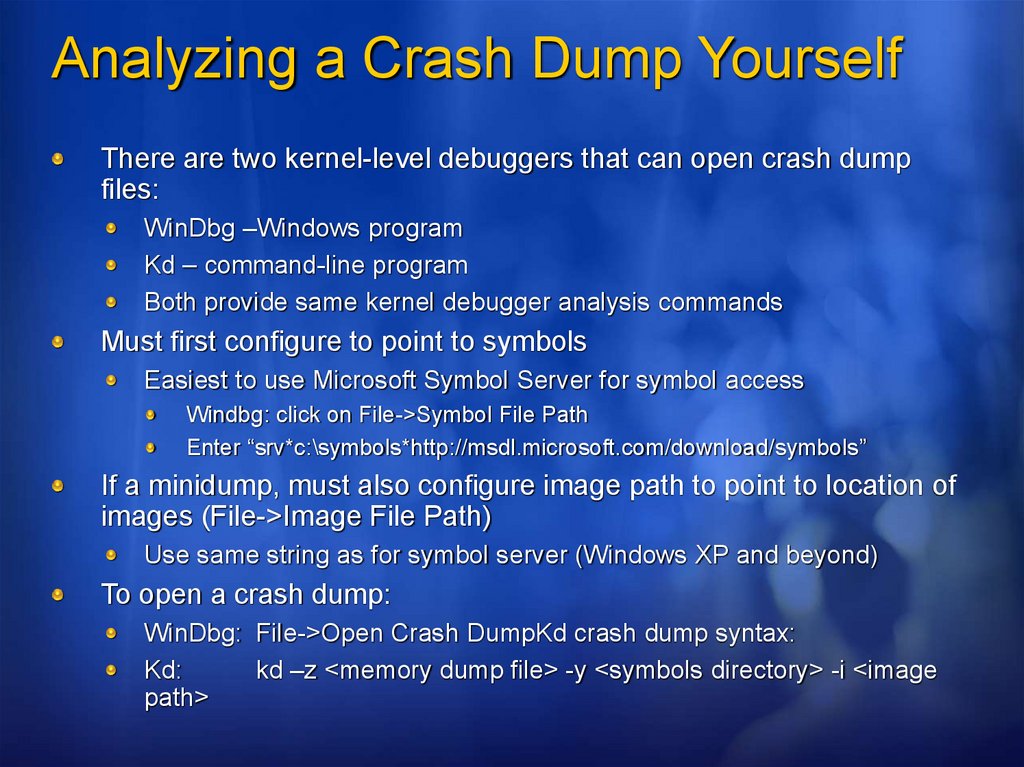
Analyzing a Crash Dump YourselfThere are two kernel-level debuggers that can open crash dump
files:
WinDbg –Windows program
Kd – command-line program
Both provide same kernel debugger analysis commands
Must first configure to point to symbols
Easiest to use Microsoft Symbol Server for symbol access
Windbg: click on File->Symbol File Path
Enter “srv*c:\symbols*http://msdl.microsoft.com/download/symbols”
If a minidump, must also configure image path to point to location of
images (File->Image File Path)
Use same string as for symbol server (Windows XP and beyond)
To open a crash dump:
WinDbg: File->Open Crash DumpKd crash dump syntax:
Kd:
kd –z <memory dump file> -y <symbols directory> -i <image
path>
22.
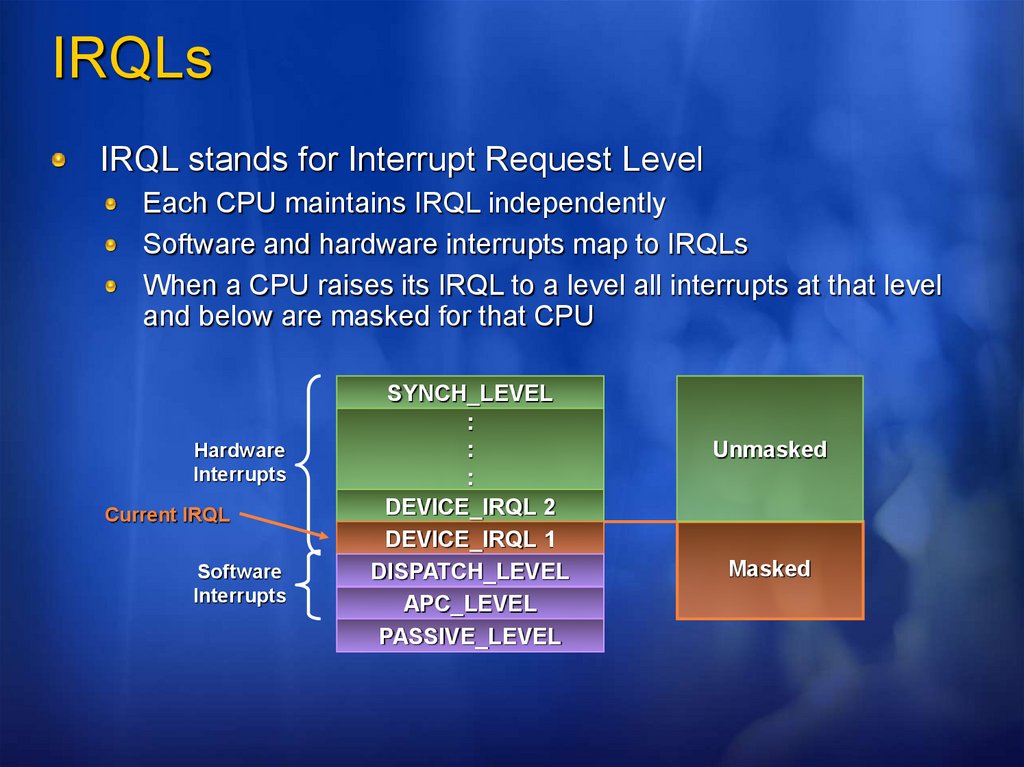
IRQLsIRQL stands for Interrupt Request Level
Each CPU maintains IRQL independently
Software and hardware interrupts map to IRQLs
When a CPU raises its IRQL to a level all interrupts at that level
and below are masked for that CPU
Hardware
Interrupts
Current IRQL
Software
Interrupts
SYNCH_LEVEL
:
:
:
DEVICE_IRQL 2
DEVICE_IRQL 1
DISPATCH_LEVEL
APC_LEVEL
PASSIVE_LEVEL
Unmasked
Masked
23.
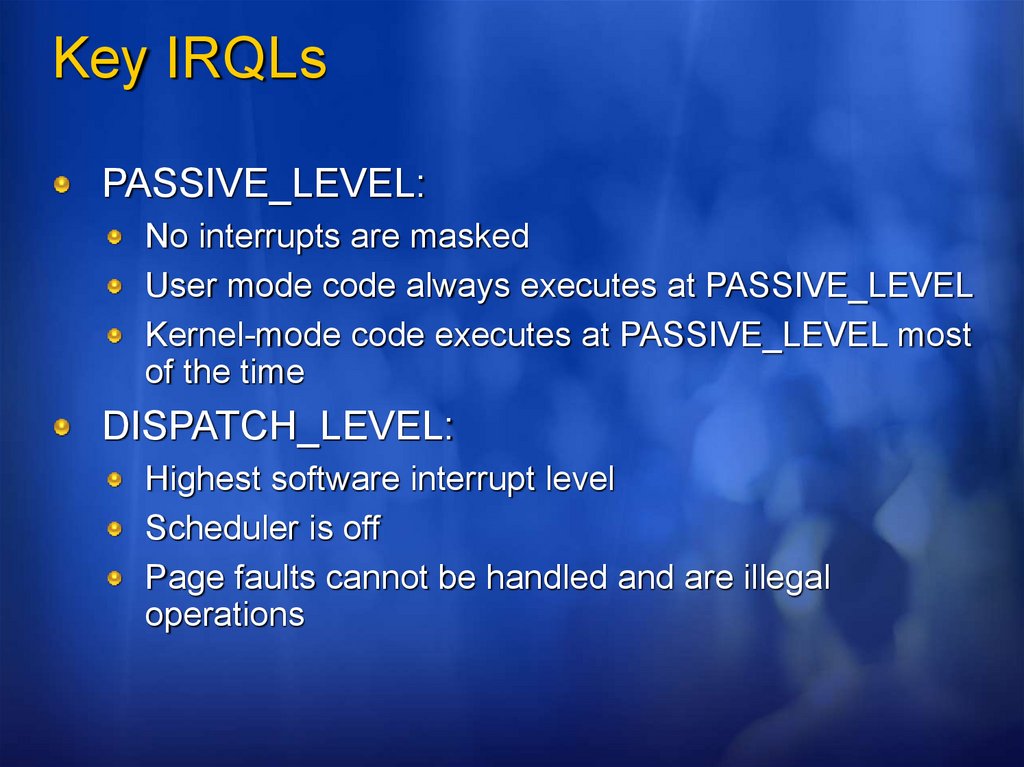
Key IRQLsPASSIVE_LEVEL:
No interrupts are masked
User mode code always executes at PASSIVE_LEVEL
Kernel-mode code executes at PASSIVE_LEVEL most
of the time
DISPATCH_LEVEL:
Highest software interrupt level
Scheduler is off
Page faults cannot be handled and are illegal
operations
24.
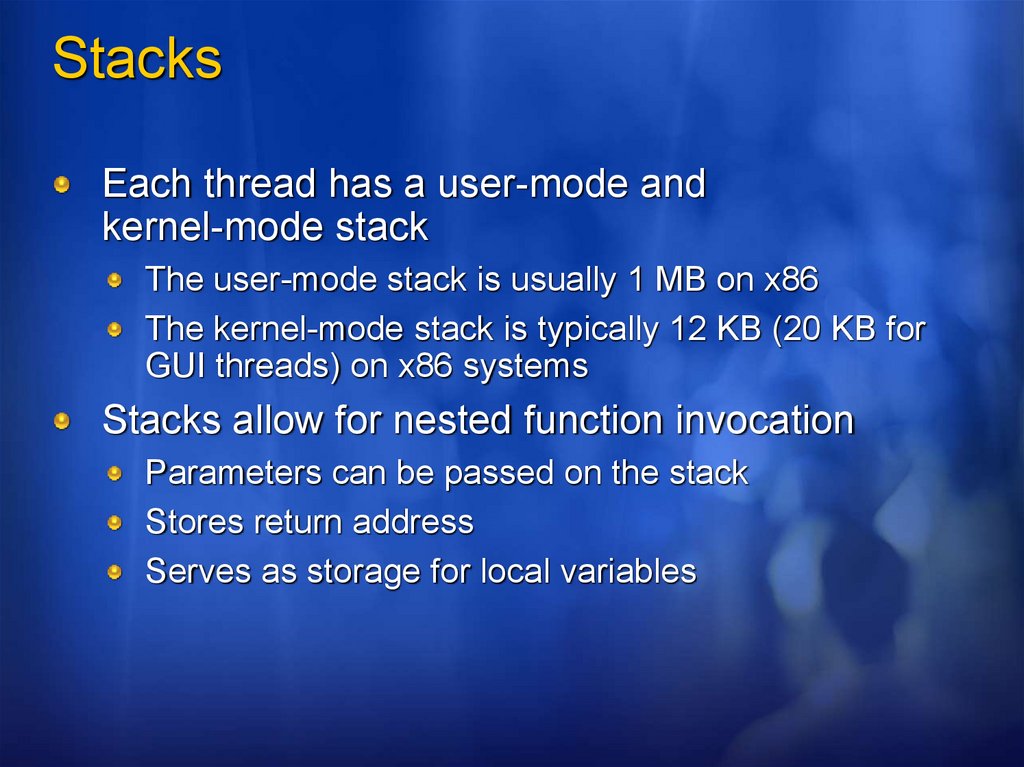
StacksEach thread has a user-mode and
kernel-mode stack
The user-mode stack is usually 1 MB on x86
The kernel-mode stack is typically 12 KB (20 KB for
GUI threads) on x86 systems
Stacks allow for nested function invocation
Parameters can be passed on the stack
Stores return address
Serves as storage for local variables
25.
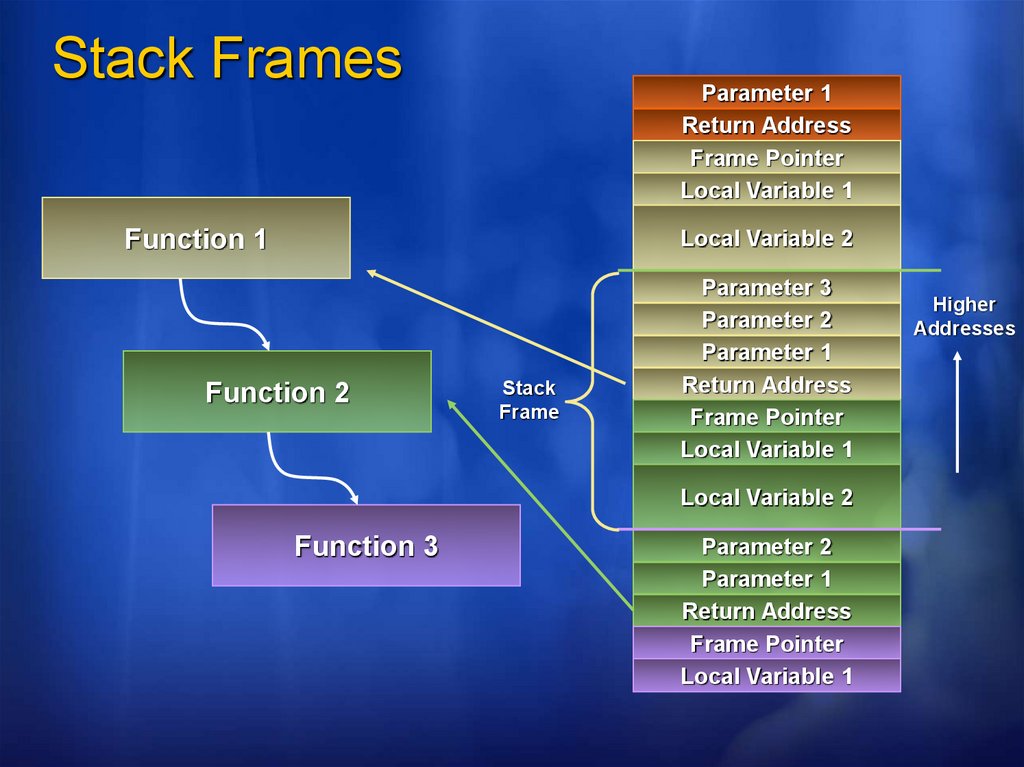
Stack FramesParameter 1
Return Address
Frame Pointer
Local Variable 1
Function 1
Local Variable 2
Function 2
Stack
Frame
Parameter 3
Parameter 2
Parameter 1
Return Address
Frame Pointer
Local Variable 1
Local Variable 2
Function 3
Parameter 2
Parameter 1
Return Address
Frame Pointer
Local Variable 1
Higher
Addresses
26.
Calling ConventionsStacks are easy to interpret if functions use
standard calling conventions
Other calling conventions make the stack hard to
figure out
No frame pointer
Register arguments (fast calls)
A debugger requires symbol information to parse
non-standard stack frames
Makes accurate analysis of crashes involving thirdparty drivers difficult
27.
OutlineCrash dumps and tools
Analysis basics
IRQLs
Stacks
Analyzing an “easy” crash
Un-analyzable crashes
Crash transformation
Buffer overrun
Code overwrite
Windows Memory Diagnostic
Manual analysis
Stack trashes
Hung Systems
When there is no crash dump
28.
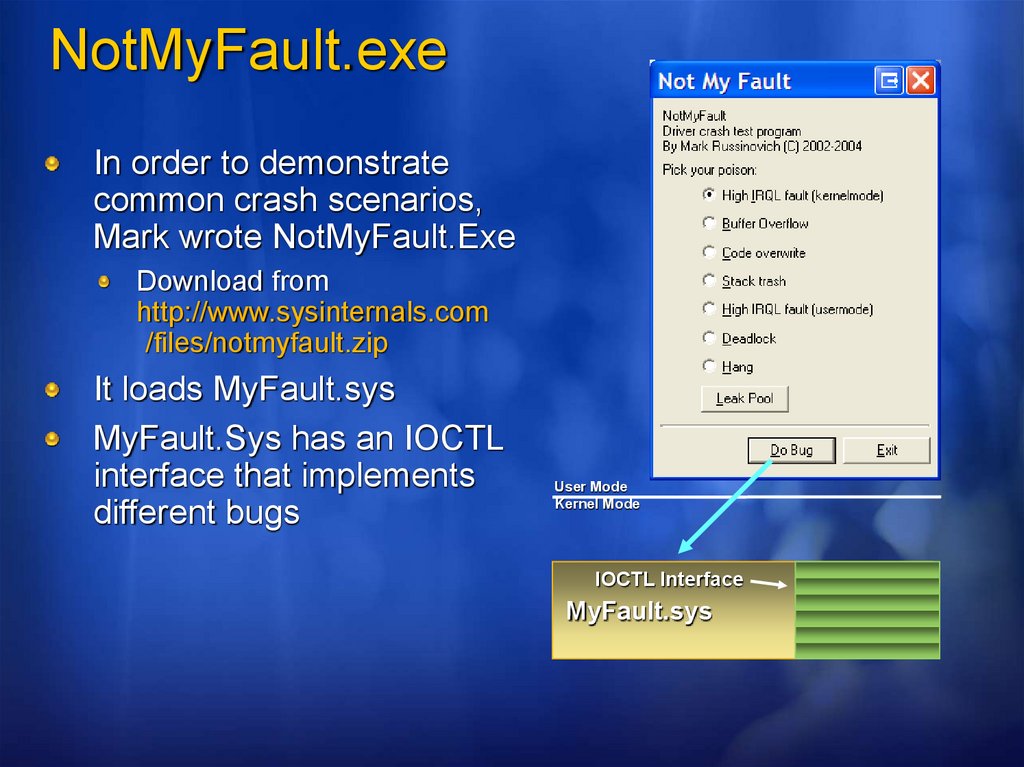
NotMyFault.exeIn order to demonstrate
common crash scenarios,
Mark wrote NotMyFault.Exe
Download from
http://www.sysinternals.com
/files/notmyfault.zip
It loads MyFault.sys
MyFault.Sys has an IOCTL
interface that implements
different bugs
User Mode
Kernel Mode
IOCTL Interface
MyFault.sys
29.
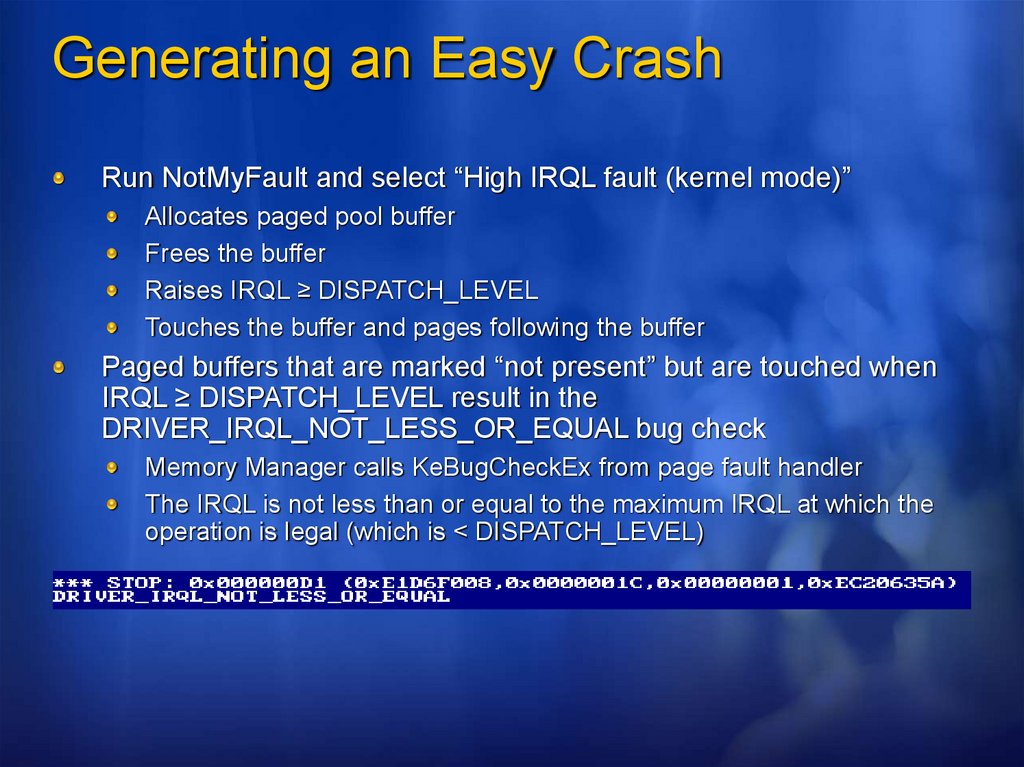
Generating an Easy CrashRun NotMyFault and select “High IRQL fault (kernel mode)”
Allocates paged pool buffer
Frees the buffer
Raises IRQL ≥ DISPATCH_LEVEL
Touches the buffer and pages following the buffer
Paged buffers that are marked “not present” but are touched when
IRQL ≥ DISPATCH_LEVEL result in the
DRIVER_IRQL_NOT_LESS_OR_EQUAL bug check
Memory Manager calls KeBugCheckEx from page fault handler
The IRQL is not less than or equal to the maximum IRQL at which the
operation is legal (which is < DISPATCH_LEVEL)
30.
Analyzing an Easy CrashOpen crash dump with Windbg
!analyze easily identifies MyFault.sys by looking
at the KeBugCheckEx parameters
The Memory Manager looked at the stack and
determined the address that caused the page fault
!analyze often looks at the stack to determine the
cause of a crash
31.
Automated AnalysisWhen you open a crash dump with Windbg or Kd
you get a basic crash analysis:
Stop code and parameters
A guess at offending driver
The analysis is the result of the automated
execution of the !analyze debugger command
!Analyze uses heuristics to walk up the stack and
determine what driver is the likely cause of the crash
“Followup” is taken from optional triage.ini file
Don’t trust blame of ntoskrnl, win32k, hal, ntfs or
other core Windows components
32.
Crash TransformationMany crashes can’t be analyzed
The “victim” crashed the system, not the criminal
The analyzer may point at Ntoskrnl.exe or Win32K.sys
or other Windows components
Or, you may get many different crash dumps all
pointing at different causes
You’re goal isn’t to analyze impossible crashes…
It’s to try to make an “unanalyzable” crash into
one that can be analyzed
33.
OutlineCrash dumps and tools
Analysis basics
IRQLs
Stacks
Analyzing an “easy” crash
Un-analyzable crashes
Crash transformation
Buffer overrun
Code overwrite
Windows Memory Diagnostic
Manual analysis
Stack trashes
Hung Systems
When there is no crash dump
34.
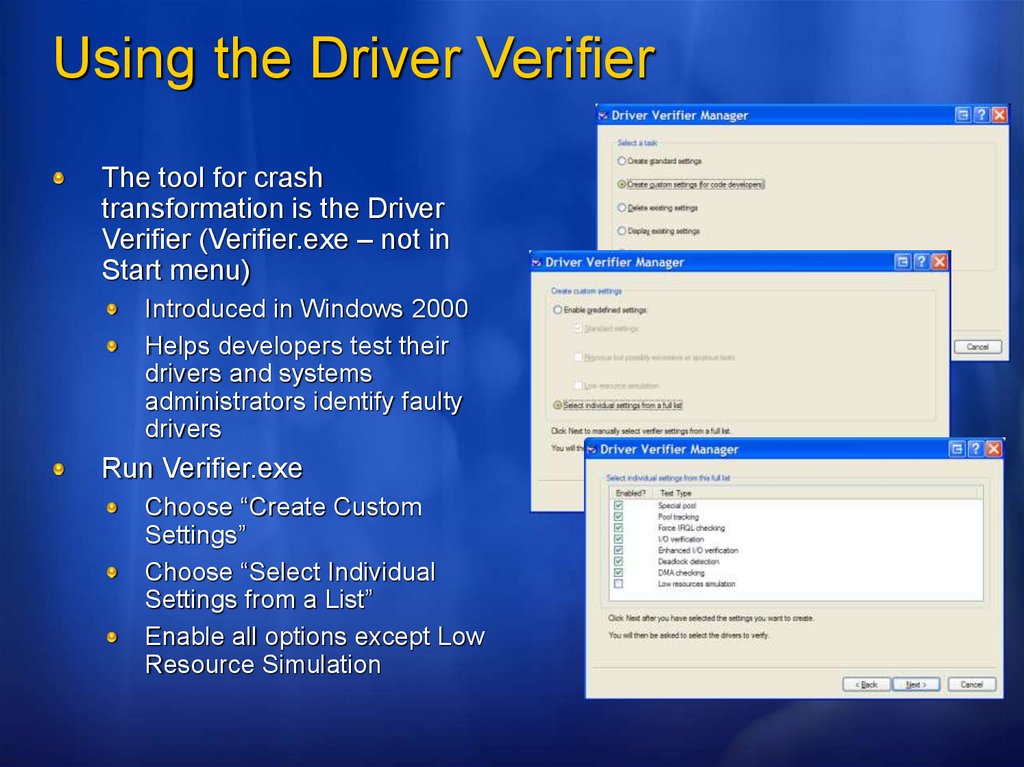
Using the Driver VerifierThe tool for crash
transformation is the Driver
Verifier (Verifier.exe – not in
Start menu)
Introduced in Windows 2000
Helps developers test their
drivers and systems
administrators identify faulty
drivers
Run Verifier.exe
Choose “Create Custom
Settings”
Choose “Select Individual
Settings from a List”
Enable all options except Low
Resource Simulation
35.
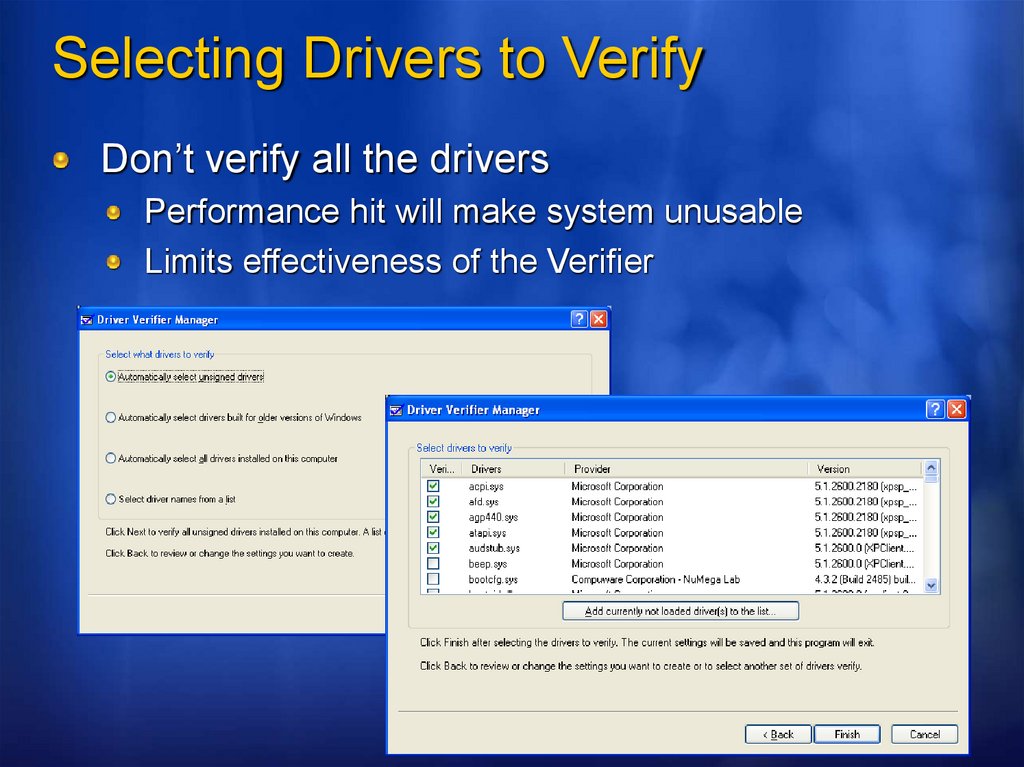
Selecting Drivers to VerifyDon’t verify all the drivers
Performance hit will make system unusable
Limits effectiveness of the Verifier
36.
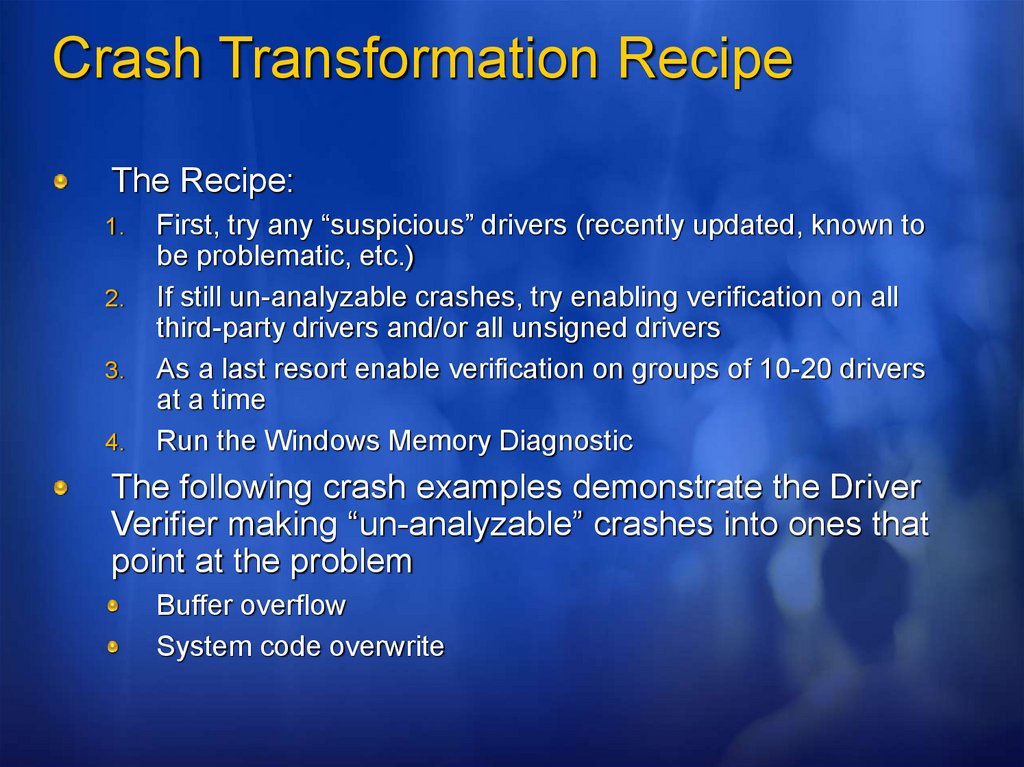
Crash Transformation RecipeThe Recipe:
1.
2.
3.
4.
First, try any “suspicious” drivers (recently updated, known to
be problematic, etc.)
If still un-analyzable crashes, try enabling verification on all
third-party drivers and/or all unsigned drivers
As a last resort enable verification on groups of 10-20 drivers
at a time
Run the Windows Memory Diagnostic
The following crash examples demonstrate the Driver
Verifier making “un-analyzable” crashes into ones that
point at the problem
Buffer overflow
System code overwrite
37.
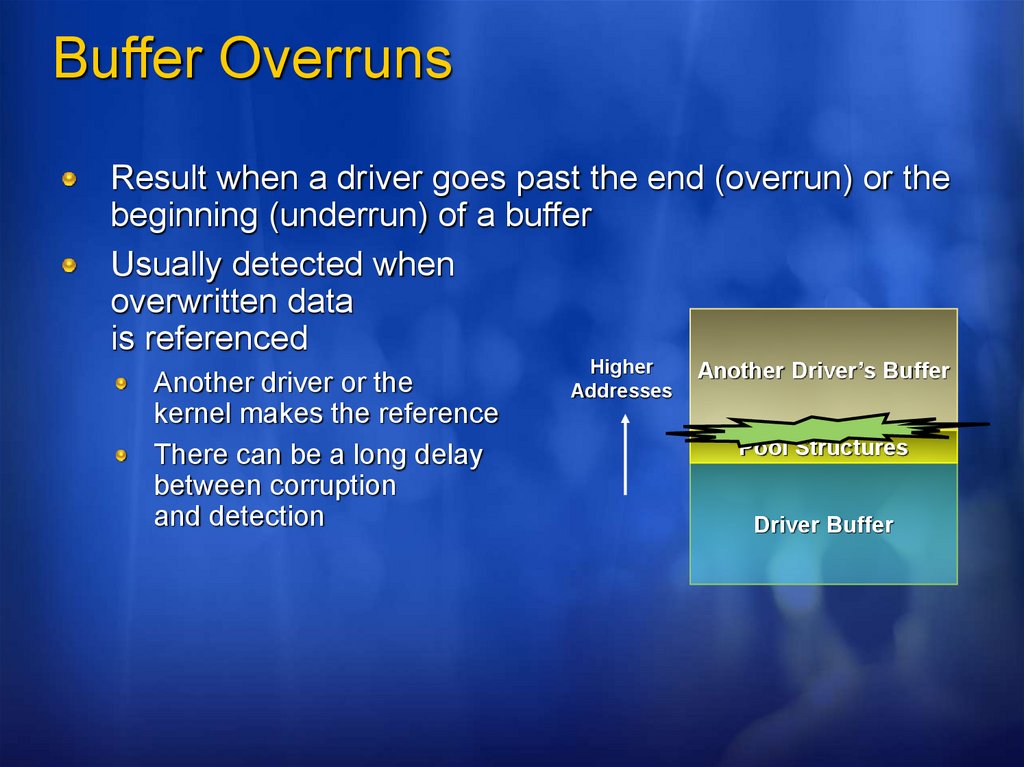
Buffer OverrunsResult when a driver goes past the end (overrun) or the
beginning (underrun) of a buffer
Usually detected when
overwritten data
is referenced
Another driver or the
kernel makes the reference
There can be a long delay
between corruption
and detection
Higher
Addresses
Another Driver’s Buffer
Pool Structures
Driver Buffer
38.
Causing a Buffer OverrunRun NotMyFault and select “Buffer Overrun”
Allocates a nonpaged pool buffer
Writes a string past the end
Note that you might have to run several times
since a crash will occur only if:
The kernel references the corrupted pool structures
A driver references the corrupted buffer
The crash tells you what happened, but not why
39.
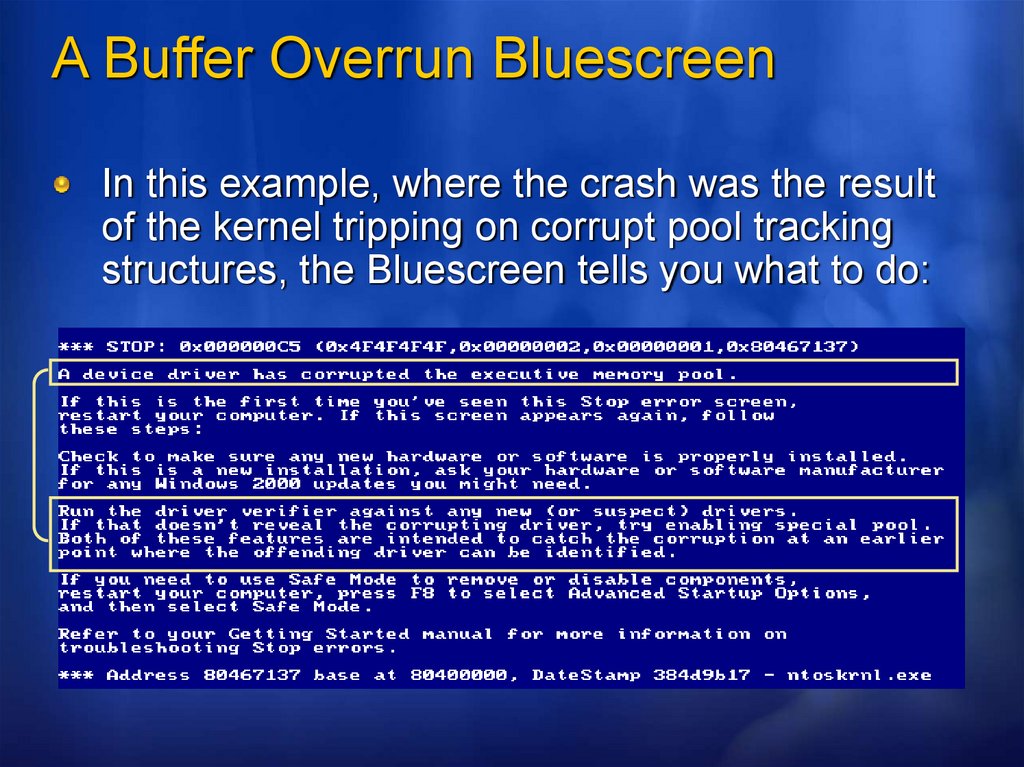
A Buffer Overrun BluescreenIn this example, where the crash was the result
of the kernel tripping on corrupt pool tracking
structures, the Bluescreen tells you what to do:
40.
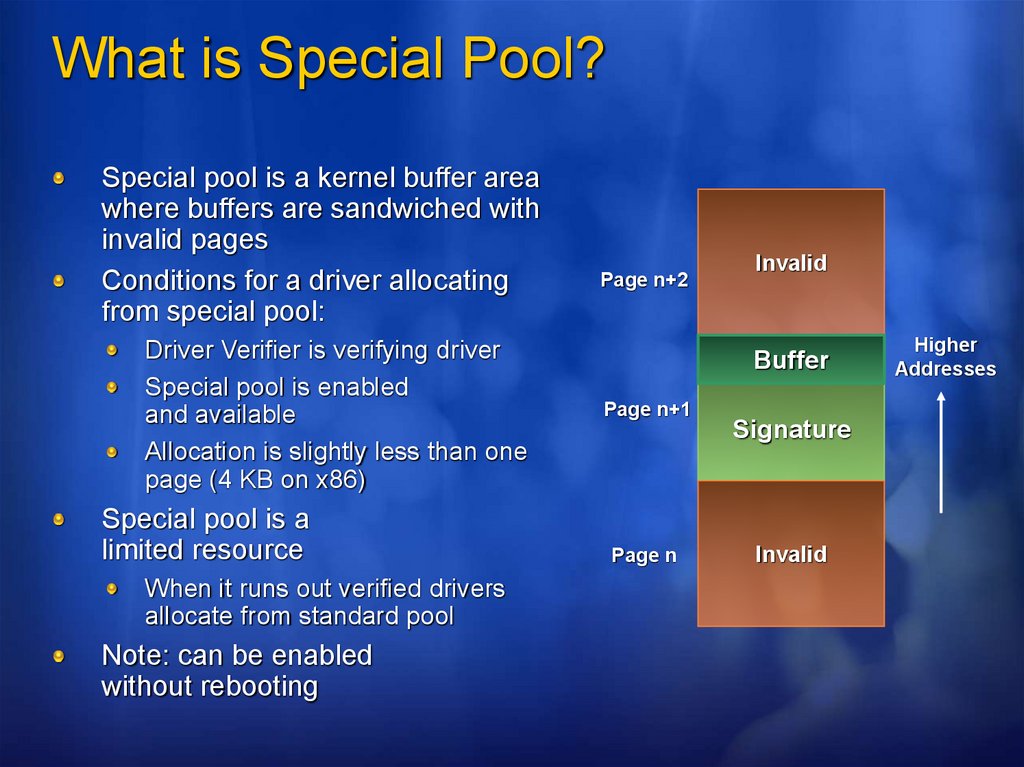
What is Special Pool?Special pool is a kernel buffer area
where buffers are sandwiched with
invalid pages
Conditions for a driver allocating
from special pool:
Driver Verifier is verifying driver
Special pool is enabled
and available
Allocation is slightly less than one
page (4 KB on x86)
Special pool is a
limited resource
When it runs out verified drivers
allocate from standard pool
Note: can be enabled
without rebooting
Page n+2
Invalid
Buffer
Page n+1
Page n
Signature
Invalid
Higher
Addresses
41.
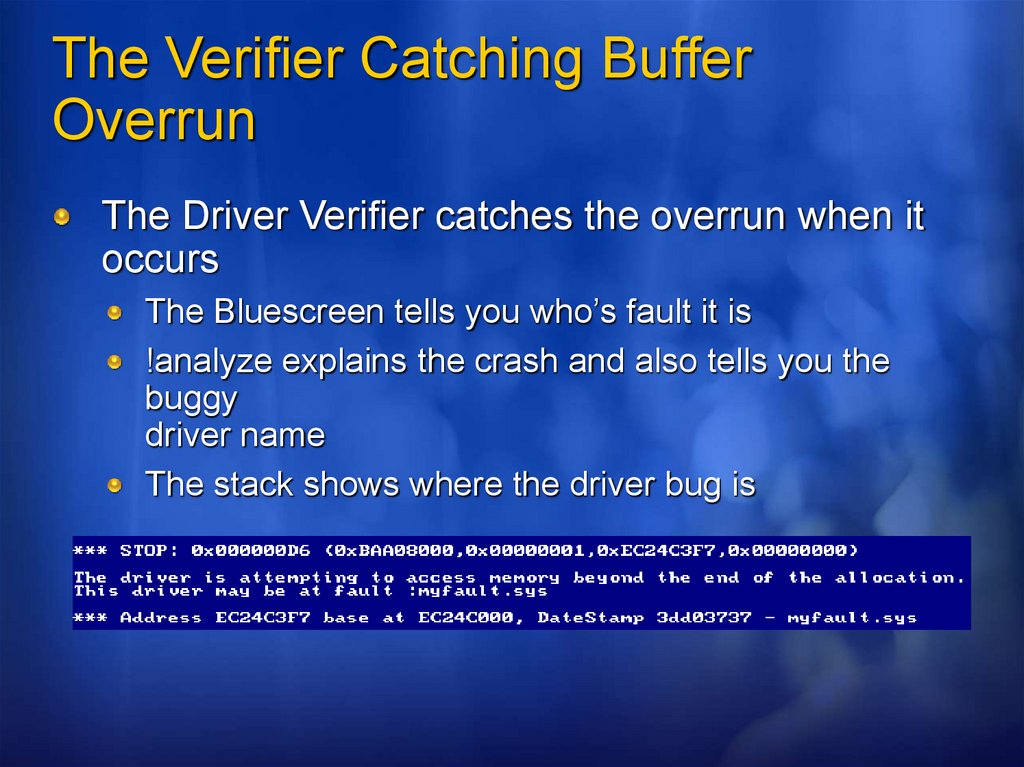
The Verifier Catching BufferOverrun
The Driver Verifier catches the overrun when it
occurs
The Bluescreen tells you who’s fault it is
!analyze explains the crash and also tells you the
buggy
driver name
The stack shows where the driver bug is
42.
Code OverwritesCaused when a bug results in a wild pointer
A wild pointer that points at invalid memory is easily detected
A wild pointer that points at data is similar to buffer overrun
Might not cause a problem for a long time
Crash makes it look like its something else’s fault
System code write protection catches code overwrite, but
it’s not on if:
It’s a Windows 2000 system with > 127 MB memory
It’s a Windows XP or Windows 2003 Server system
with > 255 MB
In other words, it’s off on most systems
43.
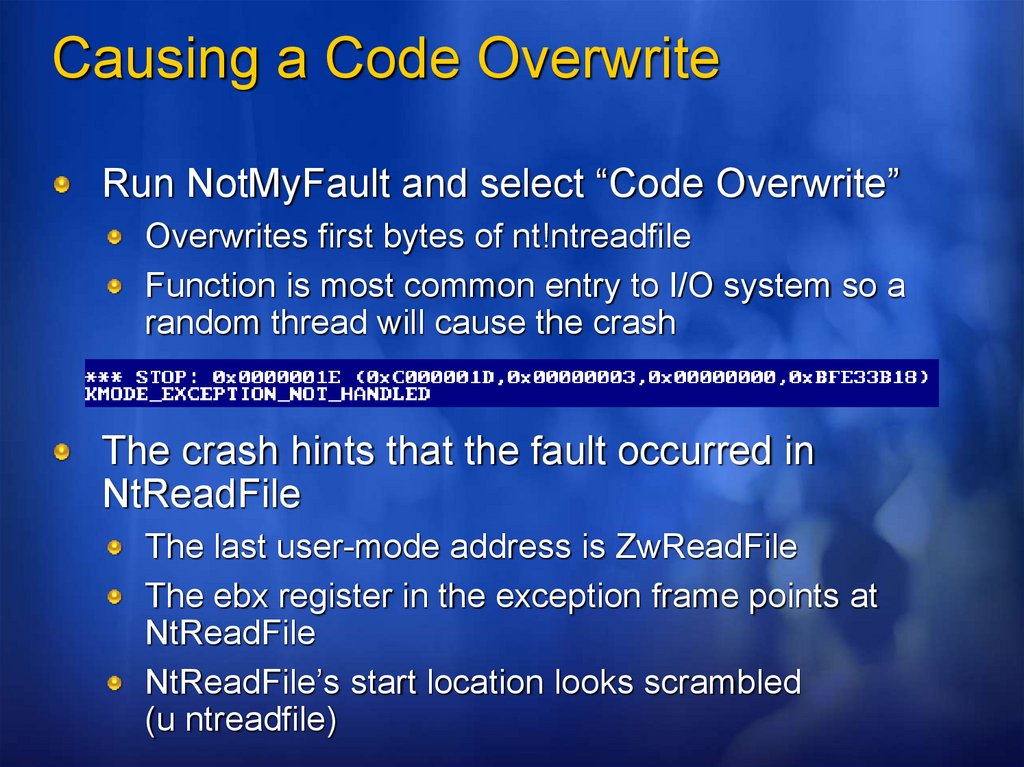
Causing a Code OverwriteRun NotMyFault and select “Code Overwrite”
Overwrites first bytes of nt!ntreadfile
Function is most common entry to I/O system so a
random thread will cause the crash
The crash hints that the fault occurred in
NtReadFile
The last user-mode address is ZwReadFile
The ebx register in the exception frame points at
NtReadFile
NtReadFile’s start location looks scrambled
(u ntreadfile)
44.
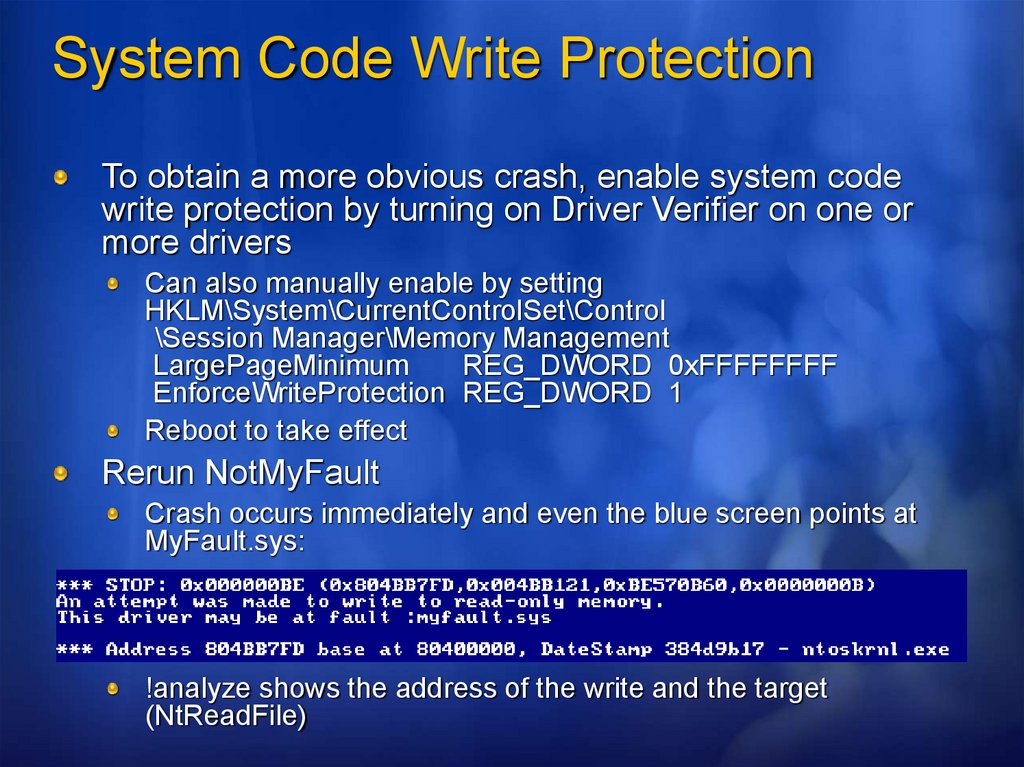
System Code Write ProtectionTo obtain a more obvious crash, enable system code
write protection by turning on Driver Verifier on one or
more drivers
Can also manually enable by setting
HKLM\System\CurrentControlSet\Control
\Session Manager\Memory Management
LargePageMinimum
REG_DWORD 0xFFFFFFFF
EnforceWriteProtection REG_DWORD 1
Reboot to take effect
Rerun NotMyFault
Crash occurs immediately and even the blue screen points at
MyFault.sys:
!analyze shows the address of the write and the target
(NtReadFile)
45.
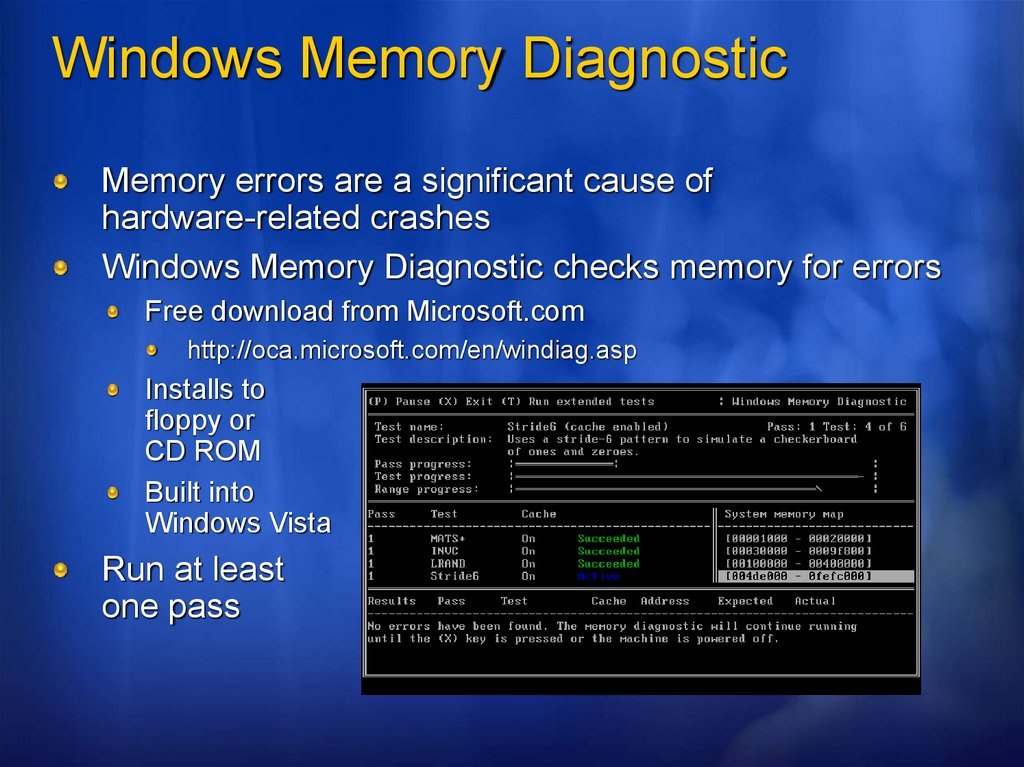
Windows Memory DiagnosticMemory errors are a significant cause of
hardware-related crashes
Windows Memory Diagnostic checks memory for errors
Free download from Microsoft.com
http://oca.microsoft.com/en/windiag.asp
Installs to
floppy or
CD ROM
Built into
Windows Vista
Run at least
one pass
46.
OutlineCrash dumps and tools
Analysis basics
IRQLs
Stacks
Analyzing an “easy” crash
Un-analyzable crashes
Crash transformation
Buffer overrun
Code overwrite
Windows Memory Diagnostic
Manual analysis
Stack trashes
Hung Systems
When there is no crash dump
47.
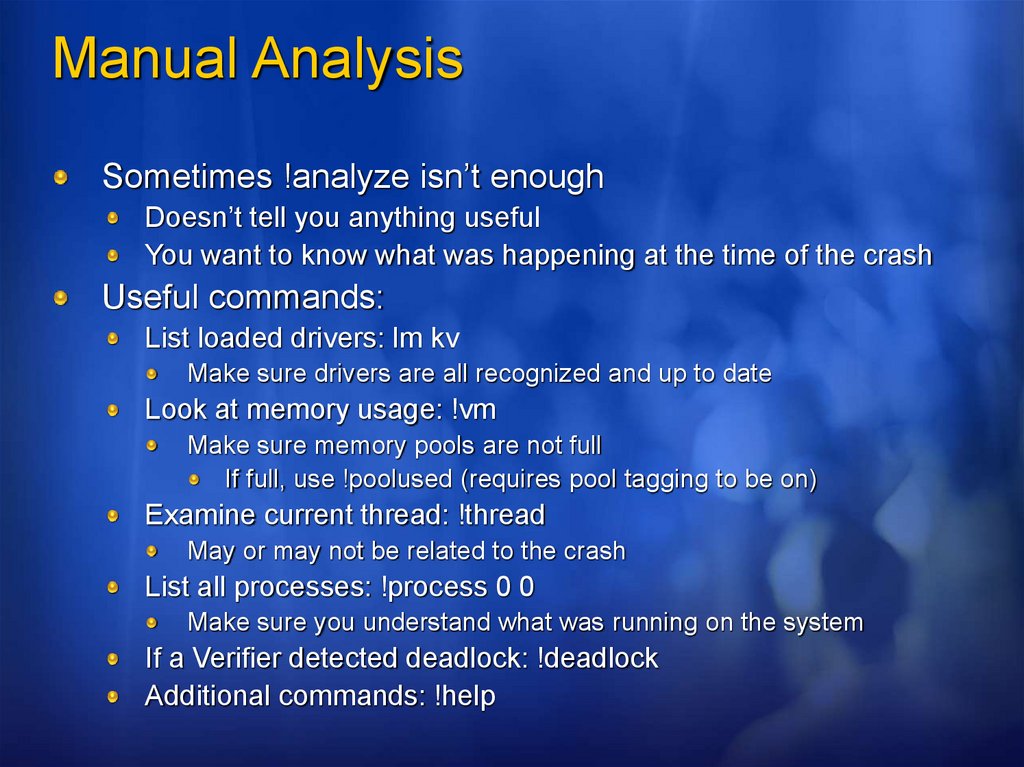
Manual AnalysisSometimes !analyze isn’t enough
Doesn’t tell you anything useful
You want to know what was happening at the time of the crash
Useful commands:
List loaded drivers: lm kv
Make sure drivers are all recognized and up to date
Look at memory usage: !vm
Make sure memory pools are not full
If full, use !poolused (requires pool tagging to be on)
Examine current thread: !thread
May or may not be related to the crash
List all processes: !process 0 0
Make sure you understand what was running on the system
If a Verifier detected deadlock: !deadlock
Additional commands: !help
48.
Stack TrashingAn example of a crash requiring manual analysis
is a stack trash
Stack trashes have several possible causes:
A driver pushing things on the stack causes the
stack to overflow
A driver overruns a stack-allocated buffer
Usually results in garbage code being executed
(KMODE_EXCEPTION_NOT_HANDLED)
Driver Verifier can’t determine cause
Since the stack is corrupted, analysis is especially
hard
49.
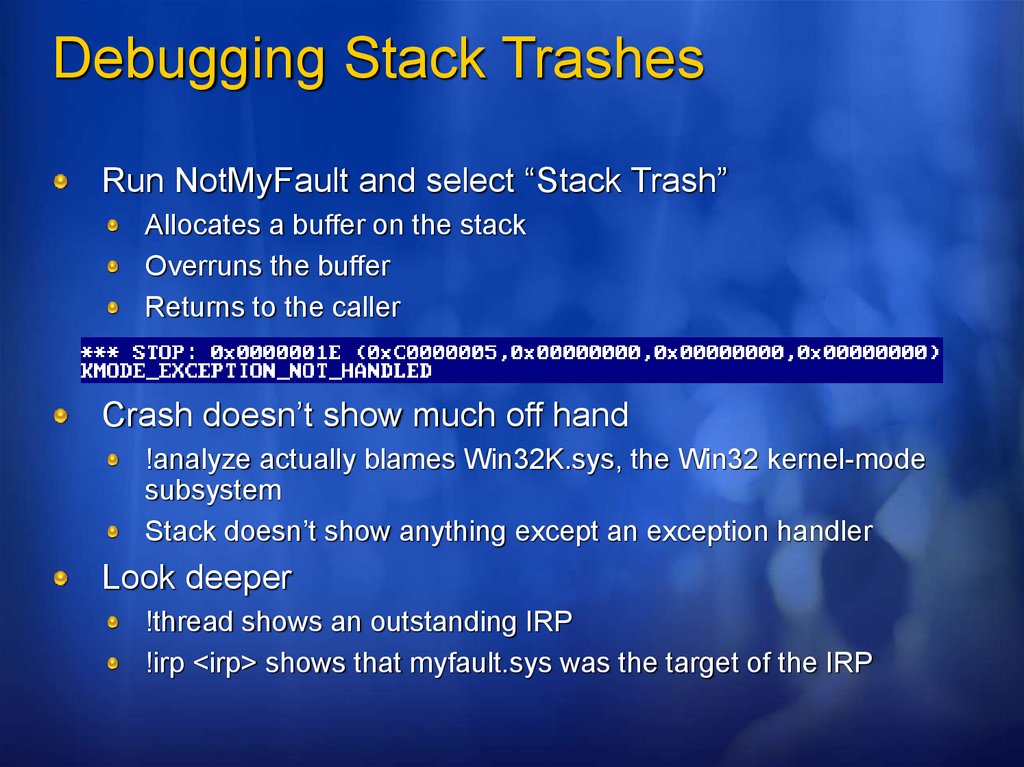
Debugging Stack TrashesRun NotMyFault and select “Stack Trash”
Allocates a buffer on the stack
Overruns the buffer
Returns to the caller
Crash doesn’t show much off hand
!analyze actually blames Win32K.sys, the Win32 kernel-mode
subsystem
Stack doesn’t show anything except an exception handler
Look deeper
!thread shows an outstanding IRP
!irp <irp> shows that myfault.sys was the target of the IRP
50.
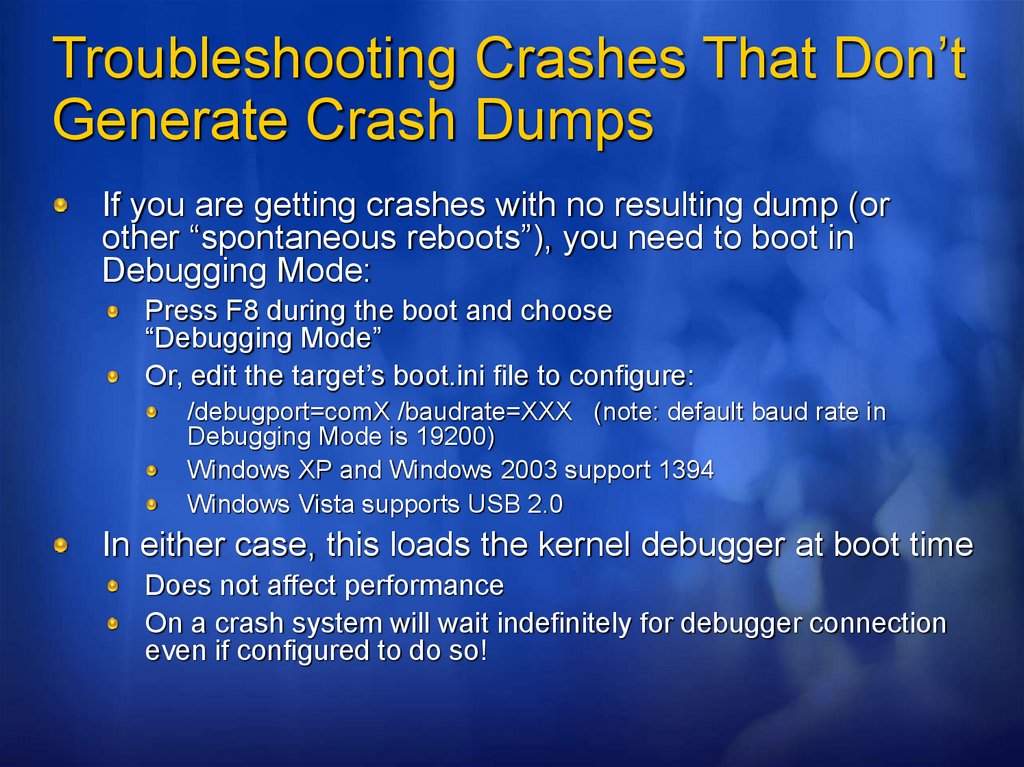
Troubleshooting Crashes That Don’tGenerate Crash Dumps
If you are getting crashes with no resulting dump (or
other “spontaneous reboots”), you need to boot in
Debugging Mode:
Press F8 during the boot and choose
“Debugging Mode”
Or, edit the target’s boot.ini file to configure:
/debugport=comX /baudrate=XXX (note: default baud rate in
Debugging Mode is 19200)
Windows XP and Windows 2003 support 1394
Windows Vista supports USB 2.0
In either case, this loads the kernel debugger at boot time
Does not affect performance
On a crash system will wait indefinitely for debugger connection
even if configured to do so!
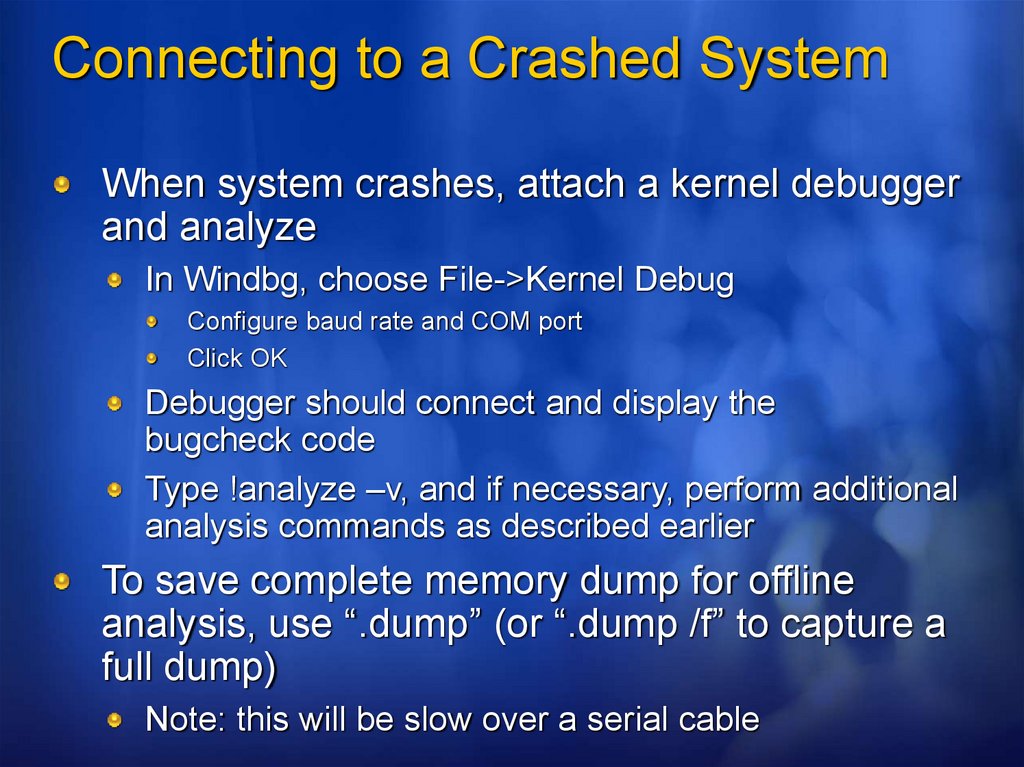
51.
Connecting to a Crashed SystemWhen system crashes, attach a kernel debugger
and analyze
In Windbg, choose File->Kernel Debug
Configure baud rate and COM port
Click OK
Debugger should connect and display the
bugcheck code
Type !analyze –v, and if necessary, perform additional
analysis commands as described earlier
To save complete memory dump for offline
analysis, use “.dump” (or “.dump /f” to capture a
full dump)
Note: this will be slow over a serial cable
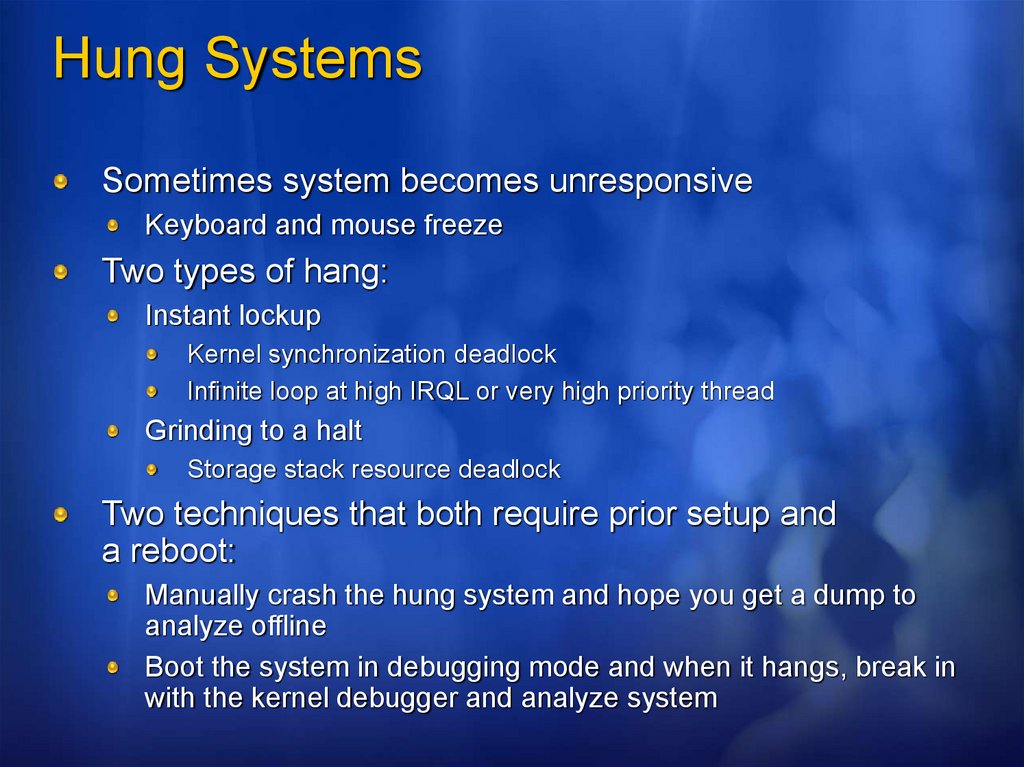
52.
Hung SystemsSometimes system becomes unresponsive
Keyboard and mouse freeze
Two types of hang:
Instant lockup
Kernel synchronization deadlock
Infinite loop at high IRQL or very high priority thread
Grinding to a halt
Storage stack resource deadlock
Two techniques that both require prior setup and
a reboot:
Manually crash the hung system and hope you get a dump to
analyze offline
Boot the system in debugging mode and when it hangs, break in
with the kernel debugger and analyze system
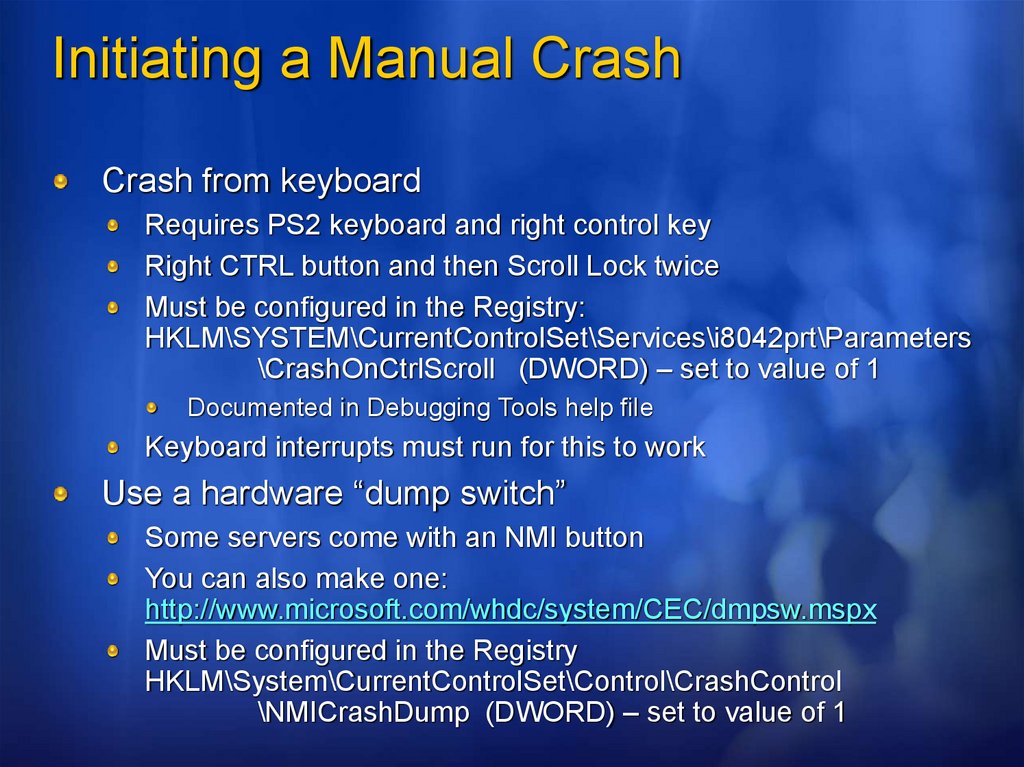
53.
Initiating a Manual CrashCrash from keyboard
Requires PS2 keyboard and right control key
Right CTRL button and then Scroll Lock twice
Must be configured in the Registry:
HKLM\SYSTEM\CurrentControlSet\Services\i8042prt\Parameters
\CrashOnCtrlScroll (DWORD) – set to value of 1
Documented in Debugging Tools help file
Keyboard interrupts must run for this to work
Use a hardware “dump switch”
Some servers come with an NMI button
You can also make one:
http://www.microsoft.com/whdc/system/CEC/dmpsw.mspx
Must be configured in the Registry
HKLM\System\CurrentControlSet\Control\CrashControl
\NMICrashDump (DWORD) – set to value of 1
54.
Breaking into a Hung SystemInstead of crashing you can boot in debugging
mode and break in when it hangs
After the hang, connect the host debugger
system to the target
Run WinDbg (or KD)
Press Ctrl-C (or click Debug->Break) – this breaks into
target system
55.
Analyzing a HangThen attempt to determine reason for hang. (This
is the hard part.)
Use !thread to see what’s running– check the stack
Check each CPU by using the ~ command, for example, ~0,
~1
Use !locks to look at possible deadlocks
Use !irql to see previous IRQL (Windows Server 2003
and later)
If you can’t figure it out but want to save it for
later analysis:
Use .crash to force a crash
Or .dump to save the current state of the system in a
dump file
This can also be done with LiveKD (free from Sysinternals) on
a
live system
56.
Generating a Hung SystemEnable keyboard-initiated manual crash
and reboot
Run Notmyfault
Select “Hang” and press Do Bug
On reboot, open dump and look at
current thread
!thread
Remember to check each CPU of a SMP: ~0, ~1, etc.
Try to determine reason for hang
57.
Analyzing a “Sick” SystemSometimes a system is still responsive, but you
know that something is wrong with it
You want to look at its kernel state, but…
You don’t want to take it off line by crashing it or
connecting a debugger to it
You can get a “dump” of a live system with
LiveKd (free download from Sysinternals.com)
Use it to run Windbg or Kd
Use .dump to snapshot live system
58.
The Bluescreen Screen SaverScare your enemies and fool your friends with
the Sysinternals Bluescreen Screen Saver
Remotely execute it (requires admin privilege on
remote system):
psexec –i –d –c “sysInternals bluescreen.scr” /s
Be careful, your job may be on the line!
59.
More InformationWindows Internals, 4th Edition – Chapter 10: Crash
Dump Analysis
The help file which is installed with Debugging Tools
for Windows
Knowledge Base Articles
http://www.microsoft.com/ddk/debugging
Other books:
http://www.microsoft.com/ddk/newbooks.asp
The debugger team wants your feedback and bug reports
windbgfb@microsoft.com
microsoft.public.windbg newsgroup
60.
ResourcesTechnical Chats and Webcasts
http://www.microsoft.com/communities/chats/default.mspx
http://www.microsoft.com/usa/webcasts/default.asp
Microsoft Learning and Certification
http://www.microsoft.com/learning/default.mspx
MSDN & TechNet
http://microsoft.com/msdn
http://microsoft.com/technet
Virtual Labs
http://www.microsoft.com/technet/traincert/virtuallab/rms.mspx
Newsgroups
http://communities2.microsoft.com/
communities/newsgroups/en-us/default.aspx
Technical Community Sites
http://www.microsoft.com/communities/default.mspx
User Groups
http://www.microsoft.com/communities/usergroups/default.mspx
61.
Live from Tech·Ed WebcastSeries has Been
Brought to You by:
www.microsoft.com/hpc
62.
Fill out a sessionevaluation on
CommNet for
a chance to
Win an XBOX 360!
63.
© 2006 Microsoft Corporation. All rights reserved. Microsoft, Windows, Windows Vista and other product names are or may be registered trademarks and/or trademarks in the U.S. and/or other countries.The information herein is for informational purposes only and represents the current view of Microsoft Corporation as of the date of this presentation. Because Microsoft must respond to changing market conditions, it should not
be interpreted to be a commitment on the part of Microsoft, and Microsoft cannot guarantee the accuracy of any information provided after the date of this presentation.
MICROSOFT MAKES NO WARRANTIES, EXPRESS, IMPLIED OR STATUTORY, AS TO THE INFORMATION IN THIS PRESENTATION.