


")


")
")
")
")


 programming
 software
Similar presentations:


")

")


 Ver. 2.05")
Java Troubleshooting and Diagnostic
1. Java Troubleshooting and Diagnostic
Roman Makarevich2. Dealing with Errors
User input errors: In addition to the inevitable typos, some users like toblaze their own trail instead of following directions. Suppose, for example,
that a user asks to connect to a URL that is syntactically wrong. Your code
should check the syntax, but suppose it does not. Then the network
package will complain.
Device errors: Hardware does not always do what you want it to. The
printer may be turned off. A web page may be temporarily unavailable.
Devices will often fail in the middle of a task. For example, a printer may
run out of paper in the middle of a printout.
Physical limitations: Disks can fill up; you can run out of available memory.
Code errors: A method may not perform correctly. For example, it could
deliver wrong answers or use other methods incorrectly. Computing an
invalid array index, trying to find a nonexistent entry in a hash table, and
trying to pop an empty stack are all examples of a code error.
3. The Classification of Exceptions
4. Java Platform Debugger Architecture
5.
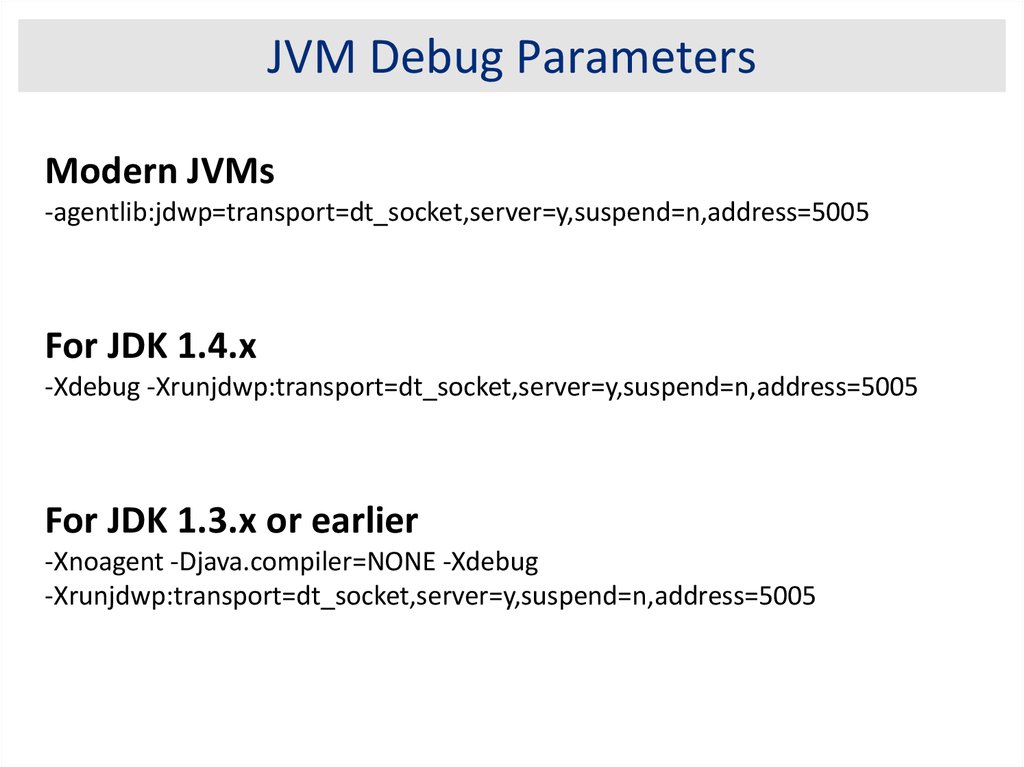
JVM Debug ParametersModern JVMs
-agentlib:jdwp=transport=dt_socket,server=y,suspend=n,address=5005
For JDK 1.4.x
-Xdebug -Xrunjdwp:transport=dt_socket,server=y,suspend=n,address=5005
For JDK 1.3.x or earlier
-Xnoagent -Djava.compiler=NONE -Xdebug
-Xrunjdwp:transport=dt_socket,server=y,suspend=n,address=5005
6. Java Platform Debugger Architecture
What is a Java stack trace?Java stack trace is a user-friendly snapshot of the Java
thread.
7. Exceptions and Performance
Java Bytecode Debugging Informationsource
Source file debugging information
lines
Line number debugging information
vars
Local variable debugging information
8. HotSpot Compilers
Thread Count (Default Configuration)9. What is a Java stack trace?
Deadlock10. Java Bytecode Debugging Information
Expert’s ChecklistFor hanging, deadlocked or frozen programs: If you think your program is
hanging, generate a stack trace and examine the threads in states MW or
CW. If the program is deadlocked then some of the system threads will
probably show up as the current threads, because there is nothing else for
the JVM to do.
For crashed, aborted programs: On UNIX look for a core file. You can
analyze this file in a native debugging tool such as gdb or dbx. Look for
threads that have called native methods. Because Java technology uses a
safe memory model, any corruption probably occurred in the native code.
Remember that the JVM also uses native code, so it may not necessarily be
a bug in your application.
For busy programs: The best course of action you can take for busy
programs is to generate frequent stack traces. This will narrow down the
code path that is causing the errors, and you can then start your
investigation from there.
11. Thread Count (Default Configuration)
Where Is My Stacktrace?12. Deadlock
How is Java Thread Dump Generated?• By sending a signal to JVM (ctrl+break)
• Using JDK 5/6 tools (jps, jstack)
• Using debugging tools (jdb, IDEs)
• Using Java API calls
• Other ad hoc tools (e.g. adaptj StackTrace)
13. Expert’s Checklist
Thread Dump By Sending a Signal to JVMUNIX:
• Ctrl+\
• kill -QUIT process_id
Windows:
• Ctrl+Break
• SendSignal process_id
Notes:
• No -Xrs in Java command line!
• SendSignal is a homemade program!
14. Where Is My Stacktrace?
Thread Dump Using JDK 5/6 toolsjps
jstack
15. How is Java Thread Dump Generated?
Thread Dump Using Debugging Toolsjava with
debug
jdb
suspend all
threads
get thread
dump
16. Thread Dump By Sending a Signal to JVM
Using a Debuggerthreads [tHReadgroup]
Lists threads
clear class:line
Clears a breakpoint
thread tHRead_id
Sets default thread
step
Executes the current line, stepping inside calls
suspend [tHRead_id(s)]
Suspends threads (default: all)
stepi
Executes the current instruction
resume [tHRead_id(s)]
Resumes threads (default: all)
step up
Executes until the end of the current method
where [thread_id] or all
Dumps a thread's stack
next
Executes the current line, stepping over calls
wherei [tHRead_id] or all
Dumps a thread's stack and program
counter info
cont
Continues execution from breakpoint
tHReadgroups
Lists thread groups
catch class
Breaks for the specified exception
tHReadgroup name
Sets current thread group
ignore class
Ignores the specified exception
print name(s)
Prints object or field
list [line]
Prints source code
dump name(s)
Prints all object information
use [path]
Displays or changes the source path
locals
Prints all current local variables
memory
Reports memory usage
classes
Lists currently known classes
gc
Frees unused objects
methods class
Lists a class's methods
load class
Loads Java class to be debugged
stop in class.method
Sets a breakpoint in a method
run [class [args]]
Starts execution of a loaded Java class
stop at class:line
Sets a breakpoint at a line
!!
Repeats last command
up [n]
Moves up a thread's stack
help (or ?)
Lists commands
down [n]
Moves down a thread's stack
exit (or quit)
Exits debugger
17. Thread Dump Using JDK 5/6 tools
Using Java API calls• Throwable.printStackTrace()
• Thread.dumpStack()
• Since Java 1.5: Thread.getState()
• Since Java 1.5: Thread.getStackTrace()
• Since Java 1.5: Thread.getAllStackTraces()
18. Thread Dump Using Debugging Tools
Thread Dump Analyser19. Using a Debugger
IBM Thread & Monitor Dump Analyser20. Using Java API calls
IBM Thread & Monitor Dump Analyser21. Thread Dump Analyser
Thread States22. IBM Thread & Monitor Dump Analyser
Example 1: Deadlockorg.apache.log4j.Category.callAppenders():
23. IBM Thread & Monitor Dump Analyser
Example 2: Performance Issue...
at org.apache.tools.ant.DirectoryScanner.scandir(DirectoryScanner.java:1019)
at org.apache.tools.ant.DirectoryScanner.scandir(DirectoryScanner.java:1065)
at org.apache.tools.ant.DirectoryScanner.scandir(DirectoryScanner.java:1065)
at org.apache.tools.ant.DirectoryScanner.scandir(DirectoryScanner.java:1065)
at org.apache.tools.ant.DirectoryScanner.scandir(DirectoryScanner.java:1065)
at org.apache.tools.ant.DirectoryScanner.scandir(DirectoryScanner.java:1065)
at org.apache.tools.ant.DirectoryScanner.scandir(DirectoryScanner.java:1065)
at org.apache.tools.ant.DirectoryScanner.checkIncludePatterns(DirectoryScanner.java:836)
at org.apache.tools.ant.DirectoryScanner.scan(DirectoryScanner.java:808)
...
24. Determining the Thread States
JVM Memory Structure• Eden Space
• Survivor Space
• Tenured Generation
• Permanent Generation
• Code Cache
25. Thread States
Java Heap Memory & Tuning Options26. Thread States
Heap DumpTypical information which can be found in heap dumps (depending
on the heap dump type) is:
All Objects
Class, fields, primitive values and references
All Classes
Classloader, name, super class, static fields
Garbage Collection Roots
Objects defined to be reachable by the JVM
Thread Stacks and Local Variables
The call-stacks of threads at the moment of the snapshot, and perframe information about local objects
27. Java 1.4 tools
Shallow vs. Retained HeapShallow heap is the memory consumed by one object. An object
needs 32 or 64 bits (depending on the OS architecture) per reference,
4 bytes per Integer, 8 bytes per Long, etc. Depending on the heap
dump format the size may be adjusted (e.g. aligned to 8, etc...) to
model better the real consumption of the VM.
Retained set of X is the set of objects which would be removed by GC
when X is garbage collected.
Retained heap of X is the sum of shallow sizes of all objects in the
retained set of X, i.e. memory kept alive by X.
28. Java 1.5 tools
Shallow vs. Retained Heap29. Java 1.6 tools
Shallow and retained sizes30. Debugging Performance Issues (1)
Dominator TreeAn object x dominates an object y if every path in the object graph from the start (or the
root) node to y must go through x.
The immediate dominator x of some object y is the dominator closest to the object y.
A dominator tree is built out of the object graph.
31. Debugging Performance Issues (2)
Garbage Collection Roots32. Debugging Performance Issues (3)
Garbage Collection RootsClass
Thread
Stack Local
JNI Local
JNI Global
Monitor Used
Held by JVM
33. Debugging Performance Issues (4)
How is Java Heap Dump Generated?1. Get Heap Dump on an OutOfMemoryError
2. Interactively Trigger a Heap Dump:
• By sending a signal to JVM (ctrl+break)
• Using JDK 5/6 tools (jps, jmap)
• Using JConsole
• Other ad hoc tools (e.g. Eclipse MAT)
34. Example 1: Deadlock
Heap Dump on an OutOfMemoryErrorjava -XX:+HeapDumpOnOutOfMemoryError MainClass
35. Example 2: Performance Issue
Heap Dump By Sending a Signal to JVMjava -XX:+HeapDumpOnCtrlBreak MainClass
+
See Thread Dump By Sending a Signal to JVM
36. JVM Memory Structure
Heap Dump Using JDK 5/6 toolsjmap -dump:format=b,file=<filename.hprof> <pid>
37. Allocated and Used Memory
Heap Dump Using JConsole38. Java Heap Memory & Tuning Options
Eclipse Memory Analyser39. Heap Dump
Example 3: Memory Leak40. Shallow vs. Retained Heap
Heap Memory Usage41. Shallow vs. Retained Heap
Memory Pool “Eden Space”42. Shallow and retained sizes
Memory Pool “Survivor Space”43. Dominator Tree
Memory Pool “Tenured Gen”44. Garbage Collection Roots
Non-Heap Memory Usage45. Garbage Collection Roots
Memory Pool “Code Cache”46. Garbage Collection Roots
Memory Pool “Perm Gen”47. How is Java Heap Dump Generated?
Max Thread Count Depends on Stack Size48. Heap Dump on an OutOfMemoryError
Max Thread Count Depends on Heap Size49. Heap Dump By Sending a Signal to JVM
Stack Depth Depends on Stack Size50. Heap Dump Using JDK 5/6 tools
Java Class Loading51. Heap Dump Using JConsole
NoClassDefFoundError vsClassNotFoundException