


 english
Similar presentations:


")
Describing Line Graphs
1. DESCRIBING LINE GRAPHS
Instructor: Ziyoda Askarova2. Linking phrases to introduce new sections of the graph
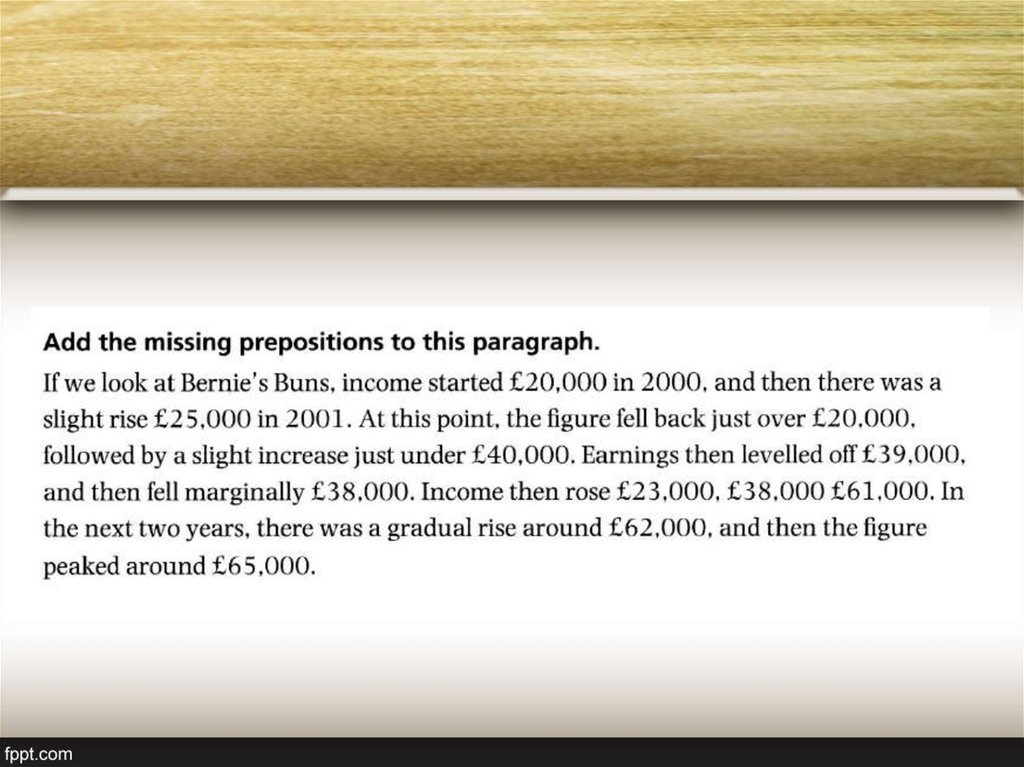
• As regards …• If we look at …
• Regarding…
• As for …
• With respect to …
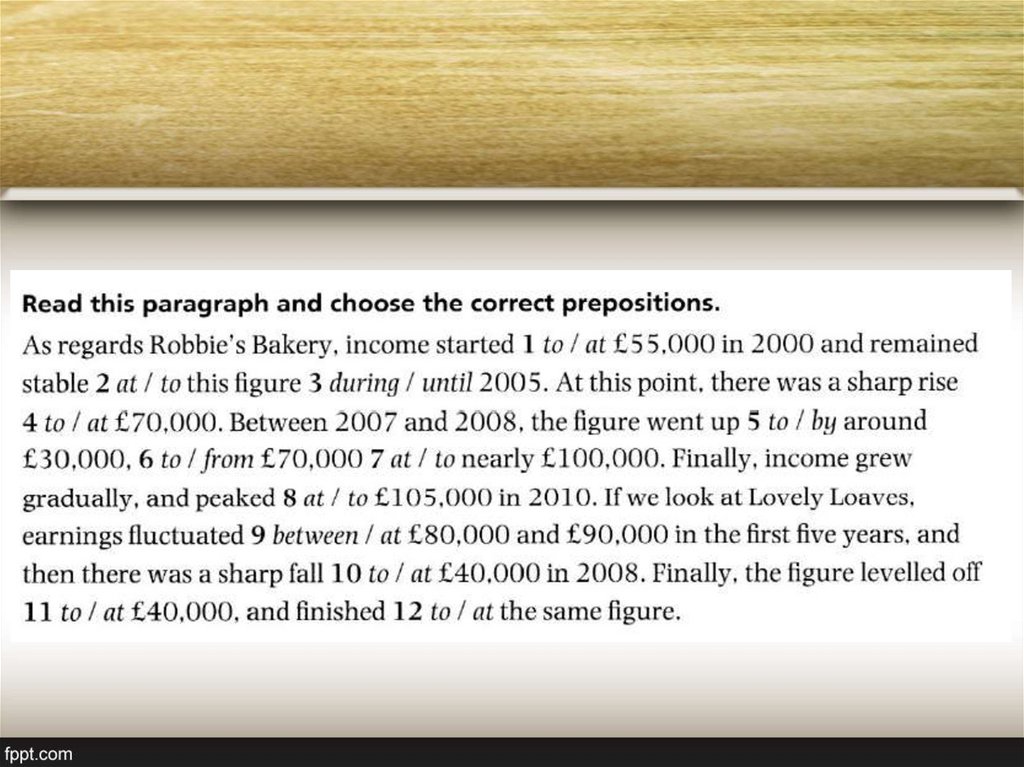
Regarding the income of Bernie’s Buns, it started at £ 20,000.
If we look at the trend for / figure for …
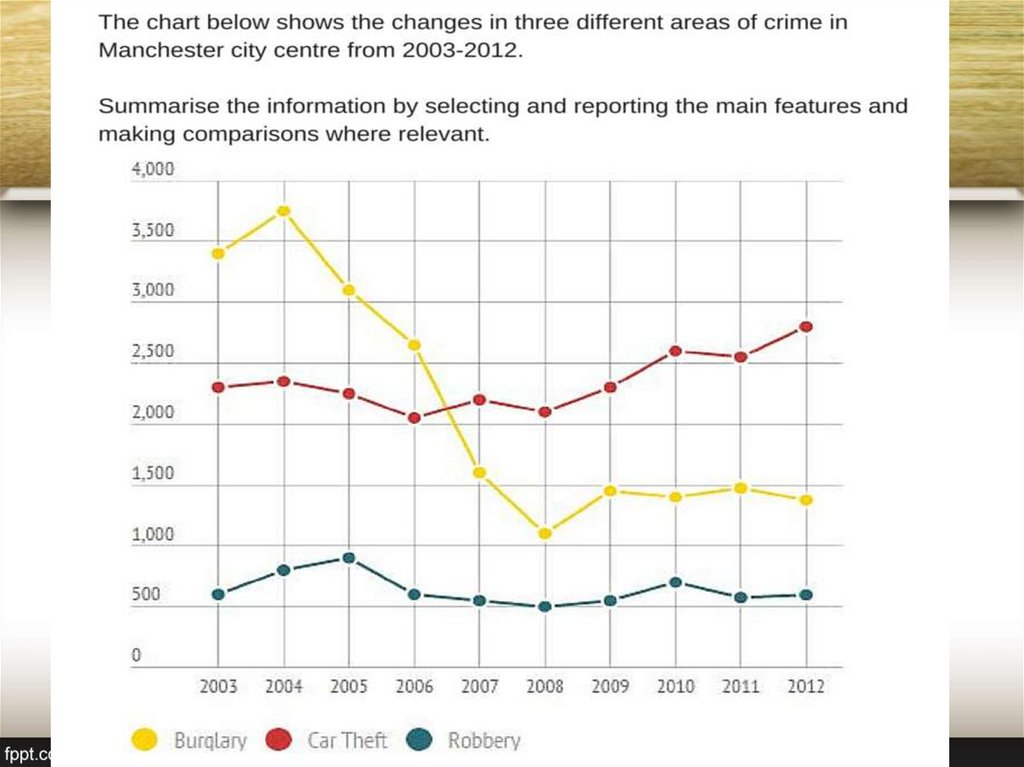
3. The line graph below shows changes in the amount and type of fast food consumed by Australian teenagers from 1975 to 2000.
Summarize the information by selecting and reporting the mainfeatures and make comparisons where relevant.
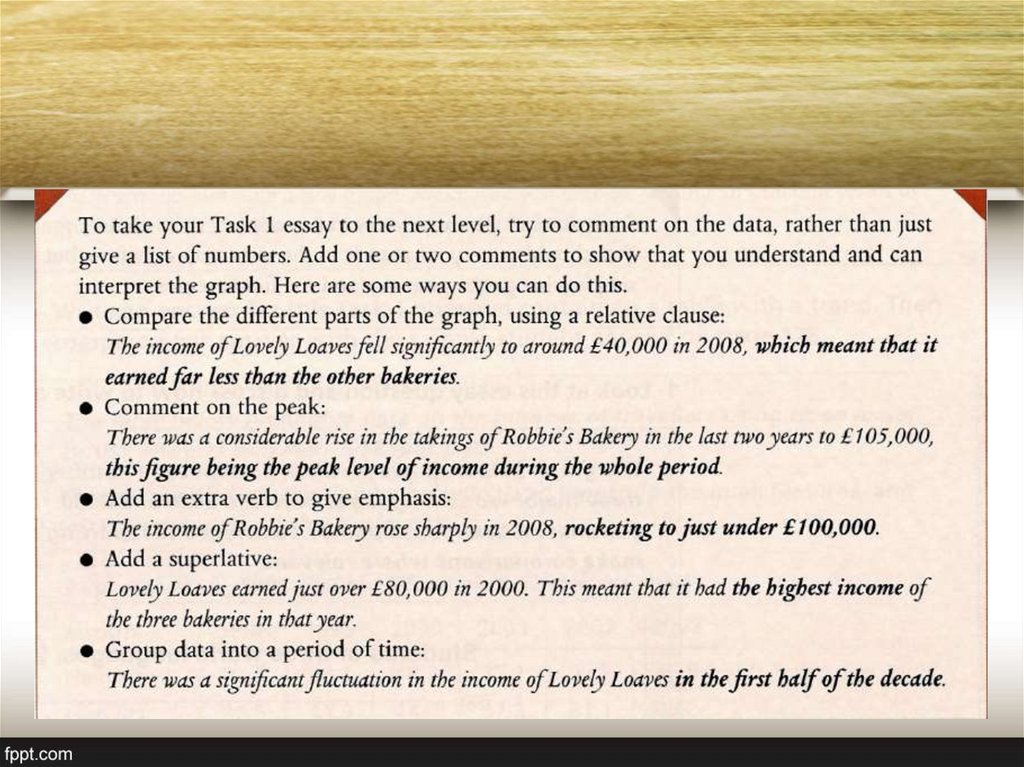
4. Making complex structures
1. Subject + verb + adverb:Sales of DVDs in the UK rose sharply between 2001 and 2004.
2. There + be + a/an + adjective + noun + in + noun …
There was a sharp rise in the number of sales in the UK between 2001
and 2004.
3. Subject + experienced / saw / witnessed + a/an + adjective + noun:
Sales of DVDs experienced a sharp rise in the UK between 2001 and
2004.
4. Time, + subject + verb + adverb or Subject + experienced + a/an +
adj. + noun:
Between 2001 and 2004, sales of DVDs rose sharply in the UK.
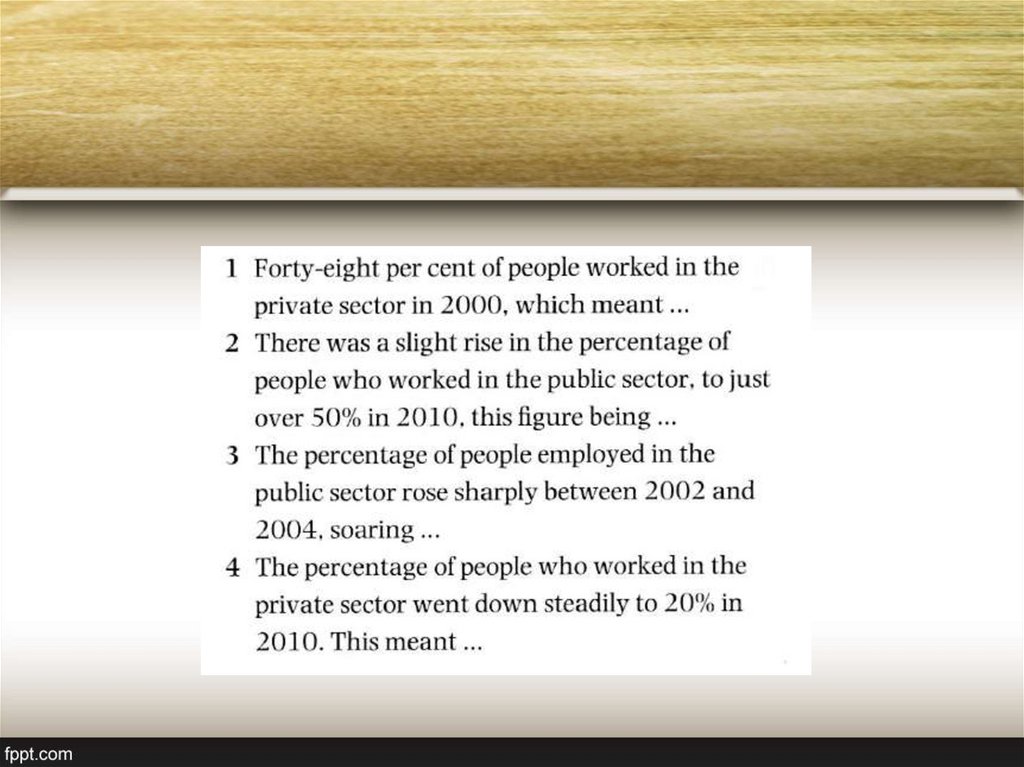
5. Practice
• Average income in Europe grew steadily between 1998 and2004.
• The income of Robbie’s Bakery witnessed a considerable rise
in 2008.
6. The line graph below shows changes in the amount and type of fast food consumed by Australian teenagers from 1975 to 2000.
Summarize the information by selecting and reporting the mainfeatures and make comparisons where relevant.
7.
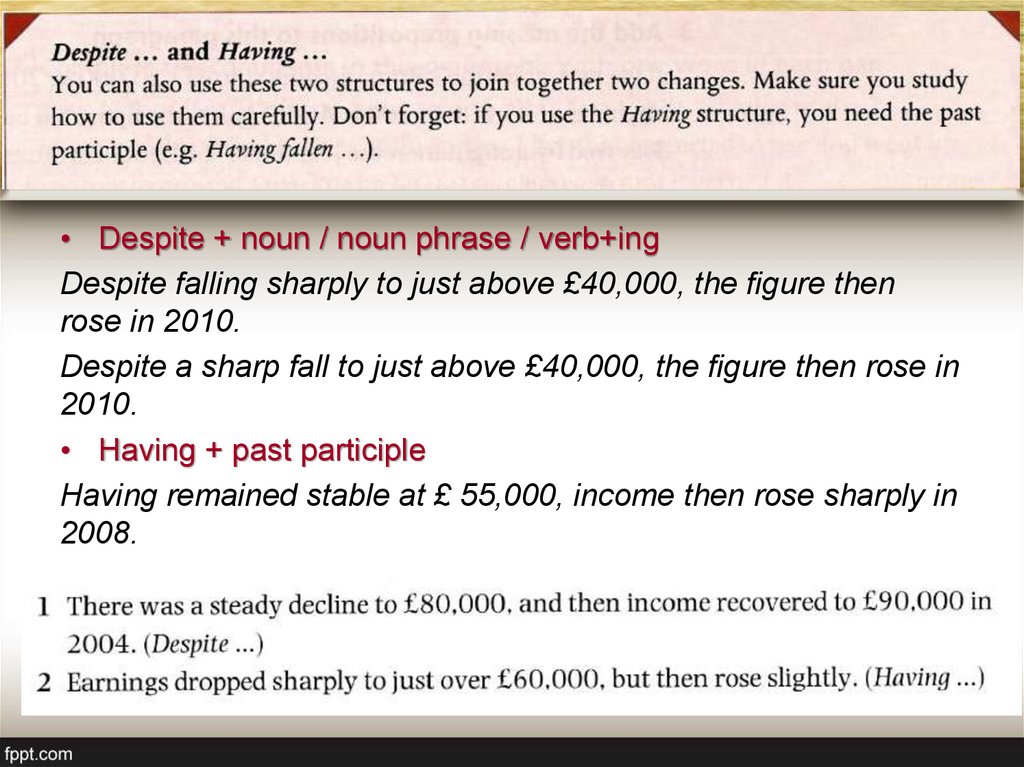
• Despite + noun / noun phrase / verb+ingDespite falling sharply to just above £40,000, the figure then
rose in 2010.
Despite a sharp fall to just above £40,000, the figure then rose in
2010.
• Having + past participle
Having remained stable at £ 55,000, income then rose sharply in
2008.