


 english
Similar presentations:


Bar charts. Line graphs
1.
LevelLesson
Topics
IELTS
Writing task 1
Bar charts. Line graphs
2.
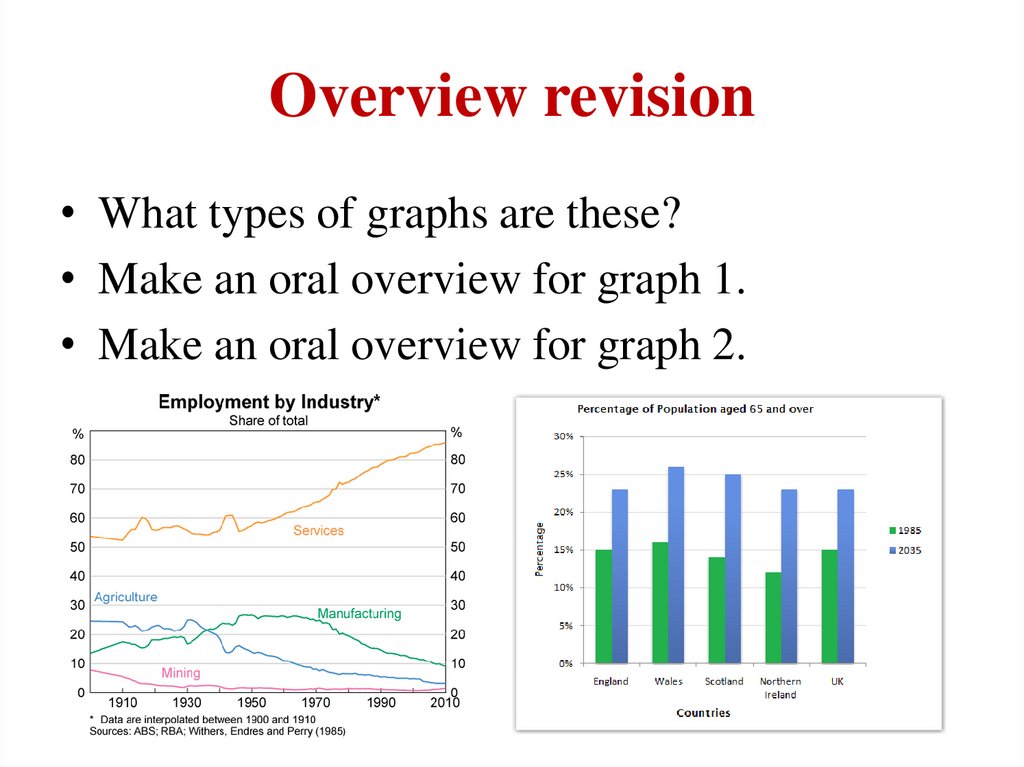
Overview revision• What types of graphs are these?
• Make an oral overview for graph 1.
• Make an oral overview for graph 2.
3.
Main body paragraph schemeSentence 1:
Introduce the first section (or group) of the graph
Ex.: Looking at the details, as regards the income of X café, it started at $40,000.
Sentence 2:
Write the general changes of the trend with suitable numeric data
Ex.: Subsequently, there was a steady rise to $55,000 which was then followed by a
considerable fall by almost $30,000.
Sentence 3:
Introduce the next section (or group) of the graph
Ex.: As for Y café, its income had a similar trend.
Sentence 4:
Write the general changes of the trend with suitable numeric data
(Compare the trend and rates with the first section)
Ex.: Having remained stable at approximately $35,000, the income of Y cafe then fell
marginally to $30,000, which meant that it earned a bit more than X café.
Repeat if needed.
4.
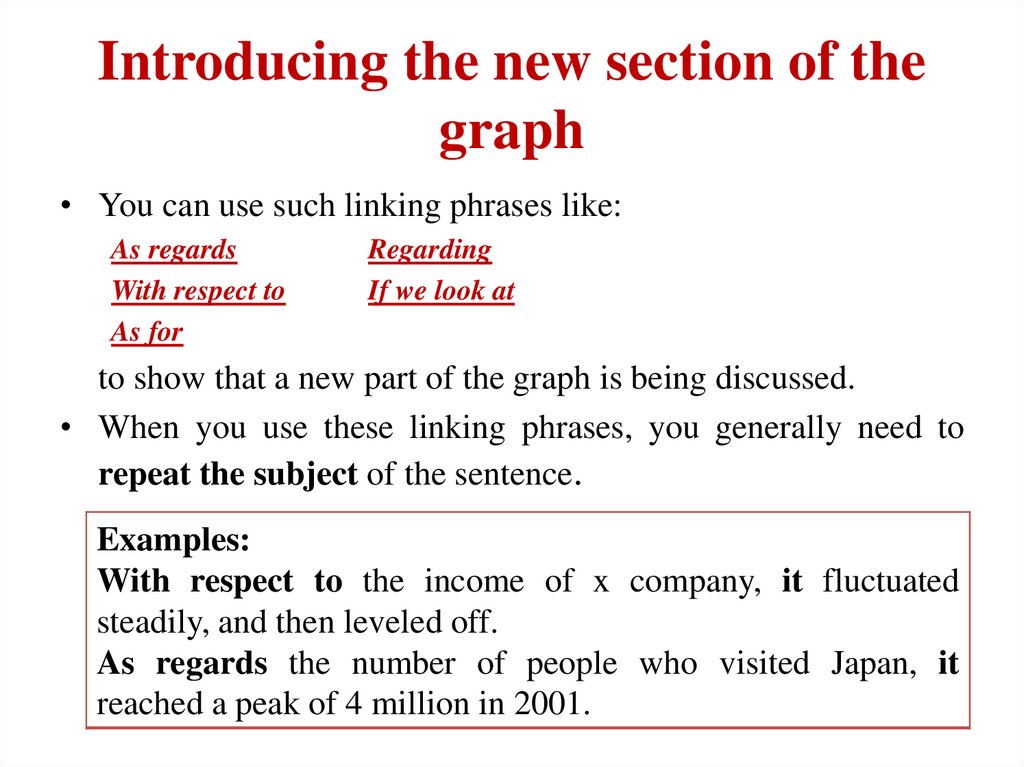
Introducing the new section of thegraph
• You can use such linking phrases like:
As regards
With respect to
As for
Regarding
If we look at
to show that a new part of the graph is being discussed.
• When you use these linking phrases, you generally need to
repeat the subject of the sentence.
Examples:
With respect to the income of x company, it fluctuated
steadily, and then leveled off.
As regards the number of people who visited Japan, it
reached a peak of 4 million in 2001.
5.
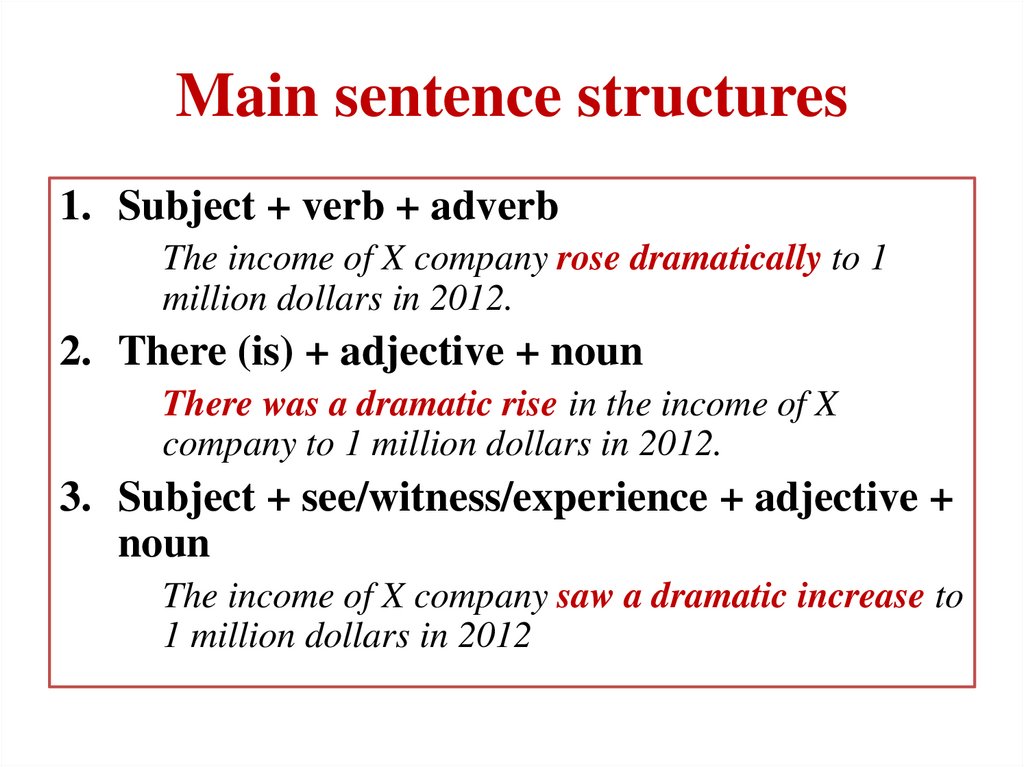
Main sentence structures1. Subject + verb + adverb
The income of X company rose dramatically to 1
million dollars in 2012.
2. There (is) + adjective + noun
There was a dramatic rise in the income of X
company to 1 million dollars in 2012.
3. Subject + see/witness/experience + adjective +
noun
The income of X company saw a dramatic increase to
1 million dollars in 2012
6.
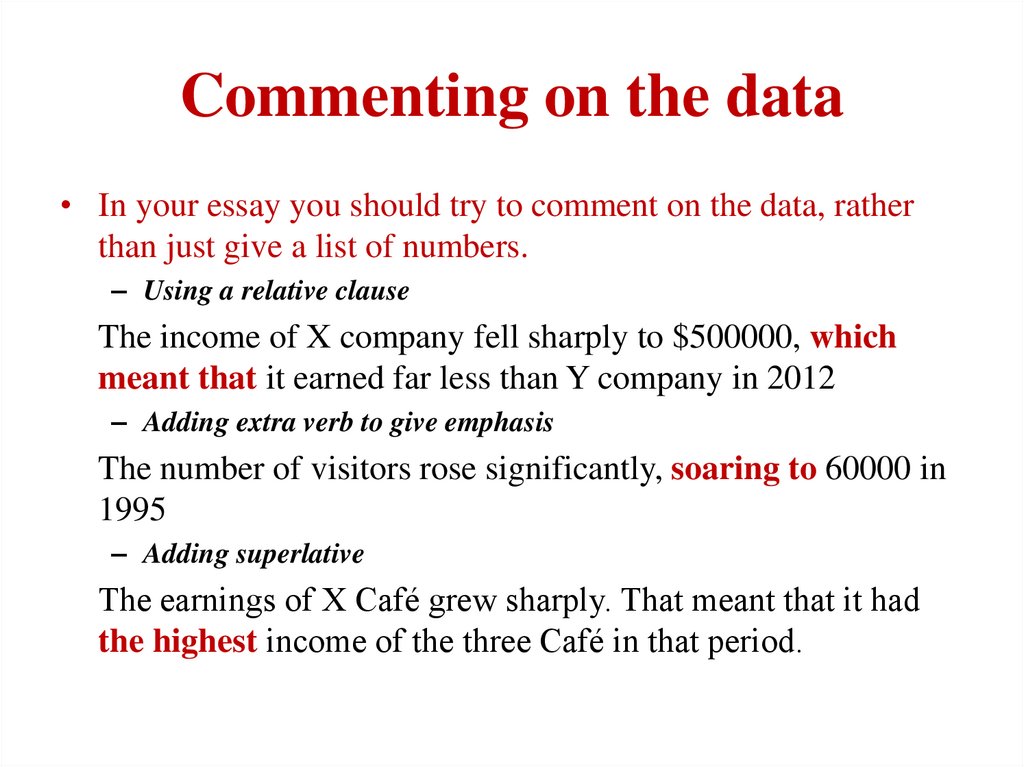
Commenting on the data• In your essay you should try to comment on the data, rather
than just give a list of numbers.
– Using a relative clause
The income of X company fell sharply to $500000, which
meant that it earned far less than Y company in 2012
– Adding extra verb to give emphasis
The number of visitors rose significantly, soaring to 60000 in
1995
– Adding superlative
The earnings of X Café grew sharply. That meant that it had
the highest income of the three Café in that period.
7.
Graph with future trend8.
Graph with future trendYou should use the tense according to the
time period covered by the graph.
• The unemployment rate is set to rise to 10000
people in 2030
• By 2030, the unemployment rate will have
risen to 10000 people.
• The unemployment rate is likely to rise to
10000 people in 2030.
9.
Common mistakesWriting About Everything
• Every Academic Task 1 question states:
• ‘Summarise the information by selecting and reporting the
main features...’.
• ‘Summarise’ means that you only mention the main points,
or as the question states ‘the main features.’
• Lots of students try to write about every piece of
information they see. This normally leads to a very
disorganized essay and often means that you run out of
time, or even worse, run over time and fail to complete Task
2.
• Always keep in mind that the task is as much about what
you do not write as you do write. This is often a case of
prioritizing.
10.
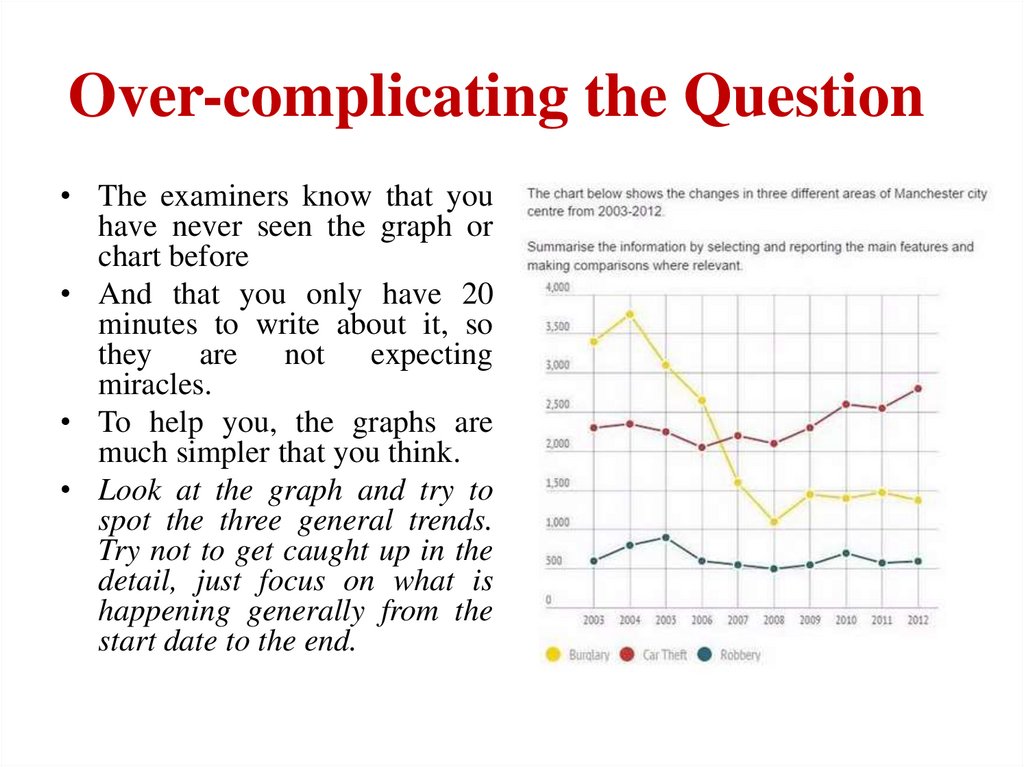
Over-complicating the Question• The examiners know that you
have never seen the graph or
chart before
• And that you only have 20
minutes to write about it, so
they are not expecting
miracles.
• To help you, the graphs are
much simpler that you think.
• Look at the graph and try to
spot the three general trends.
Try not to get caught up in the
detail, just focus on what is
happening generally from the
start date to the end.
11.
Describing Data Incorrectly• Describing general trends and changes in data requires
very specific grammar structures and vocabulary.
• The most common mistake is probably trying to use
grammar or vocabulary you are not sure about.
Remember that the grammar and meaning need to be
correct, or you risk losing marks.
• You should also avoid describing data too precisely.
– For example, if you look at the figure for ‘Car Theft’ in
2003, it would be better to say ‘approximately/around
2300’ or ‘just under 2500’ than ‘2300’ because we don’t
know what the figures are exactly from just looking at the
graph.