


 english
Similar presentations:


Academic Line Graphs/Bar Charts/Tables. Writing 1
1. Writing 1
Academic Line Graphs/Bar Charts/Tables2. Essential Information
• People doing the Academic test will write a report on a data set, map, orprocess.
• You must write 150 words or more.
• You should spend around 20 minutes on this part of the test.
• Task 1 is worth 1/3 of your total mark on the Writing test.
• You will be assessed in four areas:
• Task Achievement (25%)
• Coherence and Cohesion (25%)
• Lexical Resource (25%)
• Grammatical Range and Accuracy (25%)
• The most important thing is that you can demonstrate that you can clearly
communicate in English.
3. Types of Diagrams
BAR CHARTSLINE GRAPH
TABLES
PIE CHARTS
Method of Student Travel to College by Percentage
Walking
12
Bicycle
20
Car
25
Public Transport
43
4. Criteria
• Task Achievement• This requires the students to accurately reflect the relevant information in the graph. If you gave your
answer to a stranger, would they be able to accurately reproduce the graph? If they could, then you have
fulfilled this task.
• Coherence and Cohesion
• This part of the marking criteria judges students’ ability to produce an answer that is clear, fluent and easy
to understand. Structure, appropriate vocabulary and good grammar help to boost your score here. Good
paragraphing and appropriate use of cohesive devices can also be used to gain a higher score.
• Lexical Resource
• This section is all about vocabulary and is often the most misunderstood. It is NOT about inserting as many
long words as you can think of. It is about choosing relevant, appropriate and accurate words. You will help
your score here by using a variety of vocabulary and not simply copying the words in the question.
• Grammatical Range and Accuracy
• Obviously, you have to produce grammatically accurate sentences to do well in this section, but it is also
about using the appropriate structures. You are expected to use different structures for describing
numbers, trends and making comparisons. The most common grammar mistake students make in IELTS
task 1 is not using articles and plurals properly.
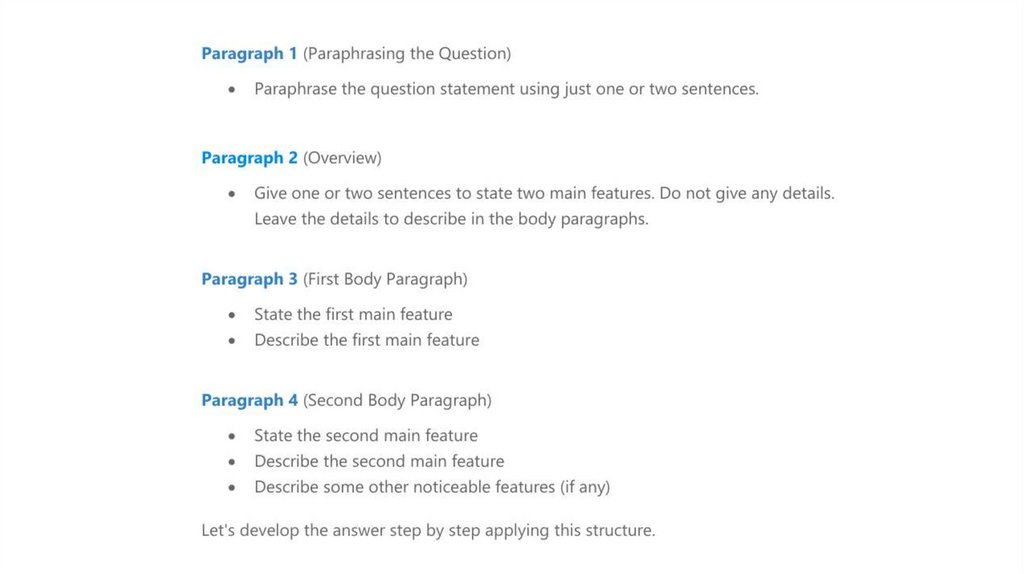
5. STRUCTURE
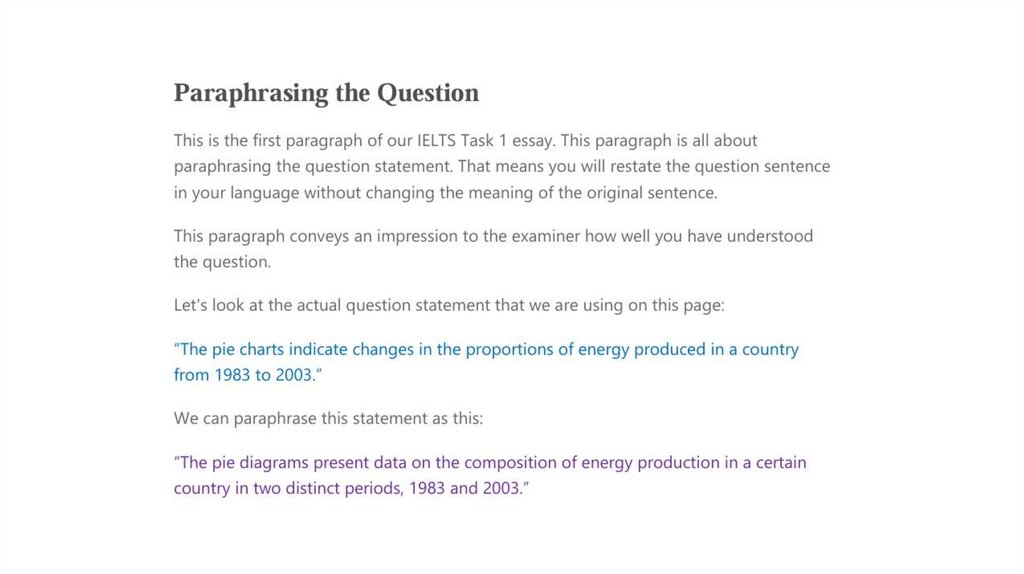
• Paragraph 1 (Introduction)• Sentence 1- Paraphrase Question
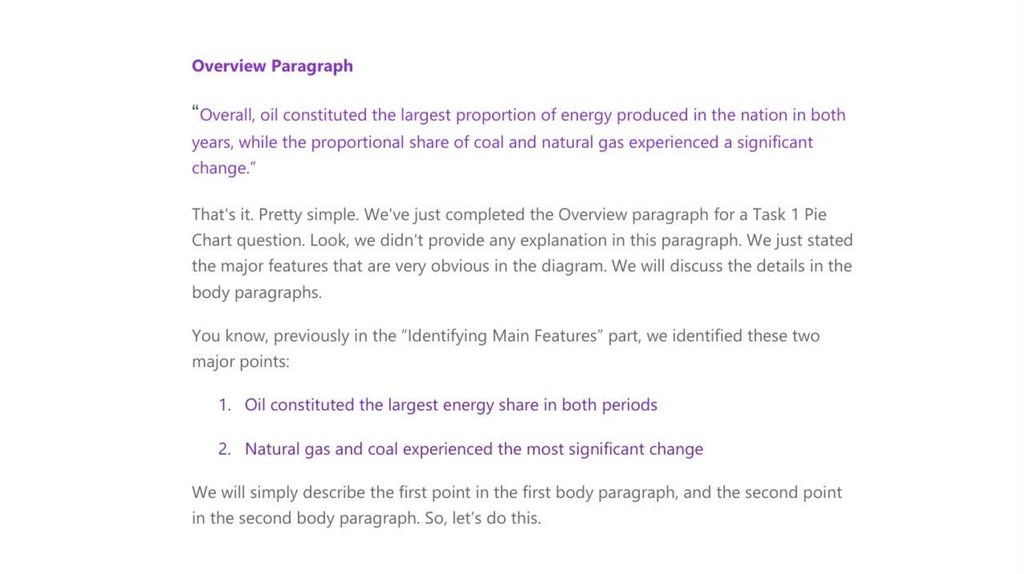
• Paragraph 2 (Overview)
• Sentence 1- Overview of main feature 1
• Sentence 2- Overview of main feature 2
• Sentence 3- Make general comparison, if appropriate
• Paragraph 3 (Details of significant feature 1)
• Sentence 1- Supporting details
• Sentence 2- Supporting details
• Sentence 3- Supporting details/comparison details, if appropriate
• Paragraph 4 (Details of significant feature 2)
• Sentence 1- Supporting details
• Sentence 2- Supporting details
• Sentence 3- Supporting details/Comparison details, if appropriate
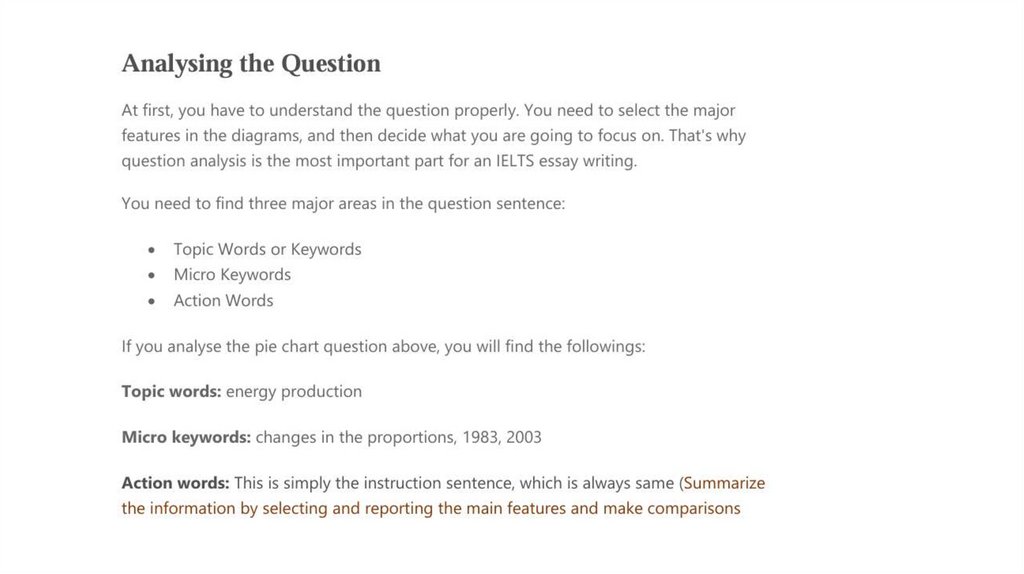
6. Pie Chart
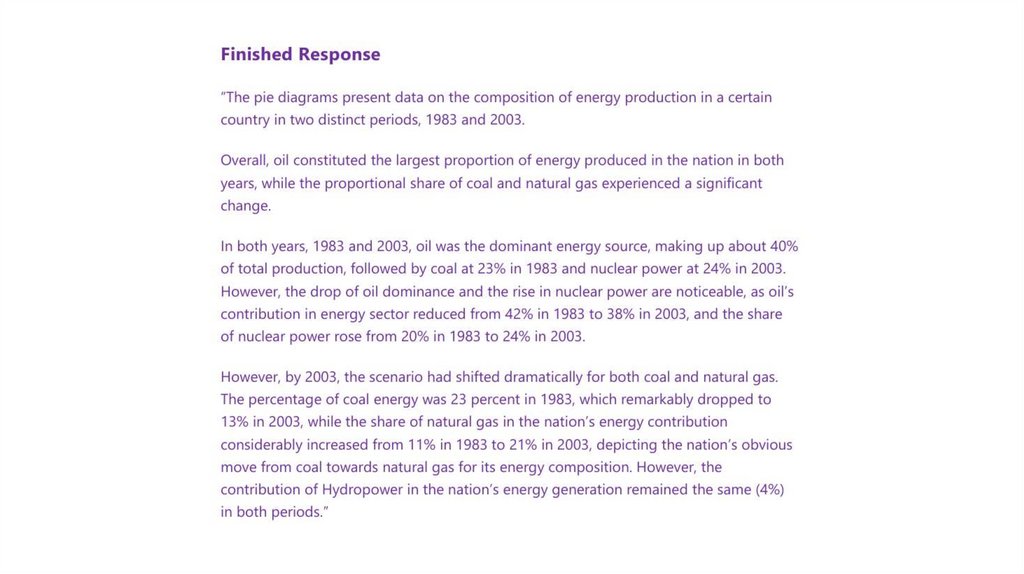
Example QuestionThe pie charts indicate changes in the
proportions of energy produced in a
country from 1983 to 2003.
Summarize the information by
selecting and reporting the main
features and make
comparisons where relevant.