")


 map a)line graph B) process B) bar chart c) pie chart d) table e) multi task")


")
 verb-> to peak/to stand+at+%+in+time b) phrase-> to reach/hit a peak+at/of+%+in+time c)noun->a peak")


 english
Similar presentations:


 IELTS PREPARATION WORKSHOP. Henry Robinson (NIS, Shymkent)")


IELTS Writing. Task 1. Overview
1. Lesson1=> IELTS Writing Task 1 (Overview)
Lesson1=> IELTS Writing Task 1(Overview)
2. IELTS Writing Task 1 Overview
information transfer essay(diagrams, processes, tables)9 general types
24 specific types
3 bands out of 9
min 150 words
20 minutes
3. Common structure for Task 1
IntroductionOverview
Body 1
Body 2
4. 1.Descriptive: 2. Analytical: A) map a)line graph B) process B) bar chart c) pie chart d) table e) multi task
Two main types of Task 11.Descriptive:
A) map
B) process
2. Analytical:
a)line graph
B) bar chart
c) pie chart
d) table
e) multi task
5. Analytical essay
Analytical essay1. overtime(past,Present,Future)
2. Fixed time
More than two years
only one year
You can use:
you can use :
trend description(Fall, rise…..)
Compare contrast
Compare Contrast
6. Writing Task 1=> Taboo
Writing Task 1=> TabooNever include extra, irrelevant information
Never try to give explanation to numbers
Do not give your opinion=> describe the diagram
based on data
Do not add any numbers in the overview except for
years and names of groups
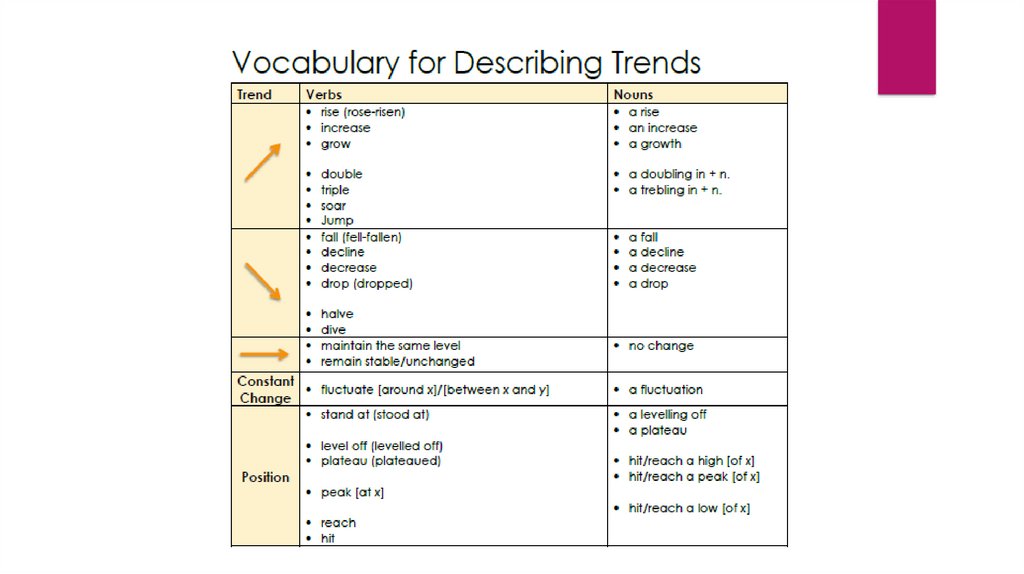
7. Basics about trends=> trends/dynamics=> patterns=> tendencies
Basics about trends=> trends/dynamics=>patterns=> tendencies
To rise
To fall
To stay unchanged
To fluctuate
8. Overtime
Three typesCovering the past
Covering the past +present
Prediction Based
Note: To describe the past event, we use Past Simple while the action
continued up to now is described through Present Perfect. Meantime, if we
aim for making projections for the future, we usually use Future Simple.
9. Tenses in Task 1=> Trend Description
Tenses in Task 1=> Trend Description1) Graph covering the past=> Use Past Simple, Past perfect
e.g. The revenue of GM from cars sold increased tremendously
from 5 million dollars in 1960 to 45 million USD in 1980, a nine-fold growth.
e.g. There was a tremendous increase in the revenue of GM received
from car sales by 40 million USD (from 4 million in 1960 to 45 million in 1980).
e.g. The GM sales registered a tremendous rise between 1960 and 1980,
reaching 45 million USD.
10. Tenses in Task 1=> Trend Description
Tenses in Task 1=> Trend Description2) Graph covering the present=> Present Perfect => to reports the trends that started
in the past and continued up to present
e.g. The amount of milk produced has increased significantly by 15,000 metric
tones since 2015, and now the figure stands at 125,000 metric tones.
e.g. There has been a significant increase in milk production since 2015.
11. Tenses in Task 1=> Trend Description
Tenses in Task 1=> Trend Description3) Prediction based graphs=> Future Simple, Passive Voice
- Future Simple
e.g. The figure will/ should reach 20000 visitors in 2030.
- Passive Voice
12. Subjects in Task 1
1) %=> the percentage, the proportion, the share, the rate+of/fore.g. the proportion of undernourished children; the percentage of undernourished children
e.g. the share of undernourished children; the rate of undernourished children
2) #=> the number of (c), the amount of (u), the quantity (u,c);
e.g. the amount of rice produced=> the quantity of rice produced
3) %/#=> the figure, the index, the indication+for
e.g. the figure for agriculture in India; the index for Indian farming; the indication for
agriculture in India
13. Examples
The percentage for / of students in/for/of ChinaThe students` percentage in China
The Chinese students percentage
The Chinese percentage for students
The percentage of China for students
The percentage of Chinese students
The Chinese figure
14. Three Trend Description Structures
1) Verb and Adverb Based: Subject+Verb+Adverb+to/by/at +Objecte.g. The number of private schools in Tashkent grew dramatically to 35 in 2018.
e.g. The electricity consumption rose by 25% over the next two years and reached a
high of 450 mega watts.
e.g. The price of beef in Tashkent fluctuated at around 60,000 soums between 2018 and
2020.
15. Three Trend Description Structures
2) Adjective and Nouns: There+to be+adjective+noun+in+subject+objecte.g. There has been a dramatic growth in the proportion of English learners in Uzbekistan
from 10% to 70% of students over the last 10 years.
e.g. There was a marginal reduction in the number of Toyota cars sold in the USA to 180,000
units in 2018.
16. Three Trend Description Structures
3) Special Verbs Based Structure: Subject+Special Verb+Adjective+NounSpecial Verbs: experience, saw, witness, go through, report, etc
e.g. The proportion of rice sales in China experienced a rapid increase to 3 million
tones in 2003.
e.g. The GM sales registered a tremendous rise between 1960 and 1980, reaching
45 million USD.
e.g. The share of people employed in the private sector witnessed a gradual
17. The” case” structure
4)Adjective+noun+was+ the case+in+ Subject+objectA substantial growth was the case in the figure for german car
manufacturing from 5% in 2010 to10% in 2015
18. Passive Stucture
5)Adjective+noun+to be+Special verb(3/ed/d)+in+Subject+Object
A sharp growth was experienced in the figure for
German car production from 5% to 10%
19.
20.
21. Time in Task 1
Introduction1. From…………….to/till/until………….
2. Between………..and………………..
3. over 20-year period from……..
4. over a decade from……..
Overview
Over the given period
Over the entire span
Over the period under discussion
22. Linking devices in IELTS Writing Task 1
First event:At first,/Initially/In the first year,/In 1999/
Middle events:
1) …and/but…
2) However/Nevertheless,
3) Then/Next,/After this,/Following this,/Afterwards,
4) This is followed by + <n/n.p>
5) …following/after which… or …which is followed by… + <n/n.p>
6) …until…after/following which…
7) …until…when…
8) …before… + <sentence or n.p.> or After + <sentence or n.p.> , …
9) during/over the next…years or …years later,
23. Approximation
1) roughly/[just] about/approximately/around+ 90%=>88%/89%/91%/92%2) almost/nearly 90%=>88%/89%
3) [just] below/under
4) [just] above/over
24. Using the right prepositions
It is important to use the right preposition when you are reporting the features. Here are someexamples to give you a basic idea of the differences:
1. Use to when describing what happened to the number:
e.g. In 2008, the rate of unemployment rose to 10%.
2. Use by when describing the amount of change between two numbers:
e.g. In 2009, the rate of unemployment fell by 2% (from 10% to 8%).
3. Use with to give the idea of 'having' the number:
e.g. He won the election with 52% of the vote.
4. Use at to add the number on the end of a sentence or to indicate the position:
e.g. Unemployment reached its highest level in 2008, at 10%.
25. Describing numbers, percentages & fractions (Referencing Part 1)
Describing numbers, percentages & fractions(Referencing Part 1)
Referencing means adding numbers, percentages and fractions to make the data
“meaningful”.
Case A : Describe the table using numbers, fractions or percentages:
1990
1995
1,200
1,800
1. The number went up by 600 from 1,200 to 1,800. (Number)
2. The number went up by one third from 1,200 to 1,800. (Fraction)
3. The number went up by 50% from 1,200 to 1,800. (Percentage)
26.
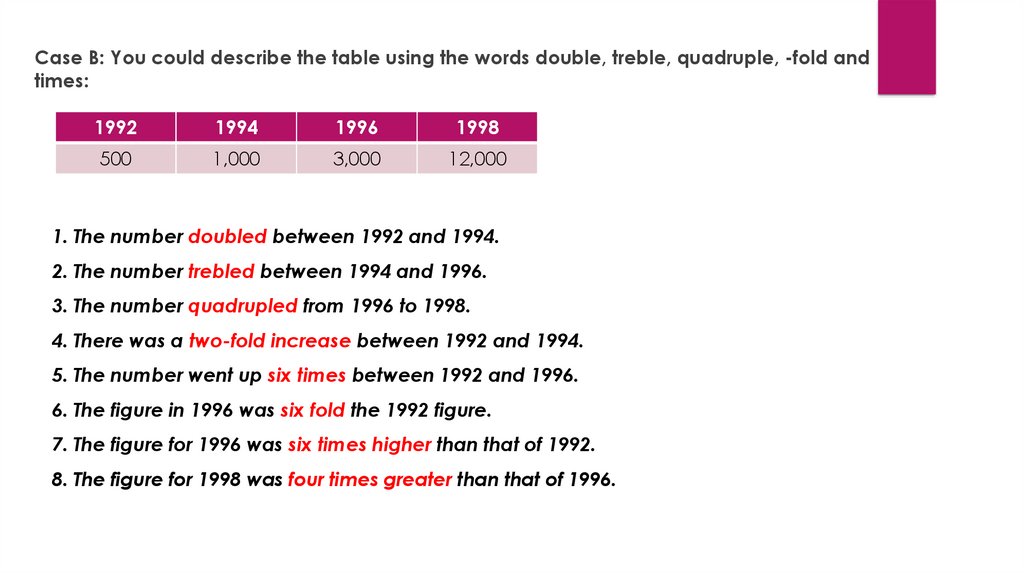
Case B: You could describe the table using the words double, treble, quadruple, -fold andtimes:
1992
1994
1996
1998
500
1,000
3,000
12,000
1. The number doubled between 1992 and 1994.
2. The number trebled between 1994 and 1996.
3. The number quadrupled from 1996 to 1998.
4. There was a two-fold increase between 1992 and 1994.
5. The number went up six times between 1992 and 1996.
6. The figure in 1996 was six fold the 1992 figure.
7. The figure for 1996 was six times higher than that of 1992.
8. The figure for 1998 was four times greater than that of 1996.
27.
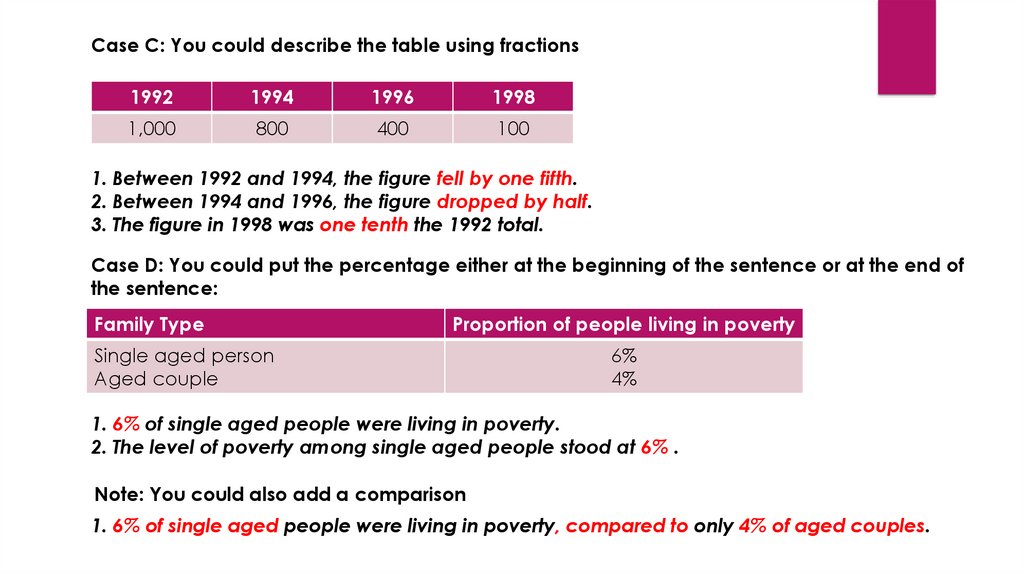
Case C: You could describe the table using fractions1992
1994
1996
1998
1,000
800
400
100
1. Between 1992 and 1994, the figure fell by one fifth.
2. Between 1994 and 1996, the figure dropped by half.
3. The figure in 1998 was one tenth the 1992 total.
Case D: You could put the percentage either at the beginning of the sentence or at the end of
the sentence:
Family Type
Proportion of people living in poverty
Single aged person
Aged couple
6%
4%
1. 6% of single aged people were living in poverty.
2. The level of poverty among single aged people stood at 6% .
Note: You could also add a comparison
1. 6% of single aged people were living in poverty, compared to only 4% of aged couples.
28. Describing peak points a) verb-> to peak/to stand+at+%+in+time b) phrase-> to reach/hit a peak+at/of+%+in+time c)noun->a peak
Describing peak pointsa) verb-> to peak/to
stand+at+%+in+time
35%
30%
b) phrase-> to reach/hit a
peak+at/of+%+in+time
c)noun->a peak
of/at+%+in+time
5%
29. Two types of describing peak structure
1. as a single sentenceA whole trend+ with+ a peak of/at%+in time
Asian index for foreign trade saw a sharp increase to 30% with a peak of 35% in 2008
throughout the given span
2.As TWO sentences
First period->peak(verb). However, this was followed by+adjective+nouno(remaining
part)
The European foreign trade indication reached a peak at 35%in 2003 from its initial
point. However, this was followed by an substantial fall till a mere 5% in the final year.
30. Describing low points
A)verb->to bottom out
at%+ in+time
B)
phrase-> to reach a
low of/at
C)noun->
a low of/at %
31. Discribing recovery in trends
to recoverThe figure for Chinese tea
consumption recovered its initial
15% over the period despite
reduction in 2005.