


 english
Similar presentations:


Graphs. A pie chart
1. Graphs
*2.
a pie chartb bar chart (column chart.)
с bar chart
d graph
3.
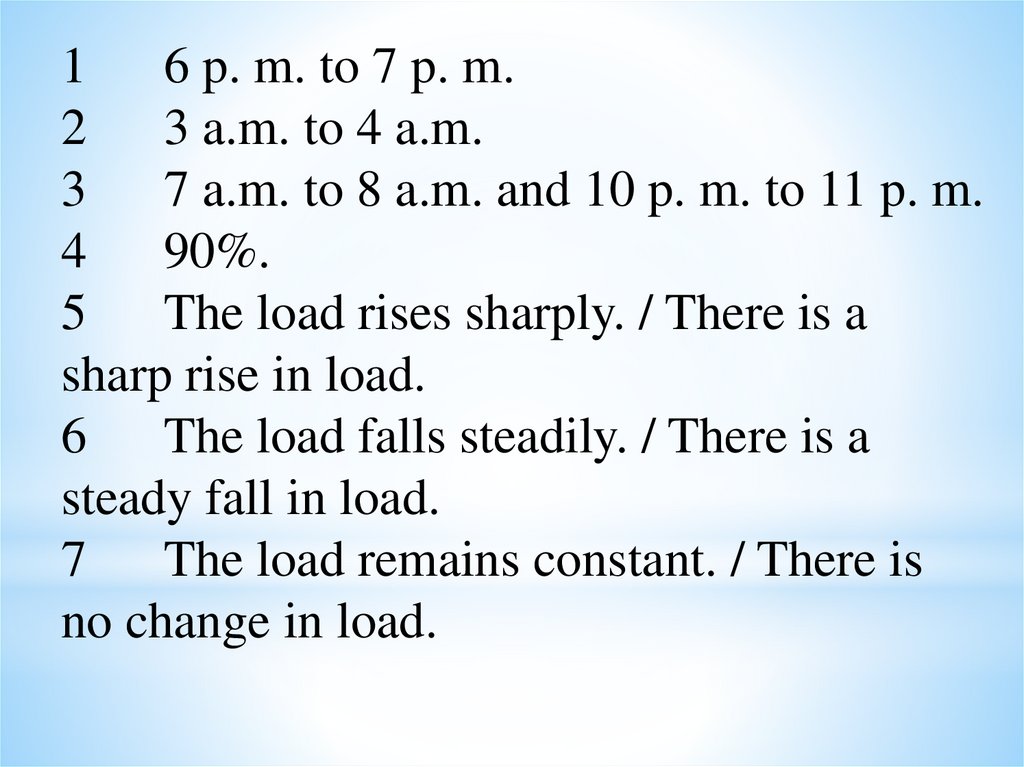
16 p. m. to 7 p. m.
2
3 a.m. to 4 a.m.
3
7 a.m. to 8 a.m. and 10 p. m. to 11 p. m.
4
90%.
5 The load rises sharply. / There is a
sharp rise in load.
6
The load falls steadily. / There is a
steady fall in load.
7
The load remains constant. / There is
no change in load.
4.
12
3
4
5
6
7
8
The load increases steadily.
There is a steady fall in load.
There is a gradual decrease in load.
There is a sharp drop in load.
The load remains constant.
The load drops slightly.
The load does not change.
The load climbs and falls again.
5.
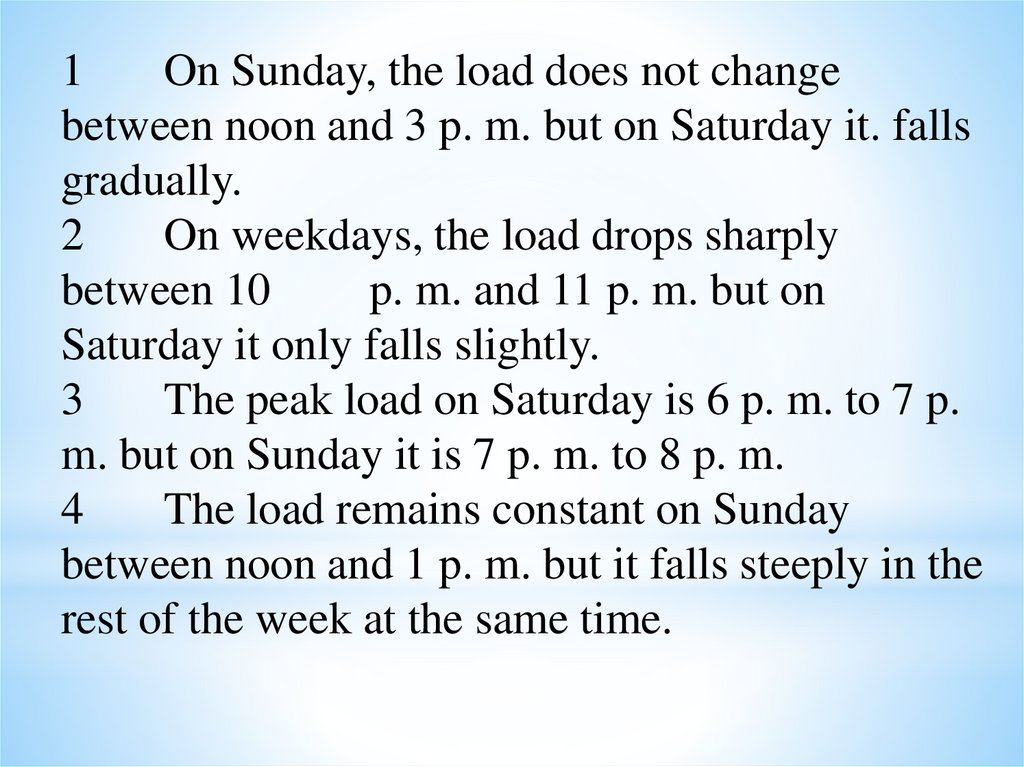
1On Sunday, the load does not change
between noon and 3 p. m. but on Saturday it. falls
gradually.
2
On weekdays, the load drops sharply
between 10
p. m. and 11 p. m. but on
Saturday it only falls slightly.
3
The peak load on Saturday is 6 p. m. to 7 p.
m. but on Sunday it is 7 p. m. to 8 p. m.
4
The load remains constant on Sunday
between noon and 1 p. m. but it falls steeply in the
rest of the week at the same time.
6.
Note that the first live verbs are transitive, but reduceand increase can be either transitive or intransitive.
1heated
7released
2compressed
8raises
3Lowering
9reduces
4raises
10increases
5compresses
11reduced
6reduce
12releases
7.
1a From 0 to P the specimen extends in direct
proportion to the load applied.
2
f Soon after P the material reaches its elastic
limit, marked on the graph as point E.
3
с From Y there is a rapid increase in length for
each increase in load.
4
b This rapid extension continues until point U,
the maximum load, is reached.
5
e After U the specimen lengthens further but
the load falls.
6
d At F the specimen finally fractures.
8.
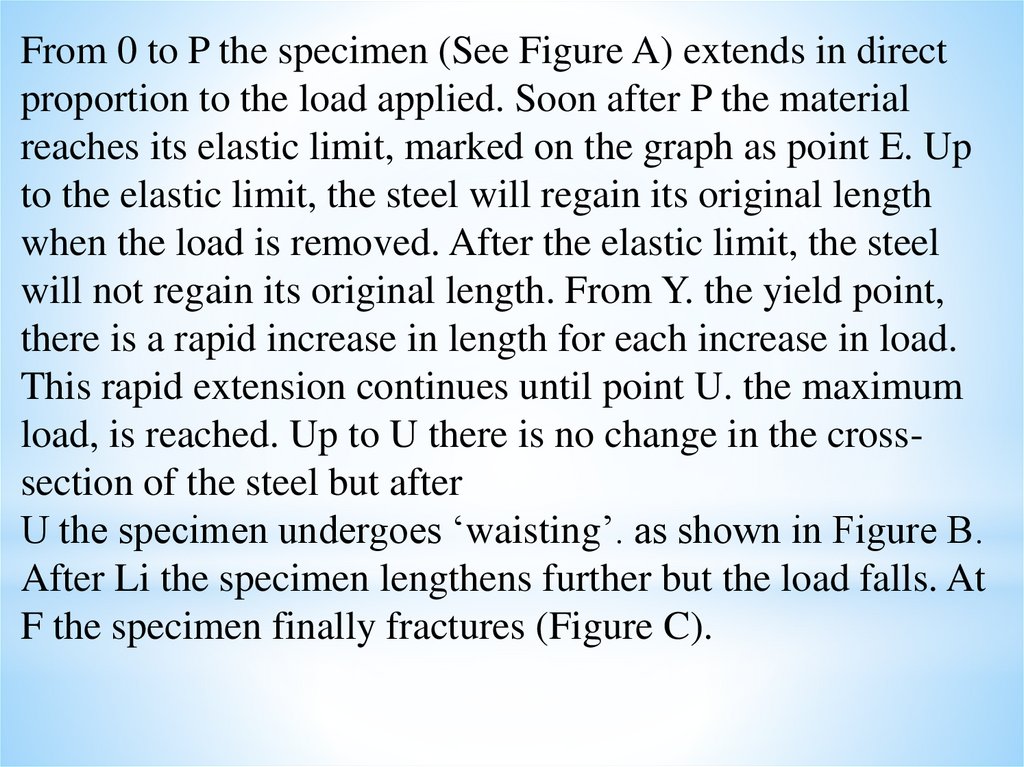
From 0 to P the specimen (See Figure A) extends in directproportion to the load applied. Soon after P the material
reaches its elastic limit, marked on the graph as point E. Up
to the elastic limit, the steel will regain its original length
when the load is removed. After the elastic limit, the steel
will not regain its original length. From Y. the yield point,
there is a rapid increase in length for each increase in load.
This rapid extension continues until point U. the maximum
load, is reached. Up to U there is no change in the crosssection of the steel but after
U the specimen undergoes ‘waisting’. as shown in Figure B.
After Li the specimen lengthens further but the load falls. At
F the specimen finally fractures (Figure C).
9.
1 Ca 0.84%.2 It falls steadily.
3 The more carbon, the harder
the steel.
4 It decreases gradually.
5 It. falls more slowly.
10.
1 Steel which contains more than0.55% carbon
2 More than 1.05%.
3 Mild steel is more ductile. Hard steel
is harder and has greater tensile strength.
4 Low carbon steel.
5 Spring grades.