


 economics
Similar presentations:


What is economics?
1.
© 2019 Pearson Education2.
1WHAT IS ECONOMICS?
© 2019 Pearson Education
3.
After studying this chapter, you will be able to:Define economics and distinguish between
microeconomics and macroeconomics
Explain the two big questions of economics
Explain the key ideas that define the economic way
of thinking
Explain how economists go about their work as social
scientists and policy advisers
Describe the jobs available for an economics major
© 2019 Pearson Education
4.
Definition of EconomicsAll economic questions arise because we want more than
we can get.
Our inability to satisfy all our wants is called scarcity.
Because we face scarcity, we must make choices.
The choices we make depend on the incentives we face.
An incentive is a reward that encourages an action or a
penalty that discourages an action.
© 2019 Pearson Education
5.
Definition of EconomicsEconomics is the social science that studies the choices
that individuals, businesses, governments, and entire
societies make as they cope with scarcity and the
incentives that influence and reconcile those choices.
Economics divides in two main parts:
■ Microeconomics
■ Macroeconomics
© 2019 Pearson Education
6.
Definition of EconomicsMicroeconomics is the study of choices that individuals
and businesses make, the way those choices interact in
markets, and the influence of governments.
An example of a microeconomic question is: Why are
people downloading more movies? Would a tax on
downloads change the number of movies downloaded?
Macroeconomics is the study of the performance of the
national and global economies.
An example of a macroeconomic question is: Why does
the unemployment rate fluctuate?
© 2019 Pearson Education
7.
Two Big Economic QuestionsTwo big questions summarize the scope of economics:
■ How do choices end up determining what, how, and
for whom goods and services get produced?
■ When do choices made in the pursuit of self-interest
also promote the social interest?
© 2019 Pearson Education
8.
Two Big Economic QuestionsWhat, How, and For Whom?
Goods and services are the objects that people value
and produce to satisfy human wants.
What?
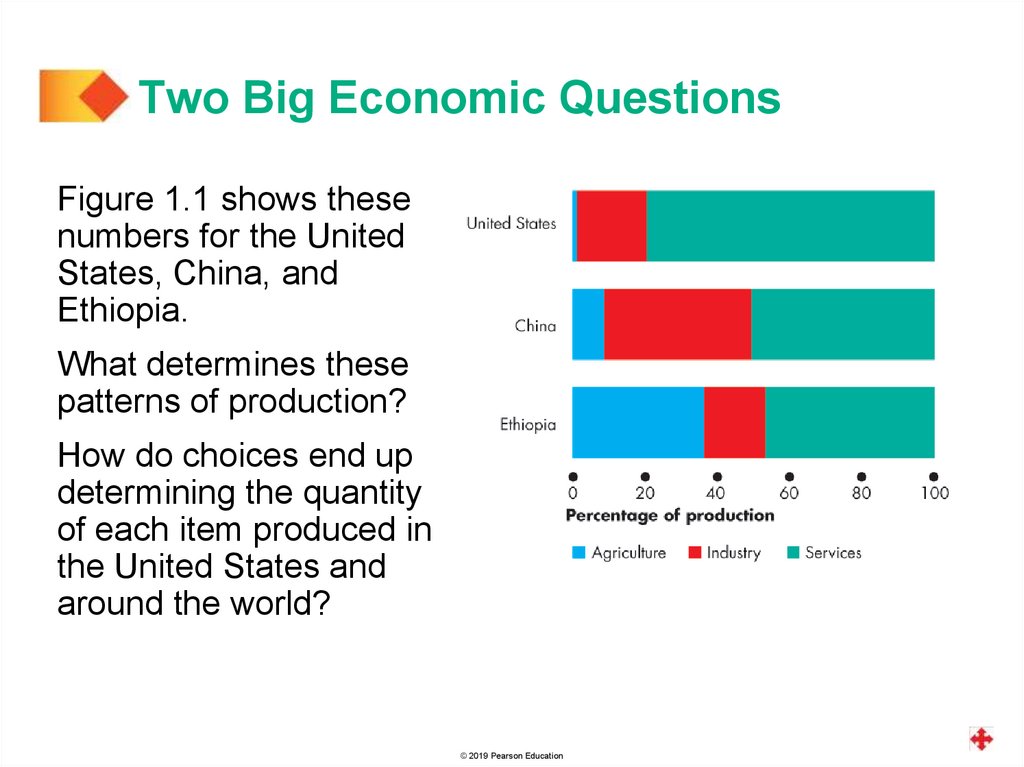
In the United States, agriculture accounts for less than
1 percent of total production, manufactured goods for
19 percent, and services for 80 percent.
In low-income Ethiopia, agriculture accounts for
36 percent of total production, manufactured goods for
17 percent, and services for 47 percent.
© 2019 Pearson Education
9.
Two Big Economic QuestionsFigure 1.1 shows these
numbers for the United
States, China, and
Ethiopia.
What determines these
patterns of production?
How do choices end up
determining the quantity
of each item produced in
the United States and
around the world?
© 2019 Pearson Education
10.
Two Big Economic QuestionsHow?
Goods and services are produced by using productive
resources that economists call factors of production.
Factors of production are grouped into four categories:
■ Land
■ Labor
■ Capital
■ Entrepreneurship
© 2019 Pearson Education
11.
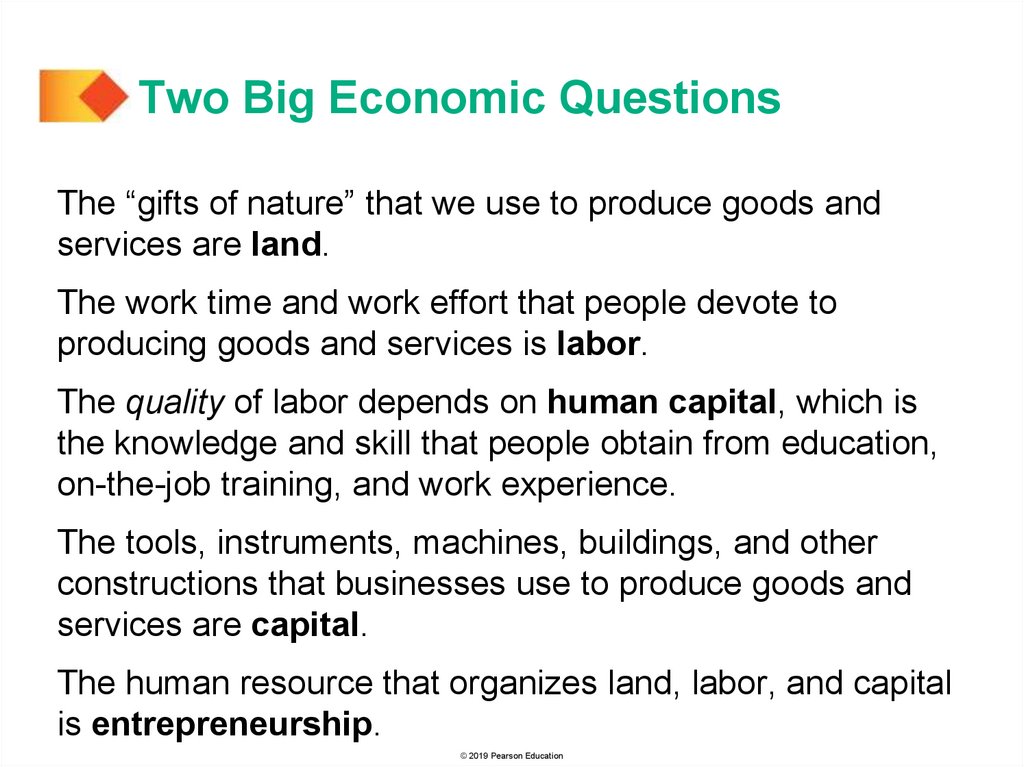
Two Big Economic QuestionsThe “gifts of nature” that we use to produce goods and
services are land.
The work time and work effort that people devote to
producing goods and services is labor.
The quality of labor depends on human capital, which is
the knowledge and skill that people obtain from education,
on-the-job training, and work experience.
The tools, instruments, machines, buildings, and other
constructions that businesses use to produce goods and
services are capital.
The human resource that organizes land, labor, and capital
is entrepreneurship.
© 2019 Pearson Education
12.
Two Big Economic QuestionsFigure 1.2 shows a
measure of the growth
of human capital in the
United States since
1900—the percentage
of the population that
has completed different
levels of education.
Economics explains
these trends.
© 2019 Pearson Education
13.
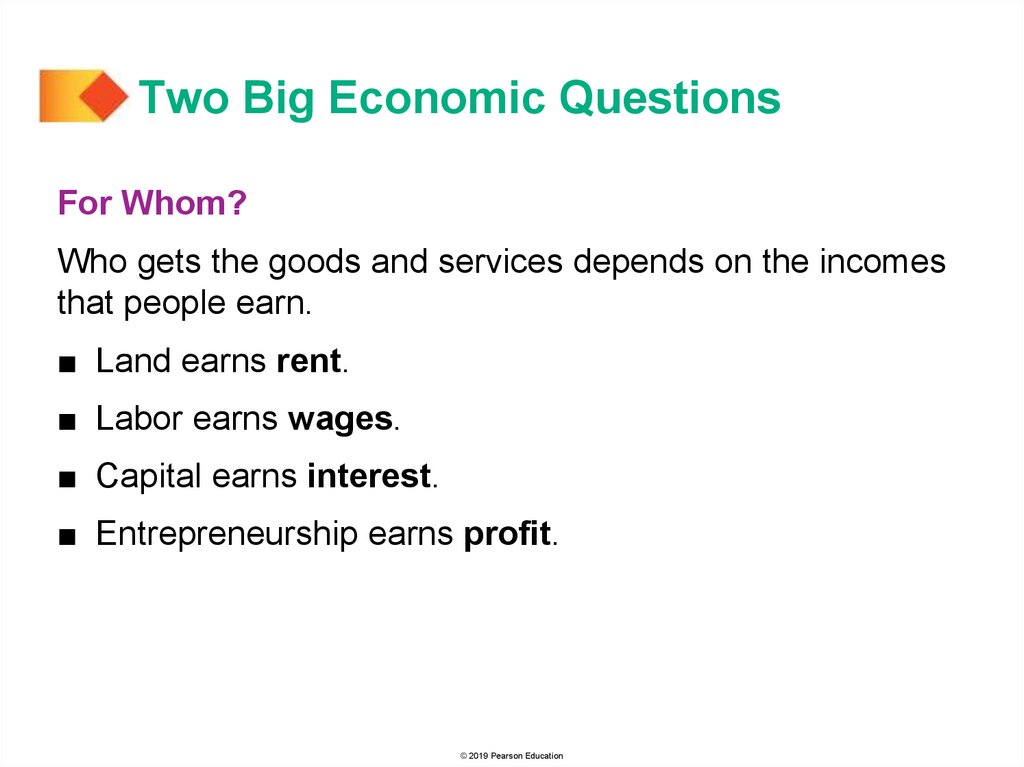
Two Big Economic QuestionsFor Whom?
Who gets the goods and services depends on the incomes
that people earn.
■ Land earns rent.
■ Labor earns wages.
■ Capital earns interest.
■ Entrepreneurship earns profit.
© 2019 Pearson Education
14.
Two Big Economic QuestionsDo Choices Made in the Pursuit of Self-Interest also
Promote the Social Interest?
Every day, 325 million Americans and 7.4 billion people in
other countries make economic choices that result in what,
how, and for whom goods and services are produced.
These choices are made by people who are pursuing their
self-interest.
Are they promoting the social interest?
© 2019 Pearson Education
15.
Two Big Economic QuestionsSelf-Interest
You make choices that are in your self-interest—choices
that you think are best for you.
Social Interest
Choices that are best for society as a whole are said to be
in the social interest.
Social interest has two dimensions: efficiency and fair
shares.
© 2019 Pearson Education
16.
Two Big Economic QuestionsEfficiency and Social Interest
Resource use is efficient if it is not possible to make
someone better off without making someone else worse
off.
Fair Shares and Social Interest
The idea that the social interest requires “fair shares” is a
deeply held one.
But what is a fair share?
© 2019 Pearson Education
17.
Two Big Economic QuestionsQuestions about the social interest are hard ones to
answer and they generate discussion, debate, and
disagreement.
Four topics that generate discussion and that illustrate
tension between self-interest and social interest are:
■ Globalization
■ Information-age monopolies
■ Climate change
■ Financial instability
© 2019 Pearson Education
18.
Two Big Economic QuestionsGlobalization
Globalization means the expansion of international trade,
borrowing and lending, and investment.
Globalization is in the self-interest of consumers who buy
low-cost imported goods and services.
Globalization is also in the self-interest of the multinational
firms that produce in low-cost regions and sell in high-price
regions.
But is globalization in the self-interest of low-wage workers
in other countries and U.S. firms that can’t compete with
low-cost imports?
Is globalization in the social interest?
© 2019 Pearson Education
19.
Two Big Economic QuestionsInformation-Age Monopolies
The technological change of the past forty years has been
called the Information Revolution.
The information revolution has clearly served your selfinterest: It has provided your cell-phone, laptop, loads of
handy applications, and the Internet.
It has also served the self-interest of Bill Gates of Microsoft
and Gordon Moore of Intel, both of whom have seen their
wealth soar.
But did the information revolution serve the social interest?
© 2019 Pearson Education
20.
Two Big Economic QuestionsClimate Change
Climate change is a huge political issue today.
Every serious political leader is acutely aware of the
problem and of the popularity of having proposals that
might lower carbon emissions.
Burning fossil fuels to generate electricity and to power
airplanes, automobiles, and trucks pours a staggering
28 billion tons—4 tons per person—of carbon dioxide into
the atmosphere each year.
© 2019 Pearson Education
21.
Two Big Economic QuestionsTwo thirds of the world’s carbon emissions comes from the
United States, China, the European Union, Russia, and
India.
The fastest growing emissions are coming from India and
China.
The amount of global warming caused by economic
activity and its effects are uncertain, but the emissions
continue to grow and pose huge risks.
© 2019 Pearson Education
22.
Two Big Economic QuestionsEvery day, when you make self-interested choices to use
electricity and gasoline, you contribute to carbon
emissions.
You leave your carbon footprint.
You can lessen your carbon footprint by walking, riding a
bike, taking a cold shower, or planting a tree.
But can each one of us be relied upon to make decisions
that affect the Earth’s carbon-dioxide concentration in the
social interest?
Can governments change the incentives we face so that
our self-interested choices are also in the social interest?
© 2019 Pearson Education
23.
Two Big Economic QuestionsEconomic Instability
In 2008, banks were in trouble. They had made loans that
borrowers couldn’t repay and they were holding securities
the values of which had crashed.
Banks’ choices to take deposits and make loans are made
in self-interest, but does this lending and borrowing serve
the social interest?
Do banks lend too much in the pursuit of profit?
© 2019 Pearson Education
24.
Economic Way of ThinkingSix key ideas define the economic way of thinking:
■ A choice is a tradeoff.
■ People make rational choices by comparing benefits
and costs.
■ Benefit is what you gain from something.
■ Cost is what you must give up to get something.
■ Most choices are “how-much” choices made at the
margin.
■ Choices respond to incentives.
© 2019 Pearson Education
25.
Economic Way of ThinkingA Choice Is a Tradeoff
The economic way of thinking places scarcity and its
implication, choice, at center stage.
You can think about every choice as a tradeoff—an
exchange—giving up one thing to get something else.
On Saturday night, will you study or have fun?
You can’t study and have fun at the same time, so you
must make a choice.
Whatever you choose, you could have chosen something
else. Your choice is a tradeoff.
© 2019 Pearson Education
26.
Economic Way of ThinkingMaking a Rational Choice
A rational choice is one that compares costs and benefits
and achieves the greatest benefit over cost for the person
making the choice.
Only the wants of the person making a choice are relevant
to determine its rationality.
The idea of rational choice provides an answer to the first
question: What goods and services will be produced and in
what quantities?
The answer is: Those that people rationally choose to buy!
© 2019 Pearson Education
27.
The Economic Way of ThinkingHow do people choose rationally?
The answers turn on benefits and costs.
Benefit: What you Gain
The benefit of something is the gain or pleasure that it
brings and is determined by preferences
Preferences are what a person likes and dislikes and the
intensity of those feelings.
© 2019 Pearson Education
28.
The Economic Way of ThinkingCost: What you Must Give Up
The opportunity cost of something is the highest-valued
alternative that must be given up to get it.
What is your opportunity cost of going to a live concert?
Opportunity cost has two components:
1. The things you can’t afford to buy if you purchase the
concert ticket.
2. The things you can’t do with your time if you attend the
concert.
© 2019 Pearson Education
29.
The Economic Way of ThinkingHow Much? Choosing at the Margin
You can allocate the next hour between studying and
instant messaging your friends.
The choice is not all or nothing, but you must decide how
many minutes to allocate to each activity.
To make this decision, you compare the benefit of a little
bit more study time with its cost—you make your choice at
the margin.
© 2019 Pearson Education
30.
The Economic Way of ThinkingTo make a choice at the margin, you evaluate the
consequences of making incremental changes in the use
of your time.
The benefit from pursuing an incremental increase in an
activity is its marginal benefit.
The opportunity cost of pursuing an incremental increase
in an activity is its marginal cost.
If the marginal benefit from an incremental increase in an
activity exceeds its marginal cost, your rational choice is to
do more of that activity.
© 2019 Pearson Education
31.
The Economic Way of ThinkingChoices Respond to Incentives
A change in marginal cost or a change in marginal benefit
changes the incentives that we face and leads us to
change our choice.
The central idea of economics is that we can predict how
choices will change by looking at changes in incentives.
Incentives are also the key to reconciling self-interest and
the social interest.
© 2019 Pearson Education
32.
Economics: A Social Science andPolicy Tool
Economist as Social Scientist
Economists distinguish between two types of statement:
■ Positive statements
■ Normative statements
A positive statement can be tested by checking it against
facts.
A normative statement expresses an opinion and cannot
be tested.
© 2019 Pearson Education
33.
Economics: A Social Science andPolicy Tool
Unscrambling Cause and Effect
The task of economic science is to discover positive
statements that are consistent with what we observe in the
world and that enable us to understand how the economic
world works.
Economists create and test economic models.
An economic model is a description of some aspect of
the economic world that includes only those features that
are needed for the purpose at hand.
© 2019 Pearson Education
34.
Economics: A Social Science andPolicy Tool
A model is tested by comparing its predictions with the
facts.
But testing an economic model is difficult, so economists
also use:
■ Natural experiments
■ Statistical investigations
■ Economic experiments
© 2019 Pearson Education
35.
Economics: A Social Science andPolicy Tool
Economist as Policy Adviser
Economics is a toolkit for advising governments and
businesses and for making personal decisions.
All the policy questions on which economists provide
advice involve a blend of the positive and the normative.
Economics can’t help with the normative part—the goal.
But for a given goal, economics provides a method of
evaluating alternative solutions—comparing marginal
benefits and marginal costs.
© 2019 Pearson Education
36.
Economists in the EconomyWhat are the jobs available to an economics major?
Is the number of economics jobs expected to grow or
shrink?
How much do economics graduates earn?
What are the skills needed for an economics job?
© 2019 Pearson Education
37.
Economists in the EconomyJobs for an Economics Major
A major in economics opens the door to the pursuit of a
masters or PhD and a career as an economist.
The work of economists varies enormously but it includes
collecting and analyzing data on the production and use of
resources, goods, and services; predicting future trends;
and studying ways of using resources more efficiently.
Economists work in private firms, government, and
international organizations.
© 2019 Pearson Education
38.
Economists in the EconomyEconomics majors
also work as market
research analysts,
financial analysts,
and budget analysts.
Figure 1.3 shows the
the relative number of
jobs for economists
and analysts that use
economic ideas and
tools.
© 2019 Pearson Education
39.
Economists in the EconomyWill Jobs for Economists Grow?
The BLS forecasts that jobs for:
1. Economists with a PhD will grow by 6 percent.
2. Budget analysts will grow by 2 percent.
3. Financial analysts will grow by 12 percent.
4. Market research analysts will grow by 19 percent.
© 2019 Pearson Education
40.
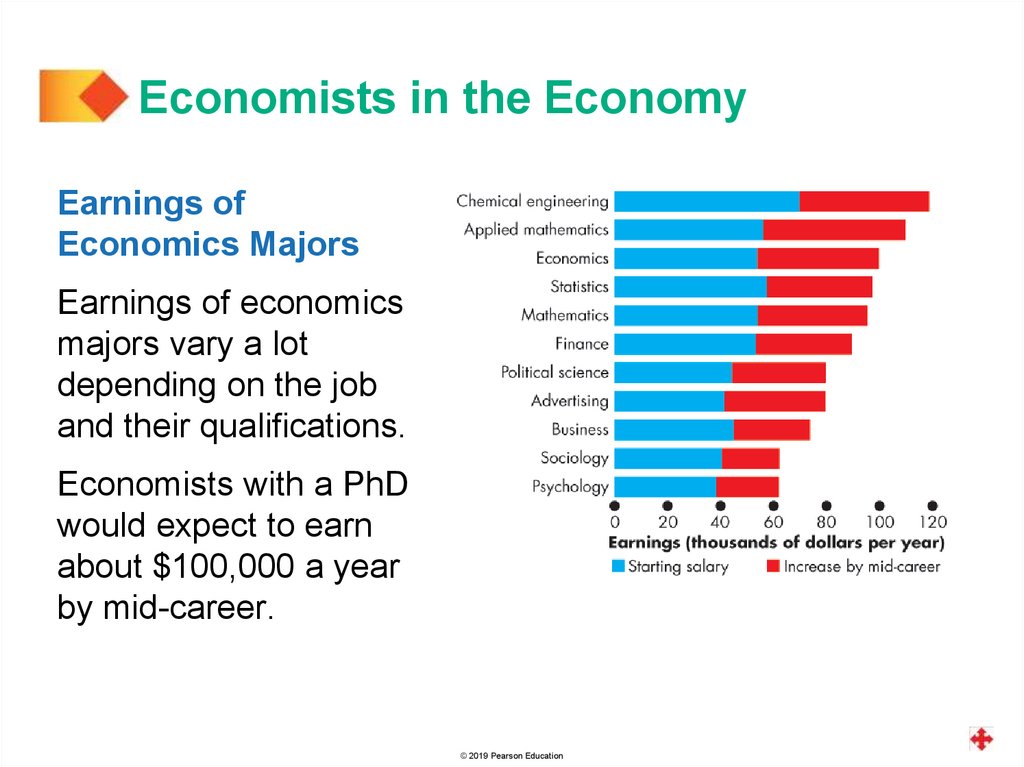
Economists in the EconomyEarnings of
Economics Majors
Earnings of economics
majors vary a lot
depending on the job
and their qualifications.
Economists with a PhD
would expect to earn
about $100,000 a year
by mid-career.
© 2019 Pearson Education
41.
Economists in the EconomyEconomists working as
analysts earn more than
the national average.
© 2019 Pearson Education
42.
Economists in the EconomySkills Needed for Economics Jobs
Employers look for five skills:
1. Critical-thinking skills.
2. Analytical skills
3. Math skills
4. Writing skills
5. Oral communication skills
© 2019 Pearson Education
43.
APPENDIXGraphs in Economics
© 2019 Pearson Education
44.
After studying this chapter, you will be able to:Make and interpret a scatter diagram
Identify linear and nonlinear relationships and
relationships that have a maximum and a minimum
Define and calculate the slope of a line
Graph relationships among more than two variables
© 2019 Pearson Education
45.
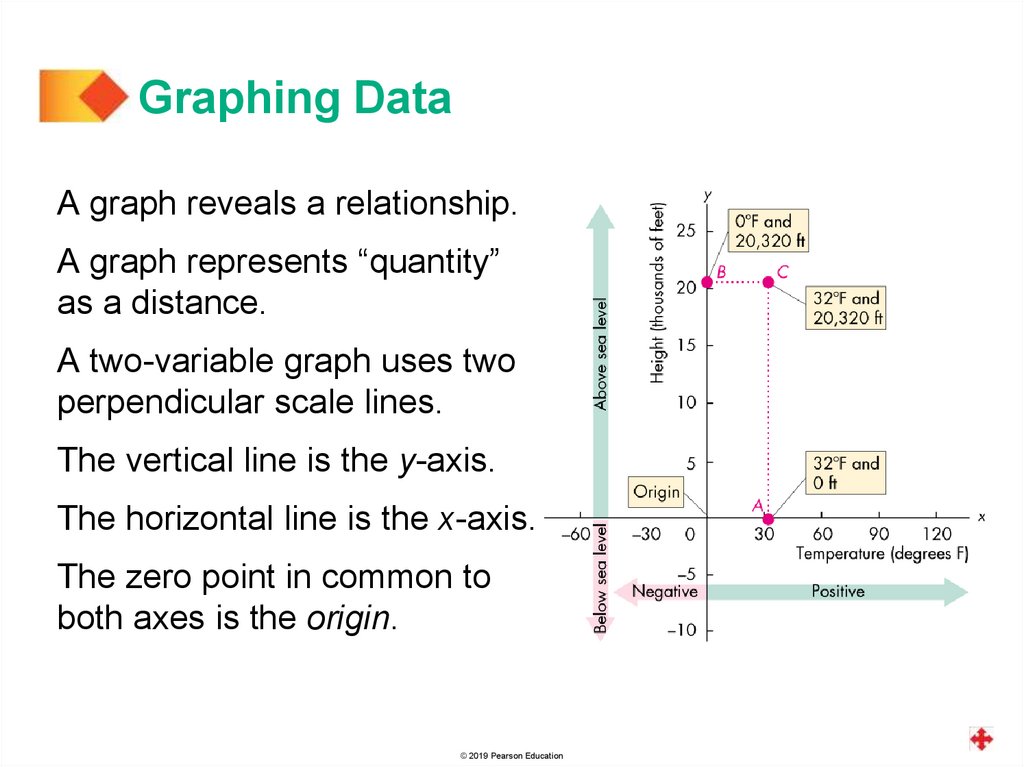
Graphing DataA graph reveals a relationship.
A graph represents “quantity”
as a distance.
A two-variable graph uses two
perpendicular scale lines.
The vertical line is the y-axis.
The horizontal line is the x-axis.
The zero point in common to
both axes is the origin.
© 2019 Pearson Education
46.
Graphing DataEconomists measure variables that describe what, how,
and for whom goods and services are produced.
These variables are quantities produced and prices.
Figure A1.2 shows two examples of economic graphs.
© 2019 Pearson Education
47.
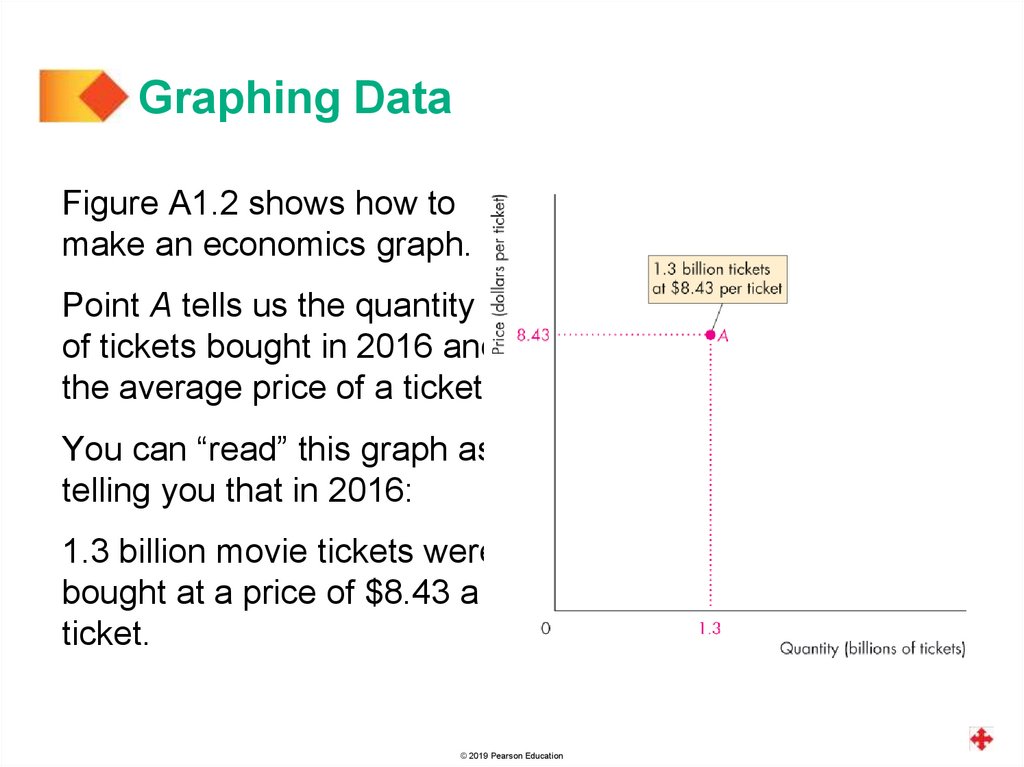
Graphing DataFigure A1.2 shows how to
make an economics graph.
Point A tells us the quantity
of tickets bought in 2016 and
the average price of a ticket.
You can “read” this graph as
telling you that in 2016:
1.3 billion movie tickets were
bought at a price of $8.43 a
ticket.
© 2019 Pearson Education
48.
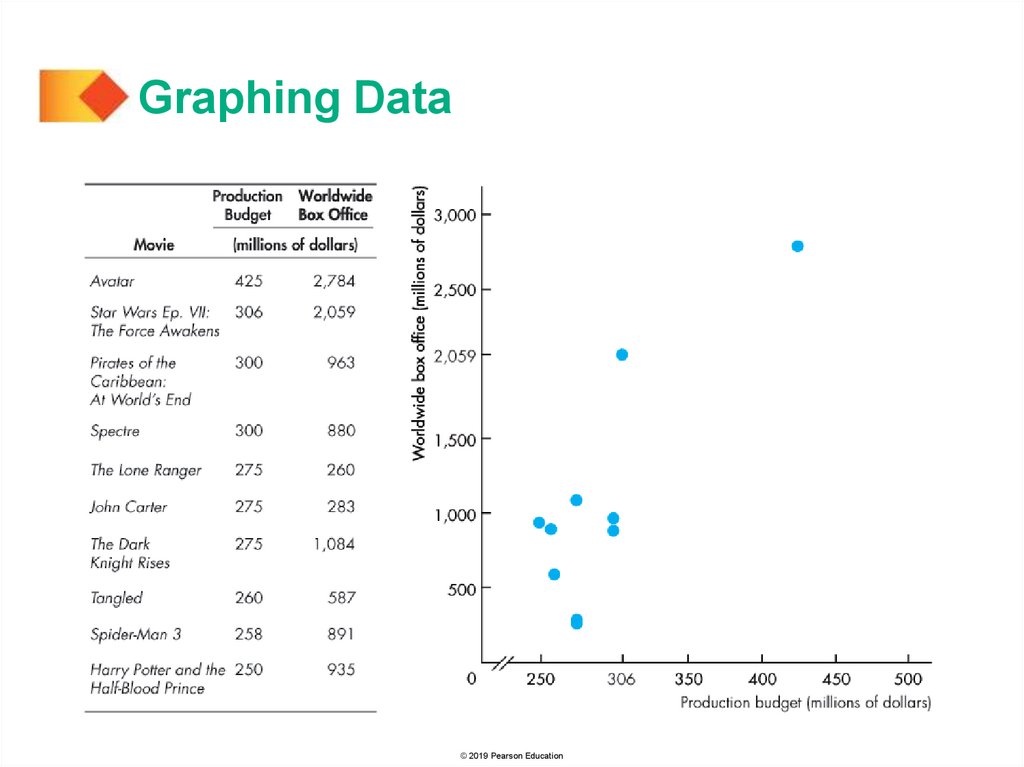
Graphing DataScatter Diagrams
A scatter diagram plots the value of one variable against
the value of another variable for a number of different
values of each variable.
A scatter diagram reveals whether a relationship exists
between the two variables.
Figure A1.3 shows the production budget for ten popular
movies and their worldwide box office revenues.
The table gives the data and the graph describes the
relationship between each movie’s production budget and
its box office revenue.
© 2019 Pearson Education
49.
Graphing Data© 2019 Pearson Education
50.
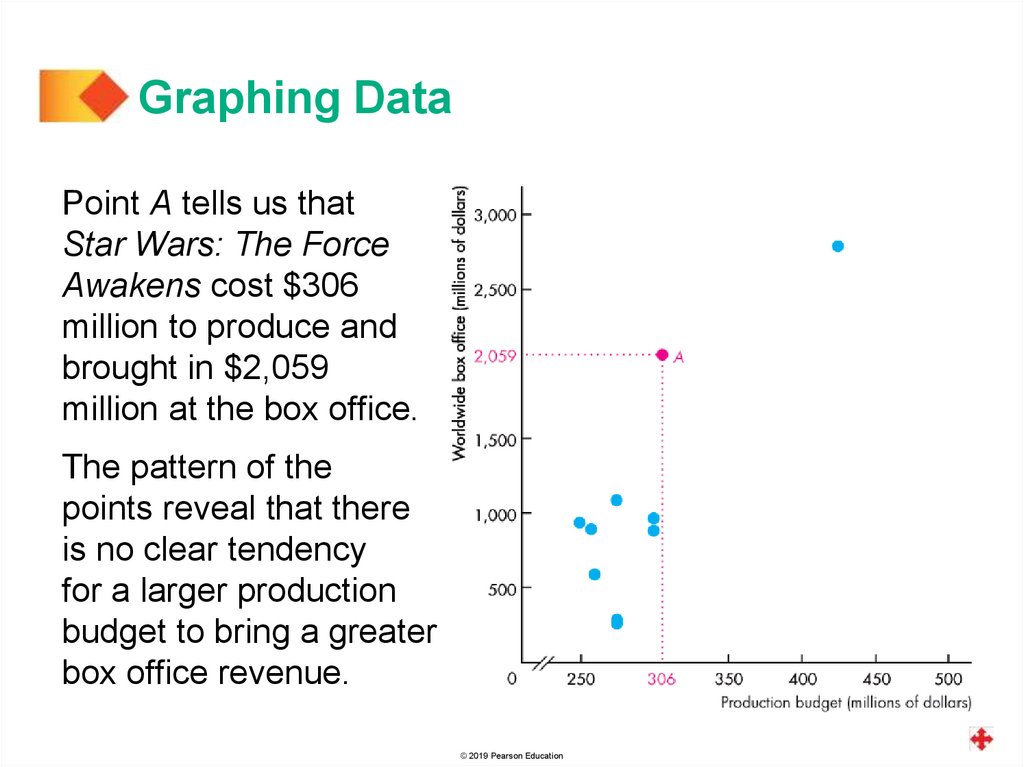
Graphing DataPoint A tells us that
Star Wars: The Force
Awakens cost $306
million to produce and
brought in $2,059
million at the box office.
The pattern of the
points reveal that there
is no clear tendency
for a larger production
budget to bring a greater
box office revenue.
© 2019 Pearson Education
51.
Graphing DataFigure A1.4(a) is a scatter
diagram of income and
expenditure, on average,
from 2001 to 2016.
Point A shows that in 2011,
income was $38,000 and
expenditure was $34,000.
The graph shows that as
income increases, so does
expenditure, and that the
relationship is a close one.
© 2019 Pearson Education
52.
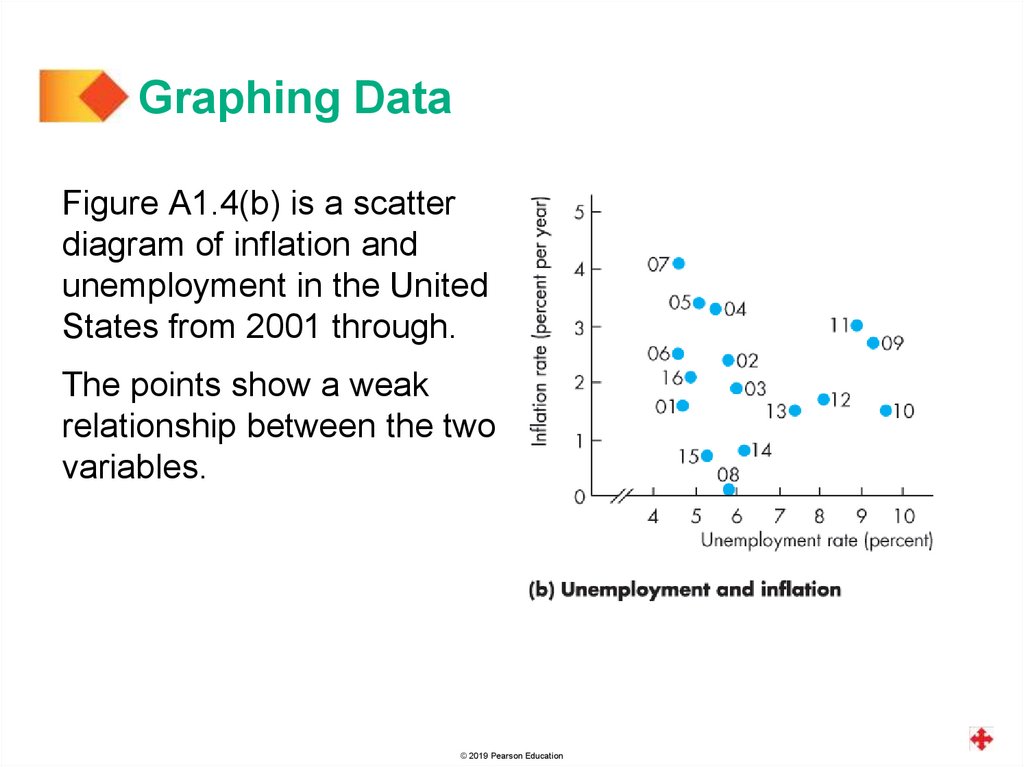
Graphing DataFigure A1.4(b) is a scatter
diagram of inflation and
unemployment in the United
States from 2001 through.
The points show a weak
relationship between the two
variables.
© 2019 Pearson Education
53.
Graphs used in Economic ModelsGraphs are used in economic models to show the
relationship between variables.
The patterns to look for in graphs are the four cases in
which
Variables move in the same direction.
Variables move in opposite directions.
Variables have a maximum or a minimum.
Variables are unrelated.
© 2019 Pearson Education
54.
Graphs Used in Economic ModelsVariables That Move in the Same Direction
A relationship between two variables that move in the
same direction is called a positive relationship or a
direct relationship.
A line that slopes upward shows a positive relationship.
A relationship shown by a straight line is called a linear
relationship.
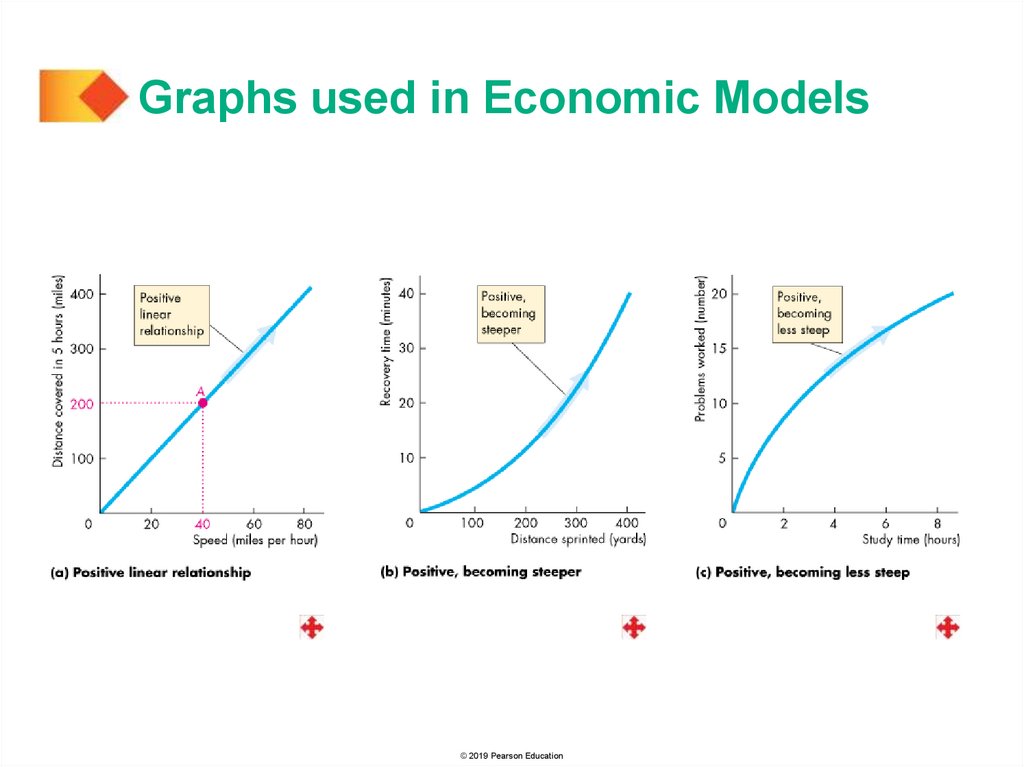
The three graphs on the next slide show positive
relationships.
© 2019 Pearson Education
55.
Graphs used in Economic Models© 2019 Pearson Education
56.
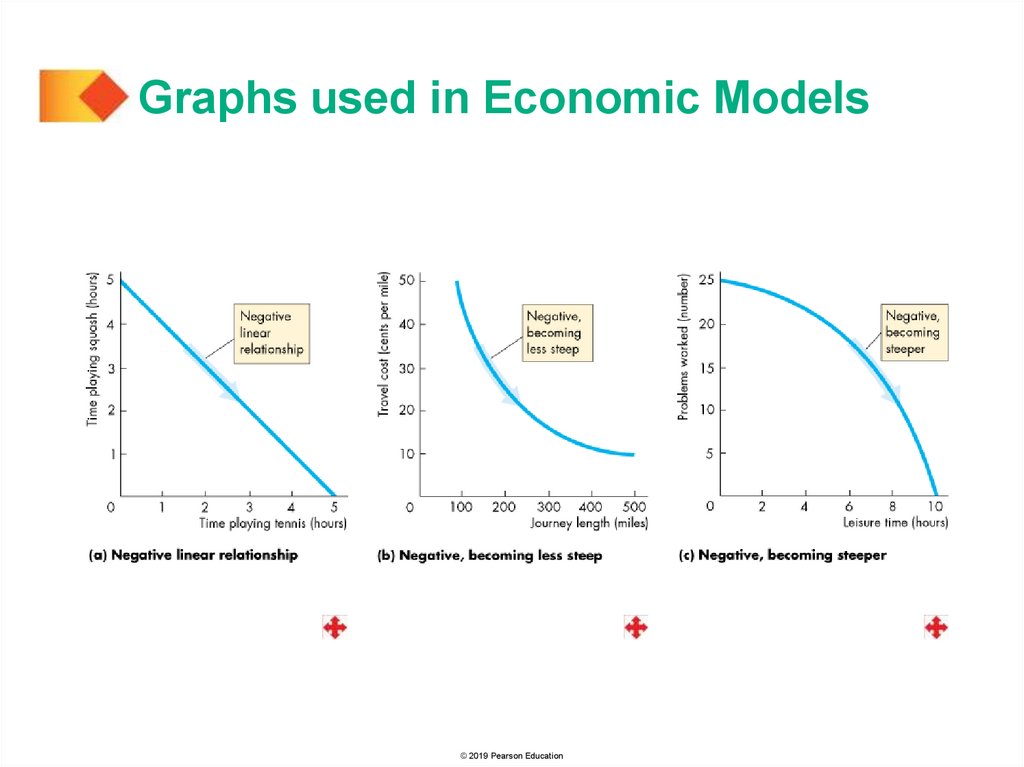
Graphs used in Economic ModelsVariables That Move in Opposite Directions
A relationship between two variables that move in opposite
directions is called a negative relationship or an inverse
relationship.
A line that slopes downward shows a negative relationship.
The three graphs on the next slide show negative
relationships.
© 2019 Pearson Education
57.
Graphs used in Economic Models© 2019 Pearson Education
58.
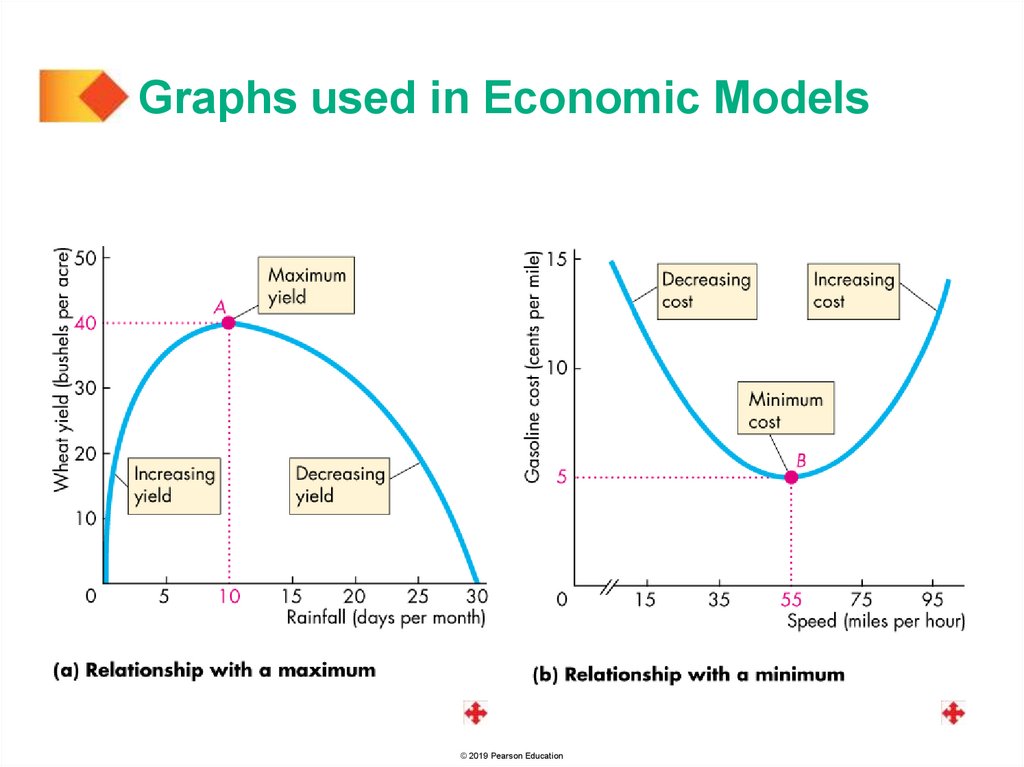
Graphs used in Economic ModelsVariables That Have a Maximum or a Minimum
The two graphs on the next slide show relationships that
have a maximum and a minimum.
These relationships are positive over part of their range
and negative over the other part.
© 2019 Pearson Education
59.
Graphs used in Economic Models© 2019 Pearson Education
60.
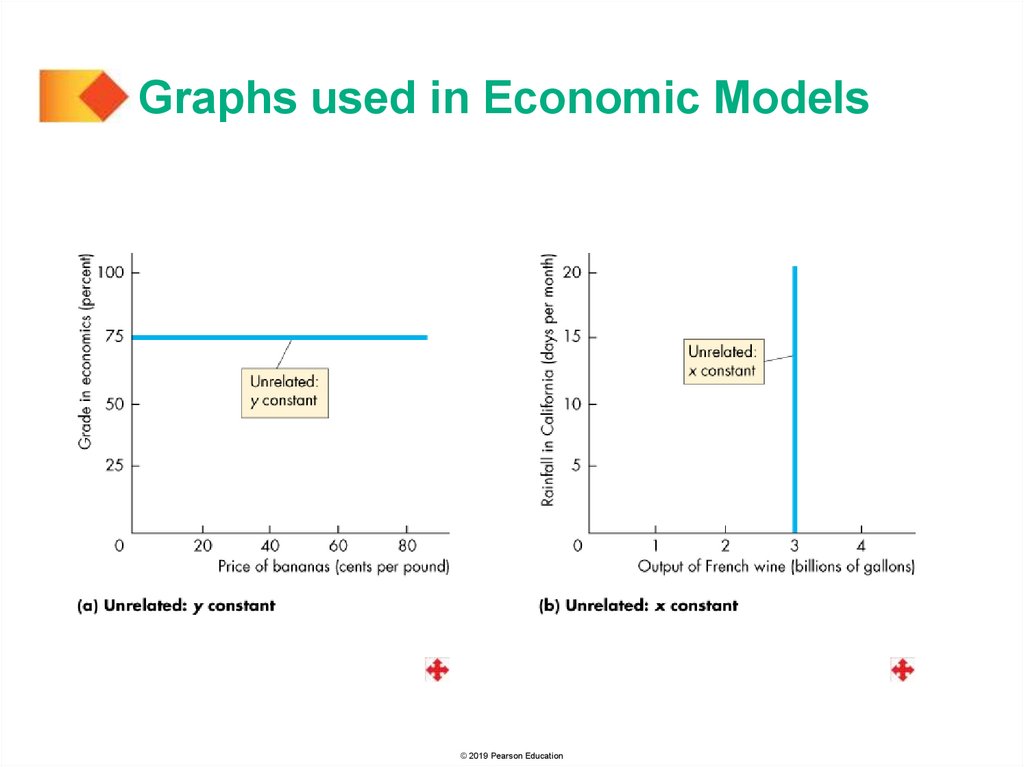
Graphs used in Economic ModelsVariables That are Unrelated
Sometimes, we want to emphasize that two variables are
unrelated.
The two graphs on the next slide show examples of
variables that are unrelated.
© 2019 Pearson Education
61.
Graphs used in Economic Models© 2019 Pearson Education
62.
The Slope of a RelationshipThe slope of a relationship is the change in the value of
the variable measured on the y-axis divided by the change
in the value of the variable measured on the x-axis.
We use the Greek letter (capital delta) to represent
“change in.”
So y means the change in the value of the variable
measured on the y-axis and x means the change in the
value of the variable measured on the x-axis.
Slope equals y/ x.
© 2019 Pearson Education
63.
The Slope of a RelationshipThe Slope of a Straight
Line
The slope of a straight line is
constant.
Graphically, the slope is
calculated as the “rise” over
the “run.”
The slope is positive if the
line is upward sloping.
© 2019 Pearson Education
64.
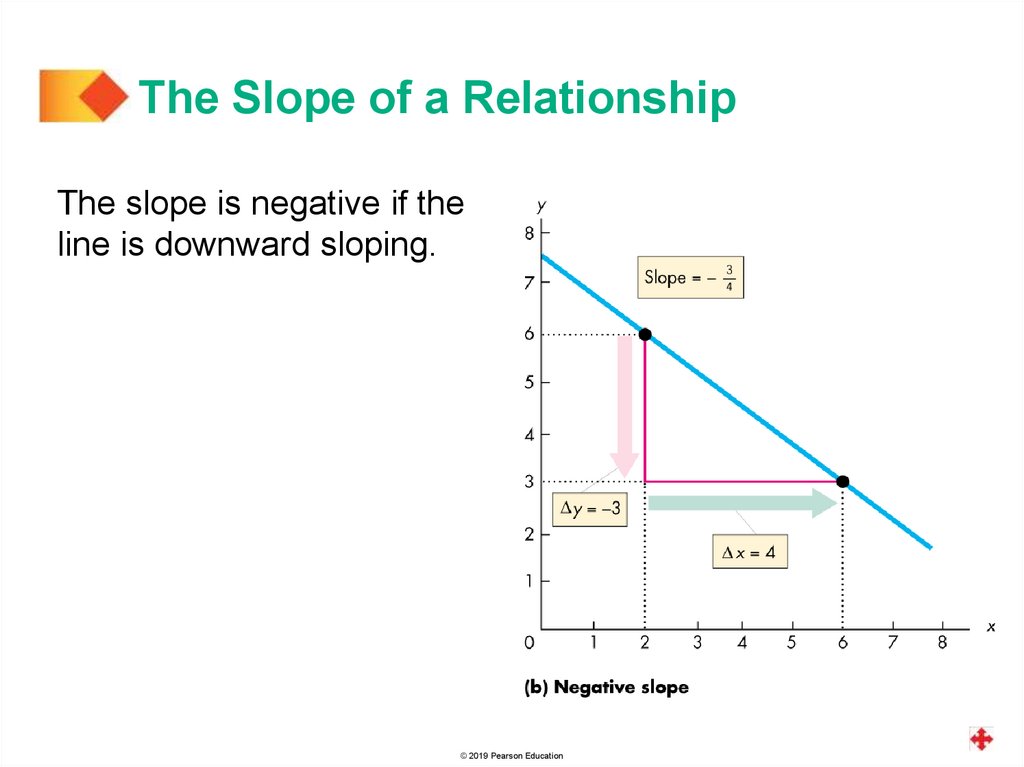
The Slope of a RelationshipThe slope is negative if the
line is downward sloping.
© 2019 Pearson Education
65.
The Slope of a RelationshipThe Slope of a Curved Line
The slope of a curved line at a point varies depending on
where along the curve it is calculated.
We can calculate the slope of a curved line either at a
point or across an arc.
© 2019 Pearson Education
66.
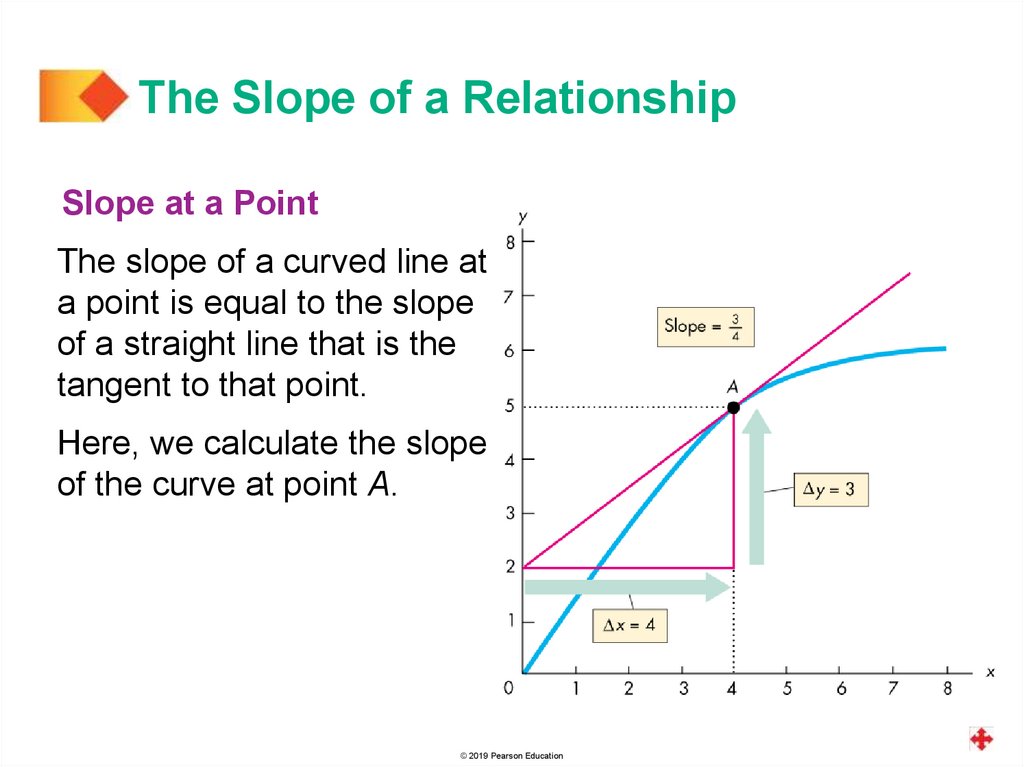
The Slope of a RelationshipSlope at a Point
The slope of a curved line at
a point is equal to the slope
of a straight line that is the
tangent to that point.
Here, we calculate the slope
of the curve at point A.
© 2019 Pearson Education
67.
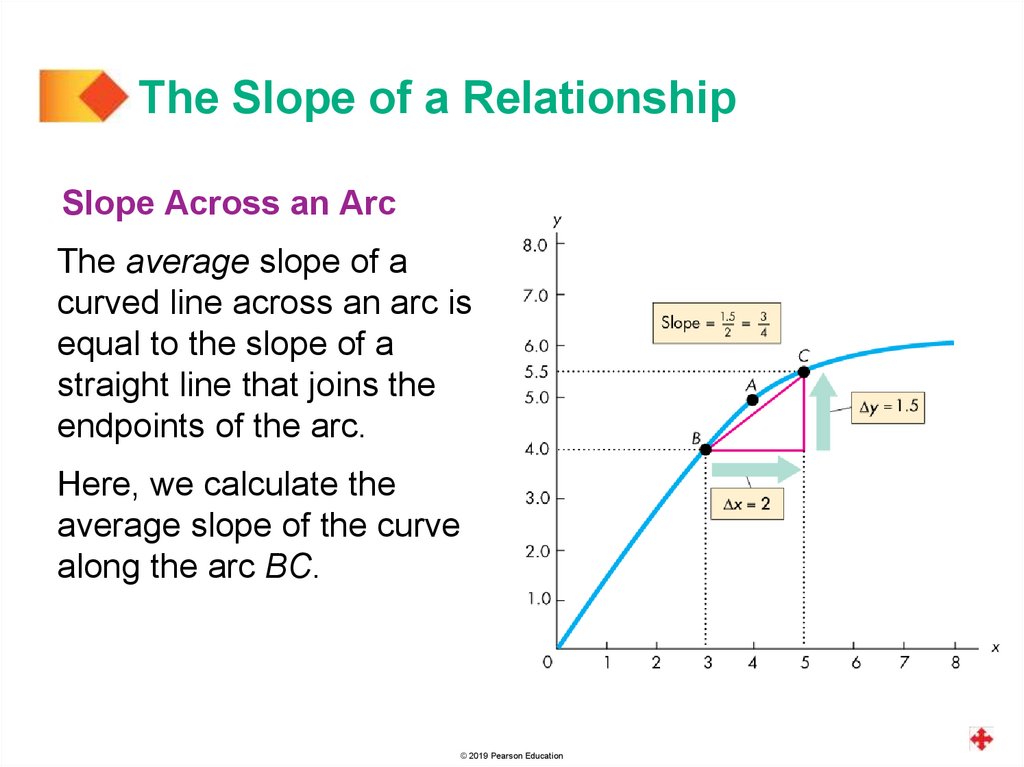
The Slope of a RelationshipSlope Across an Arc
The average slope of a
curved line across an arc is
equal to the slope of a
straight line that joins the
endpoints of the arc.
Here, we calculate the
average slope of the curve
along the arc BC.
© 2019 Pearson Education
68.
Graphing Relationships AmongMore Than Two Variables
When a relationship involves more than two variables, we
can plot the relationship between two of the variables by
holding other variables constant—by using ceteris paribus.
Ceteris paribus
Ceteris paribus means “if all other relevant things remain
the same.”
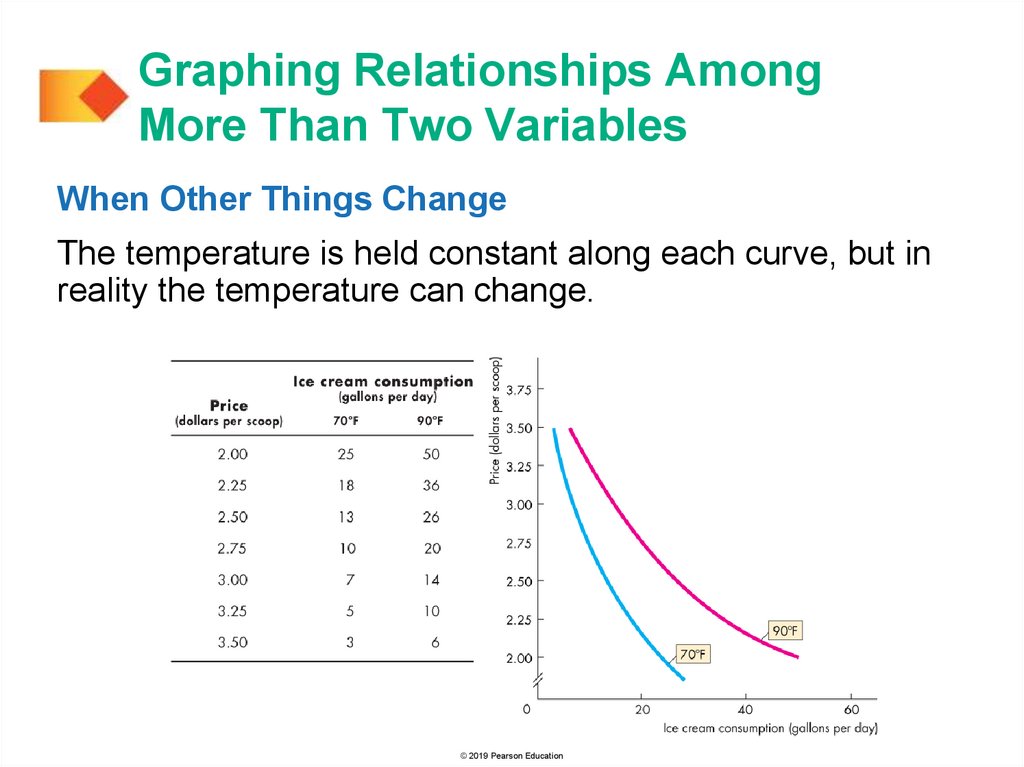
Figure A1.12 shows a relationship among three variables.
© 2019 Pearson Education
69.
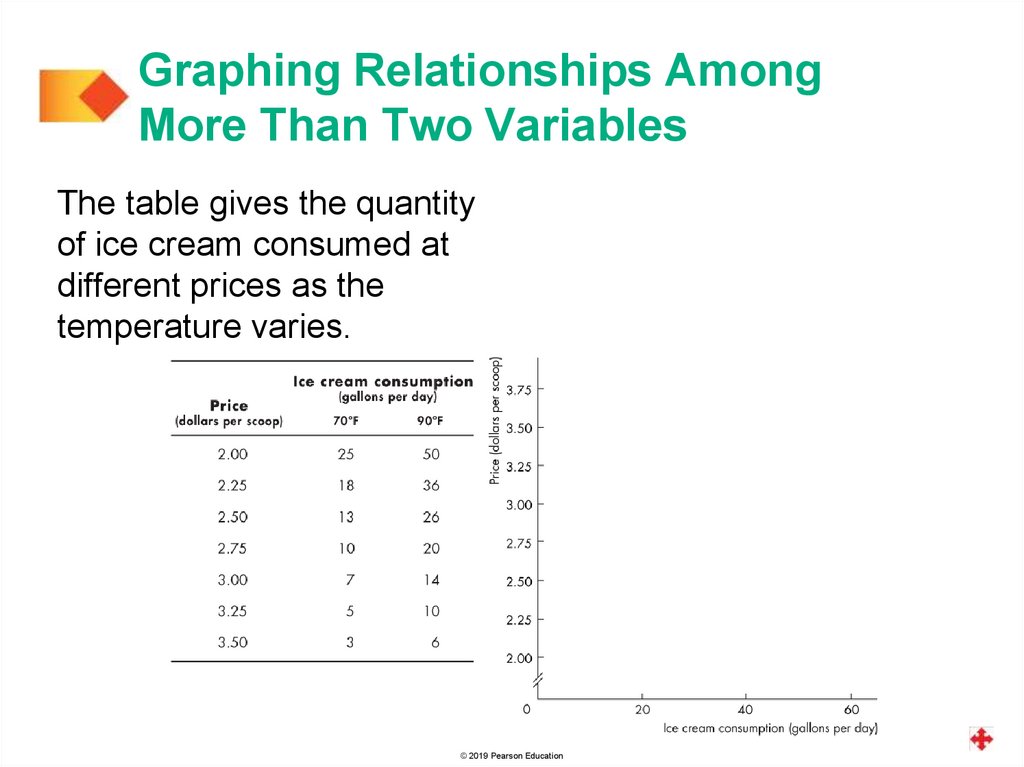
Graphing Relationships AmongMore Than Two Variables
The table gives the quantity
of ice cream consumed at
different prices as the
temperature varies.
© 2019 Pearson Education
70.
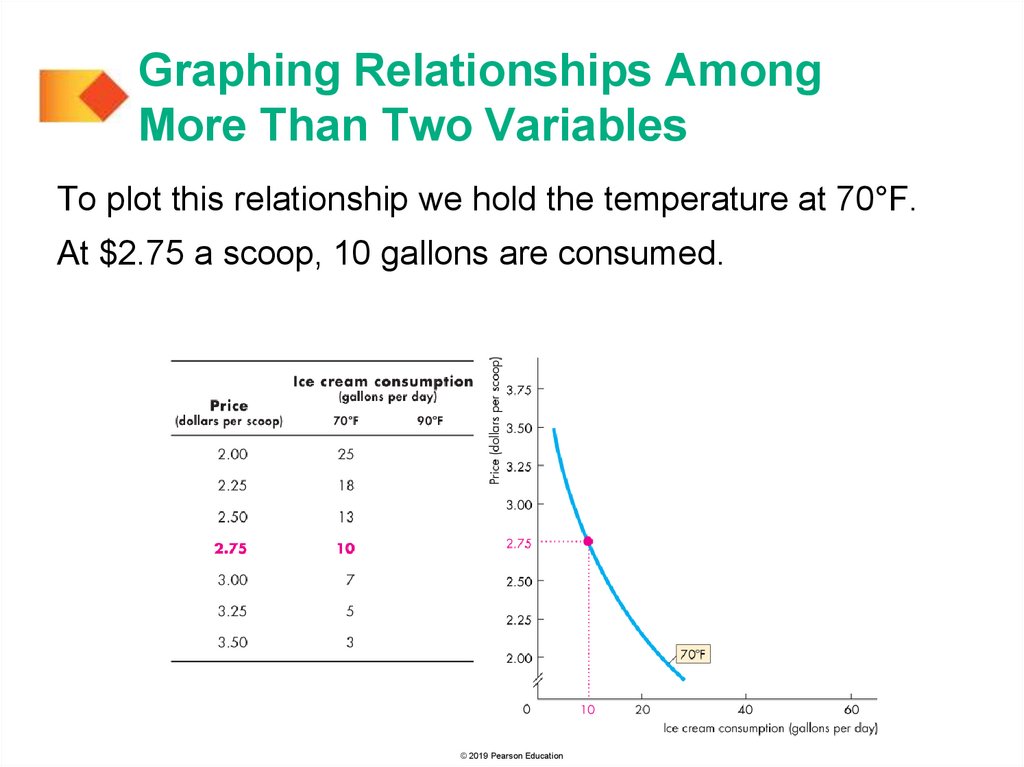
Graphing Relationships AmongMore Than Two Variables
To plot this relationship we hold the temperature at 70°F.
At $2.75 a scoop, 10 gallons are consumed.
© 2019 Pearson Education
71.
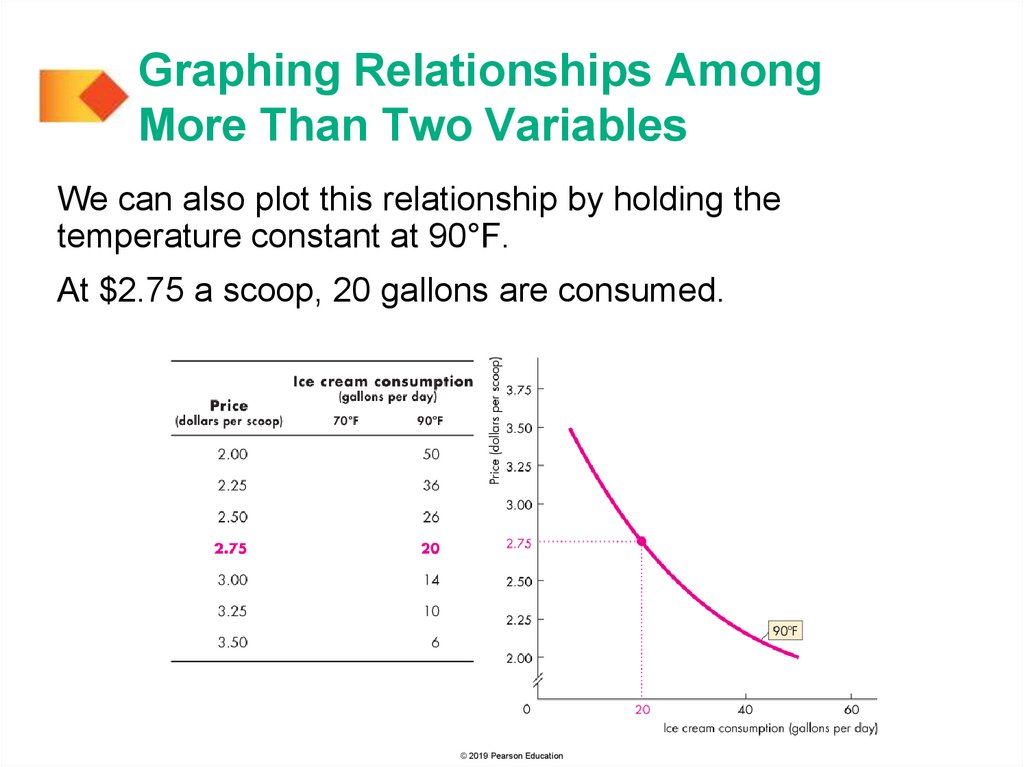
Graphing Relationships AmongMore Than Two Variables
We can also plot this relationship by holding the
temperature constant at 90°F.
At $2.75 a scoop, 20 gallons are consumed.
© 2019 Pearson Education
72.
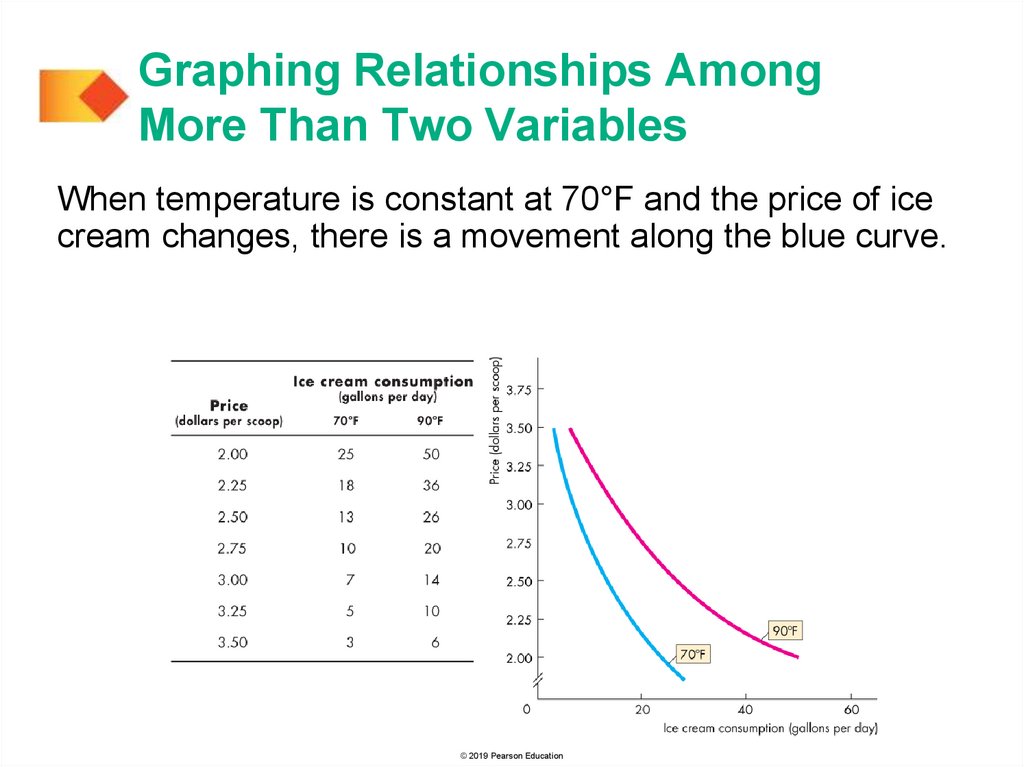
Graphing Relationships AmongMore Than Two Variables
When temperature is constant at 70°F and the price of ice
cream changes, there is a movement along the blue curve.
© 2019 Pearson Education
73.
Graphing Relationships AmongMore Than Two Variables
When temperature is constant at 90°F and the price of ice
cream changes, there is a movement along the red curve.
© 2019 Pearson Education
74.
Graphing Relationships AmongMore Than Two Variables
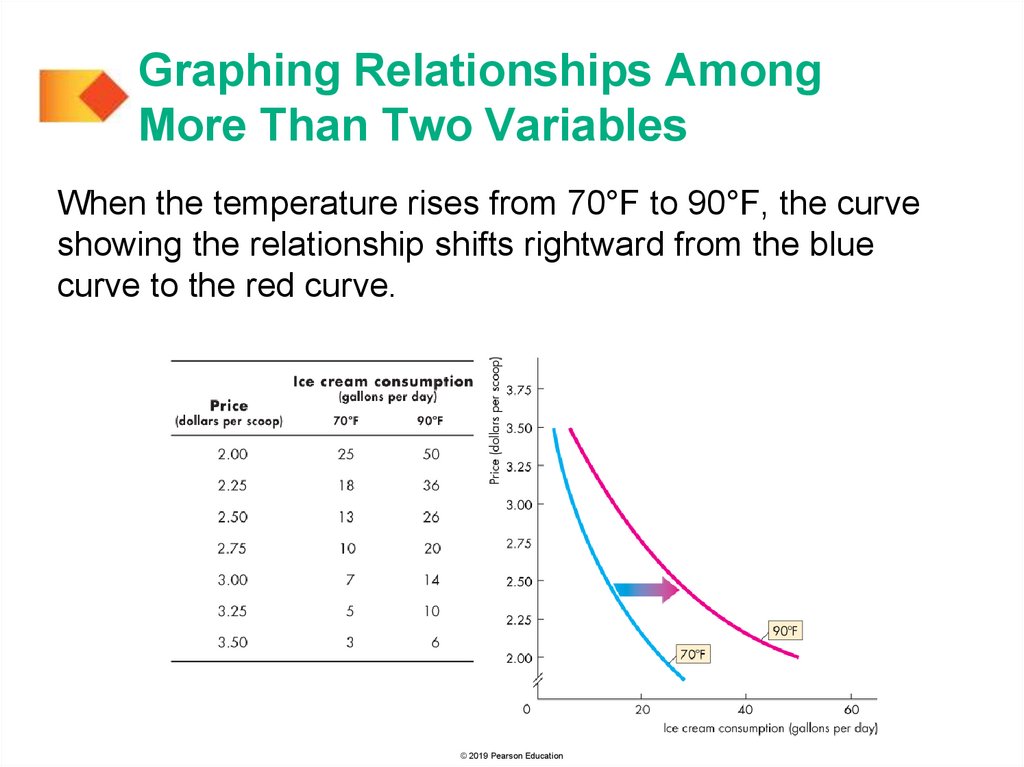
When Other Things Change
The temperature is held constant along each curve, but in
reality the temperature can change.
© 2019 Pearson Education
75.
Graphing Relationships AmongMore Than Two Variables
When the temperature rises from 70°F to 90°F, the curve
showing the relationship shifts rightward from the blue
curve to the red curve.
© 2019 Pearson Education