


 economics
Similar presentations:


The economic problem
1.
© 2019 Pearson Education2.
2THE ECONOMIC
PROBLEM
© 2019 Pearson Education
3.
After studying this chapter, you will be able to:Define the production possibilities frontier and use it
to calculate opportunity cost
Define preferences and marginal benefit and
describe an efficient allocation of resources
Explain how specialization and trade make resource
use more efficient
Explain how current production choices expand
future production possibilities, but change what we
produce, and destroy and create jobs
Describe the economic institutions that coordinate
decisions
© 2019 Pearson Education
4.
Production Possibilities andOpportunity Cost
The production possibilities frontier (PPF) is the
boundary between those combinations of goods and
services that can be produced and those that cannot.
To illustrate the PPF, we focus on two goods at a time and
hold the quantities of all other goods and services
constant.
That is, we look at a model economy in which everything
remains the same (ceteris paribus) except the two goods
we’re considering.
© 2019 Pearson Education
5.
Production Possibilities andOpportunity Cost
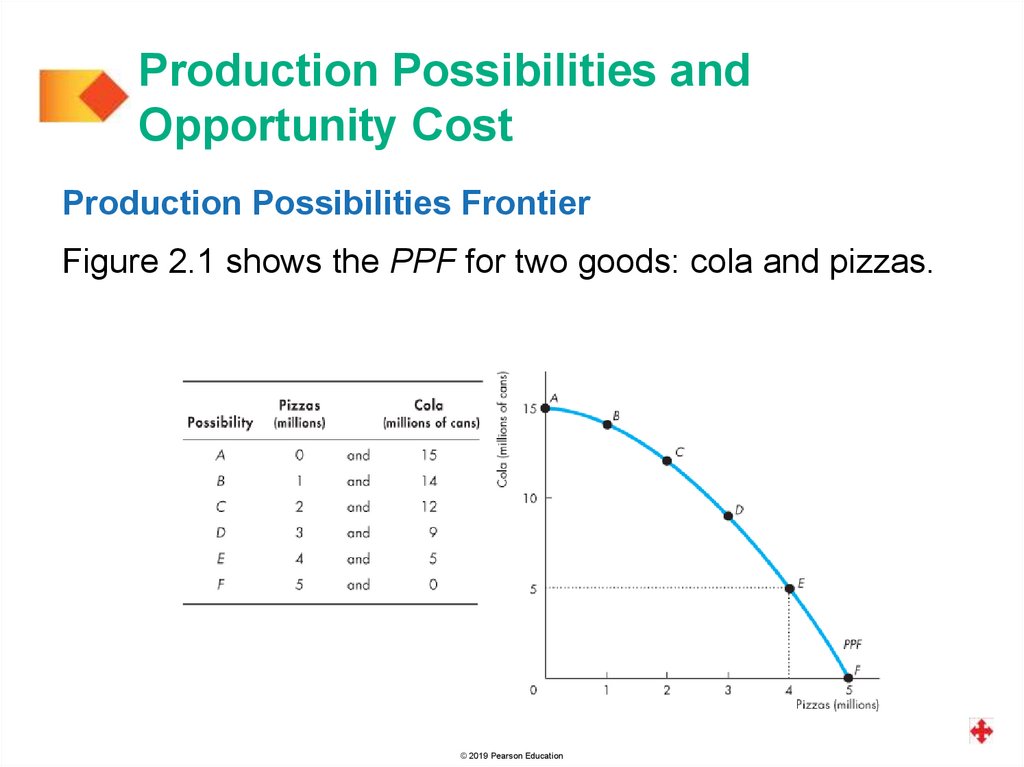
Production Possibilities Frontier
Figure 2.1 shows the PPF for two goods: cola and pizzas.
© 2019 Pearson Education
6.
Production Possibilities andOpportunity Cost
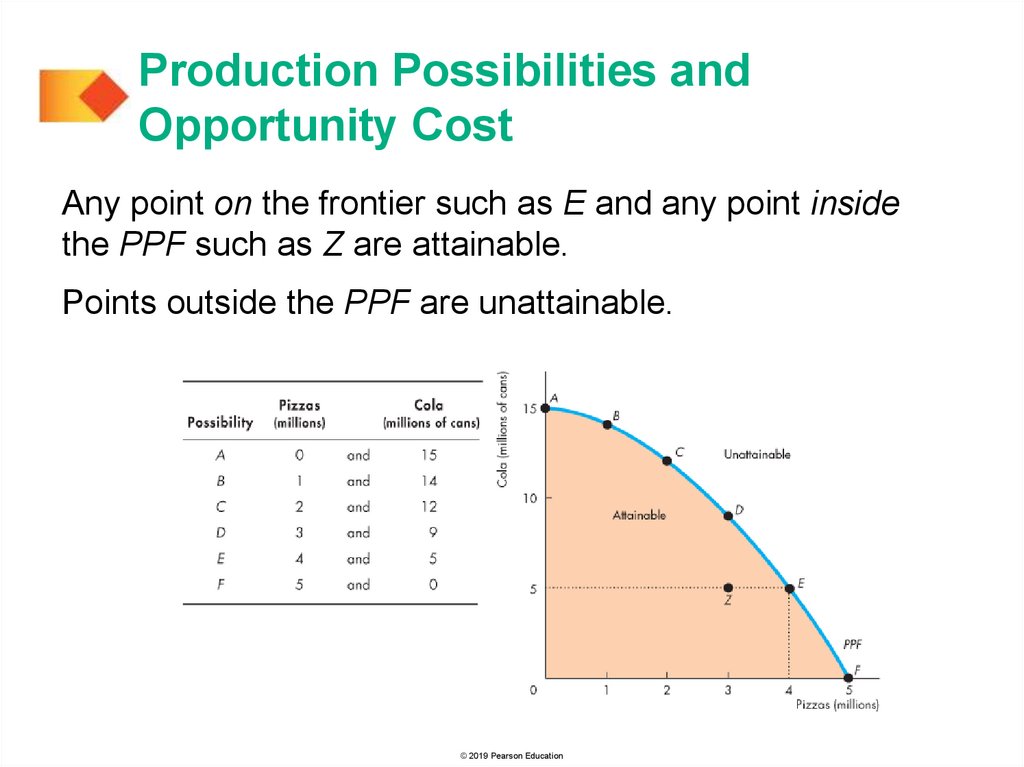
Any point on the frontier such as E and any point inside
the PPF such as Z are attainable.
Points outside the PPF are unattainable.
© 2019 Pearson Education
7.
Production Possibilities andOpportunity Cost
Production Efficiency
We achieve production
efficiency if we cannot
produce more of one good
without producing less of
some other good.
All points on the PPF are
efficient.
© 2019 Pearson Education
8.
Production Possibilities andOpportunity Cost
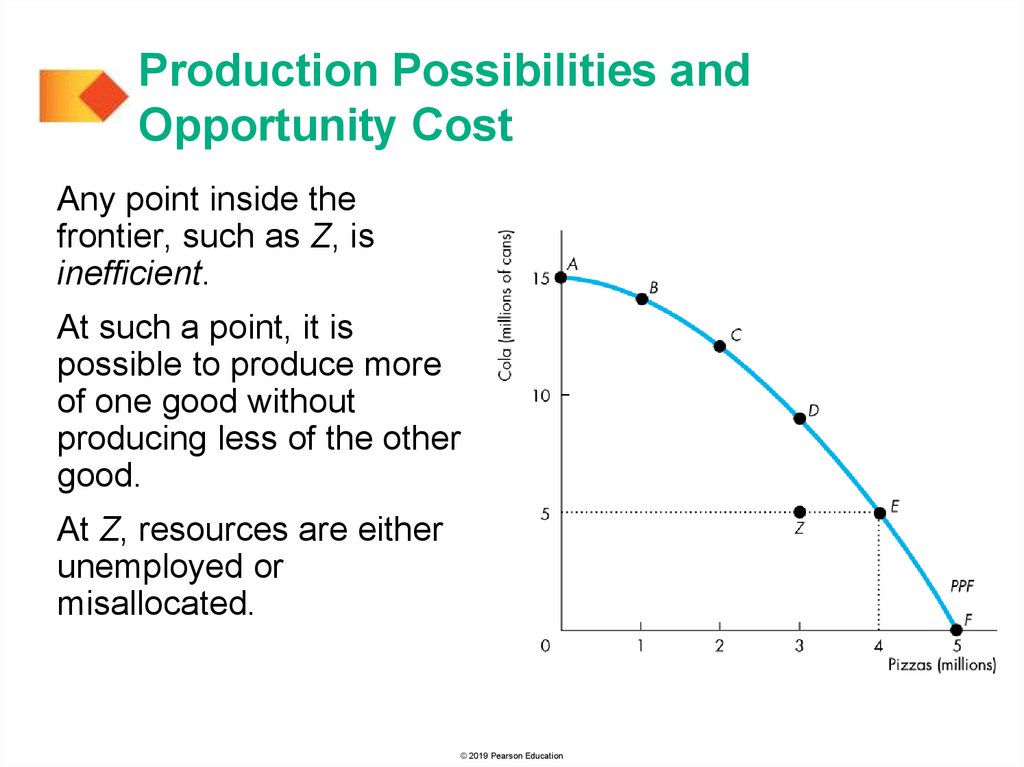
Any point inside the
frontier, such as Z, is
inefficient.
At such a point, it is
possible to produce more
of one good without
producing less of the other
good.
At Z, resources are either
unemployed or
misallocated.
© 2019 Pearson Education
9.
Production Possibilities andOpportunity Cost
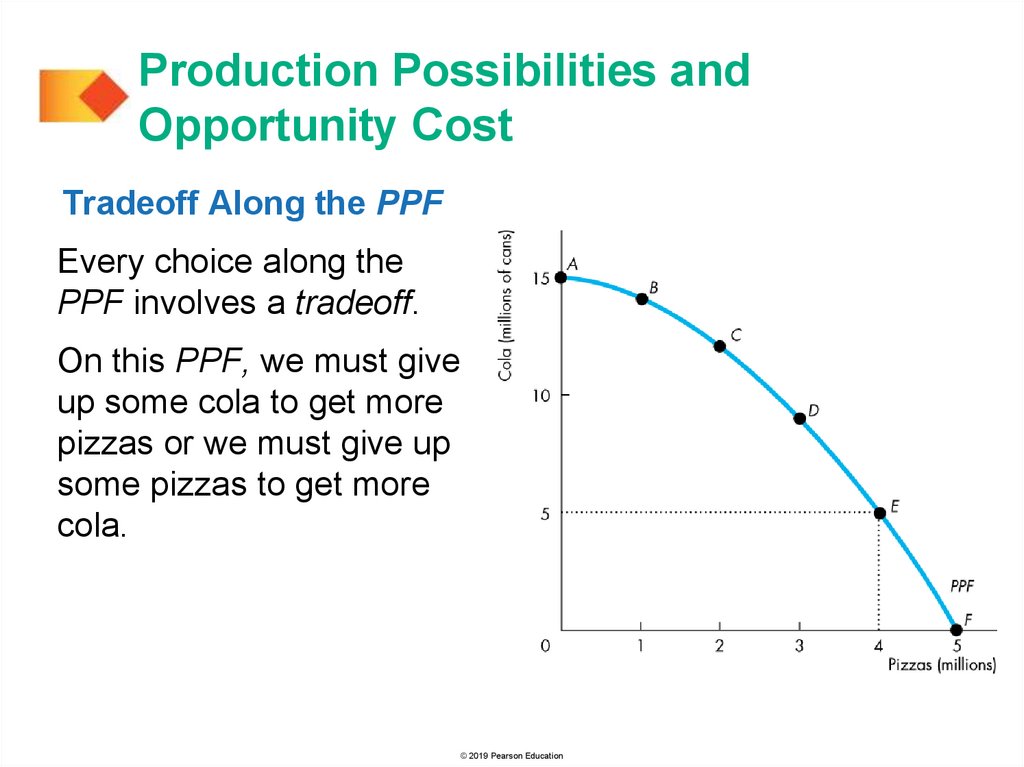
Tradeoff Along the PPF
Every choice along the
PPF involves a tradeoff.
On this PPF, we must give
up some cola to get more
pizzas or we must give up
some pizzas to get more
cola.
© 2019 Pearson Education
10.
Production Possibilities andOpportunity Cost
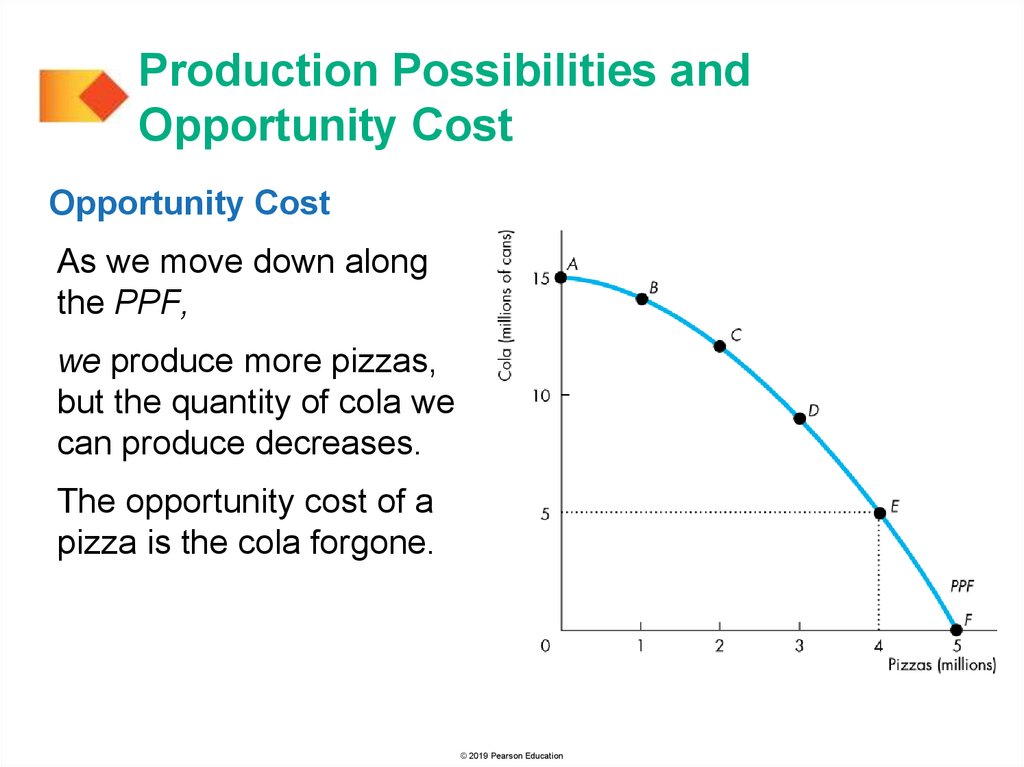
Opportunity Cost
As we move down along
the PPF,
we produce more pizzas,
but the quantity of cola we
can produce decreases.
The opportunity cost of a
pizza is the cola forgone.
© 2019 Pearson Education
11.
Production Possibilities andOpportunity Cost
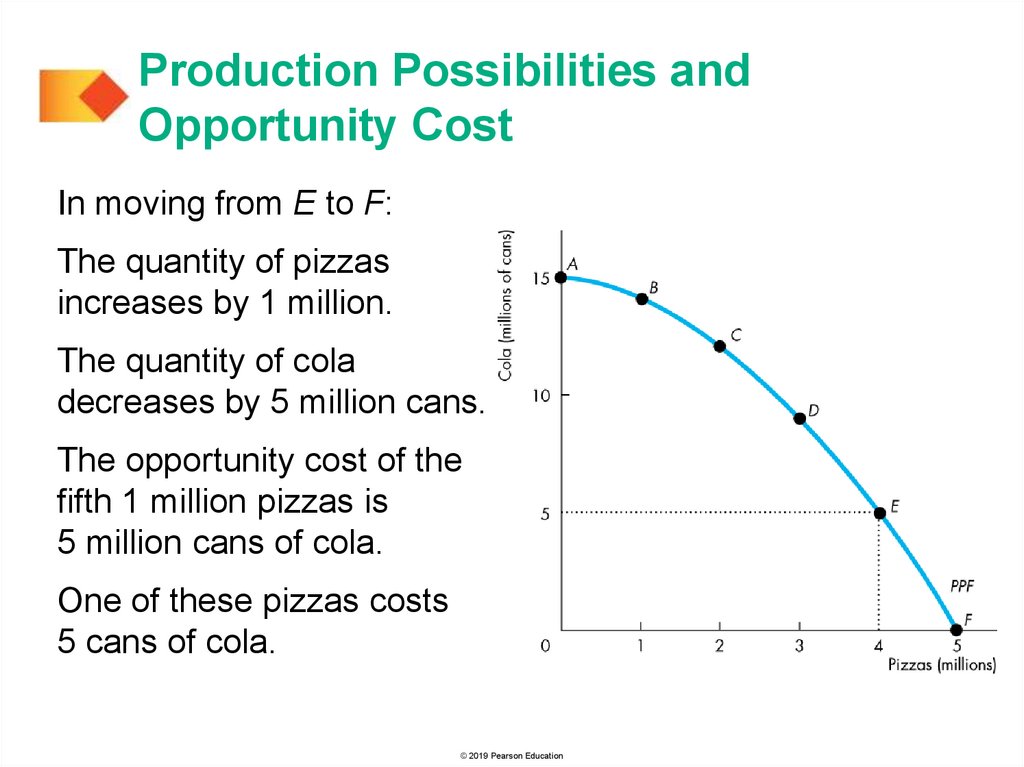
In moving from E to F:
The quantity of pizzas
increases by 1 million.
The quantity of cola
decreases by 5 million cans.
The opportunity cost of the
fifth 1 million pizzas is
5 million cans of cola.
One of these pizzas costs
5 cans of cola.
© 2019 Pearson Education
12.
Production Possibilities andOpportunity Cost
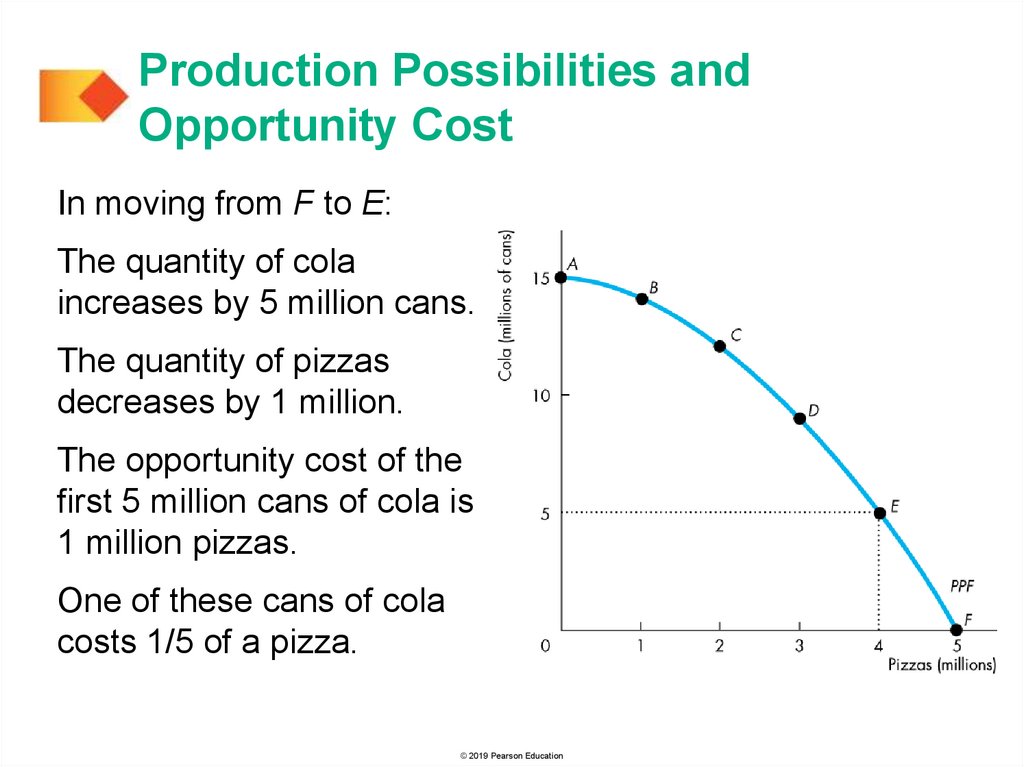
In moving from F to E:
The quantity of cola
increases by 5 million cans.
The quantity of pizzas
decreases by 1 million.
The opportunity cost of the
first 5 million cans of cola is
1 million pizzas.
One of these cans of cola
costs 1/5 of a pizza.
© 2019 Pearson Education
13.
Production Possibilities andOpportunity Cost
Opportunity Cost Is a
Ratio
The opportunity cost of
producing a can of cola is
the inverse of the
opportunity cost of
producing a pizza.
One pizza costs 5 cans of
cola.
One can of cola costs 1/5
of a pizza.
© 2019 Pearson Education
14.
Production Possibilities andOpportunity Cost
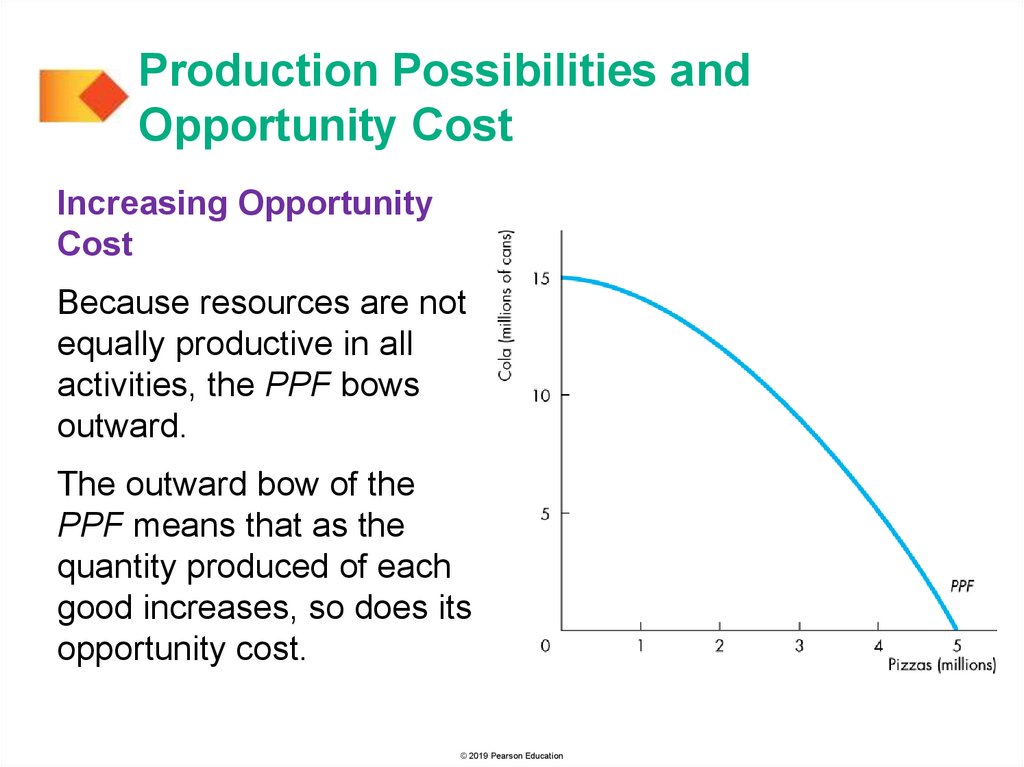
Increasing Opportunity
Cost
Because resources are not
equally productive in all
activities, the PPF bows
outward.
The outward bow of the
PPF means that as the
quantity produced of each
good increases, so does its
opportunity cost.
© 2019 Pearson Education
15.
Using Resources EfficientlyAll the points along the PPF are efficient.
To determine which of the alternative efficient
quantities to produce, we compare costs and benefits.
The PPF and Marginal Cost
The PPF determines opportunity cost.
The marginal cost of a good or service is the
opportunity cost of producing one more unit of it.
© 2019 Pearson Education
16.
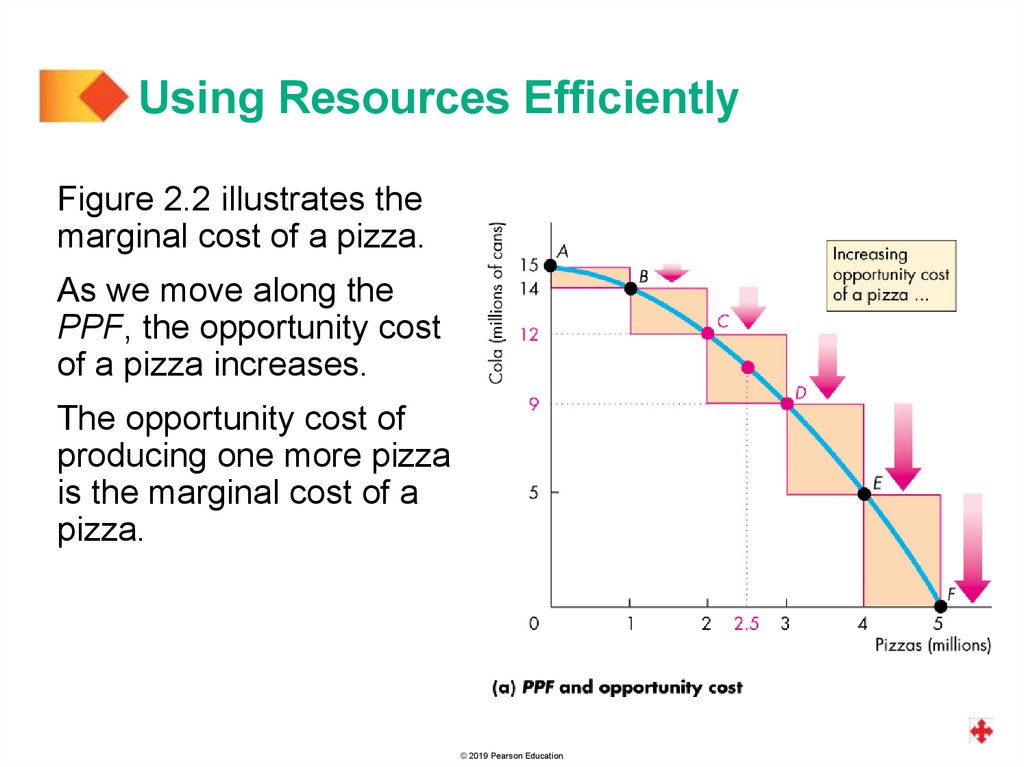
Using Resources EfficientlyFigure 2.2 illustrates the
marginal cost of a pizza.
As we move along the
PPF, the opportunity cost
of a pizza increases.
The opportunity cost of
producing one more pizza
is the marginal cost of a
pizza.
© 2019 Pearson Education
17.
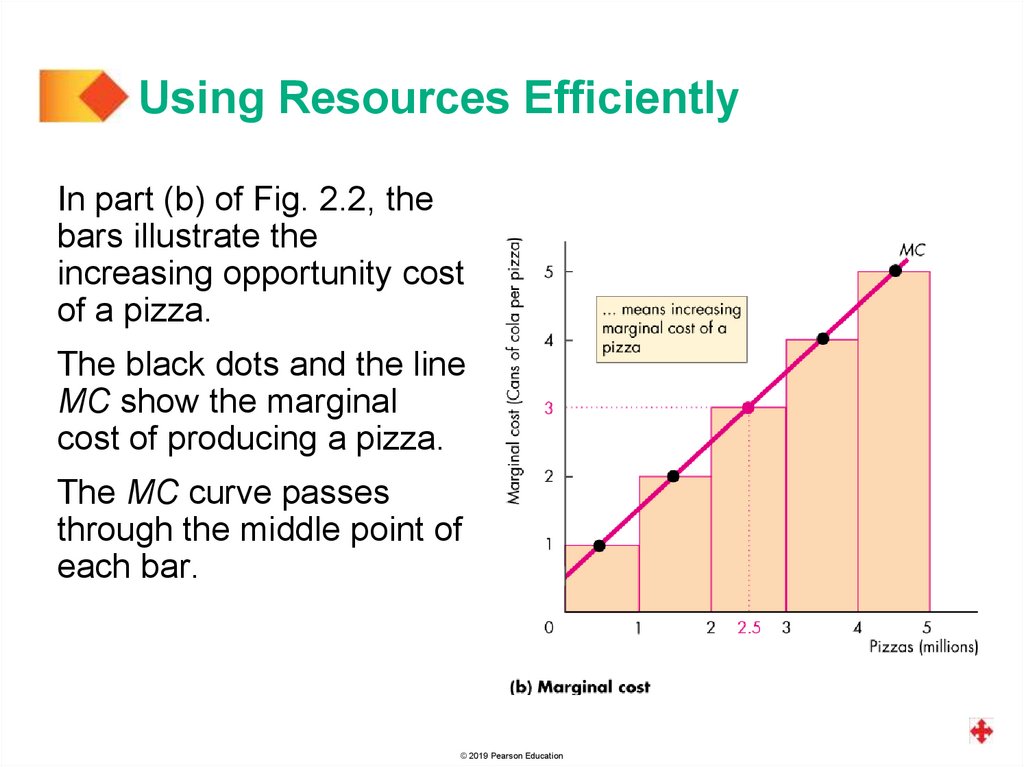
Using Resources EfficientlyIn part (b) of Fig. 2.2, the
bars illustrate the
increasing opportunity cost
of a pizza.
The black dots and the line
MC show the marginal
cost of producing a pizza.
The MC curve passes
through the middle point of
each bar.
© 2019 Pearson Education
18.
Using Resources EfficientlyPreferences and Marginal Benefit
Preferences are a description of a person’s likes and
dislikes.
To describe preferences, economists use the concepts
of marginal benefit and the marginal benefit curve.
The marginal benefit of a good or service is the
benefit received from consuming one more unit of it.
We measure marginal benefit by the amount that a
person is willing to pay for an additional unit of a good
or service.
© 2019 Pearson Education
19.
Using Resources EfficientlyIt is a general principle that:
The more we have of any good, the smaller is its
marginal benefit and …
the less we are willing to pay for an additional unit of it.
We call this general principle the principle of decreasing
marginal benefit.
The marginal benefit curve shows the relationship
between the marginal benefit of a good and the quantity
of that good consumed.
© 2019 Pearson Education
20.
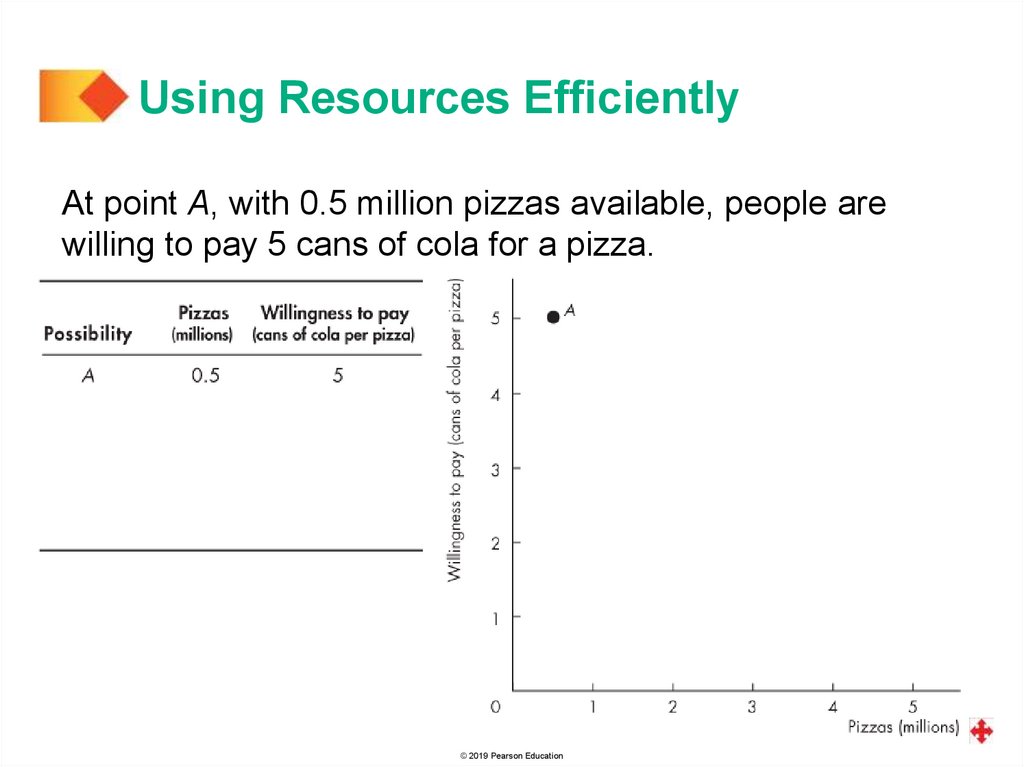
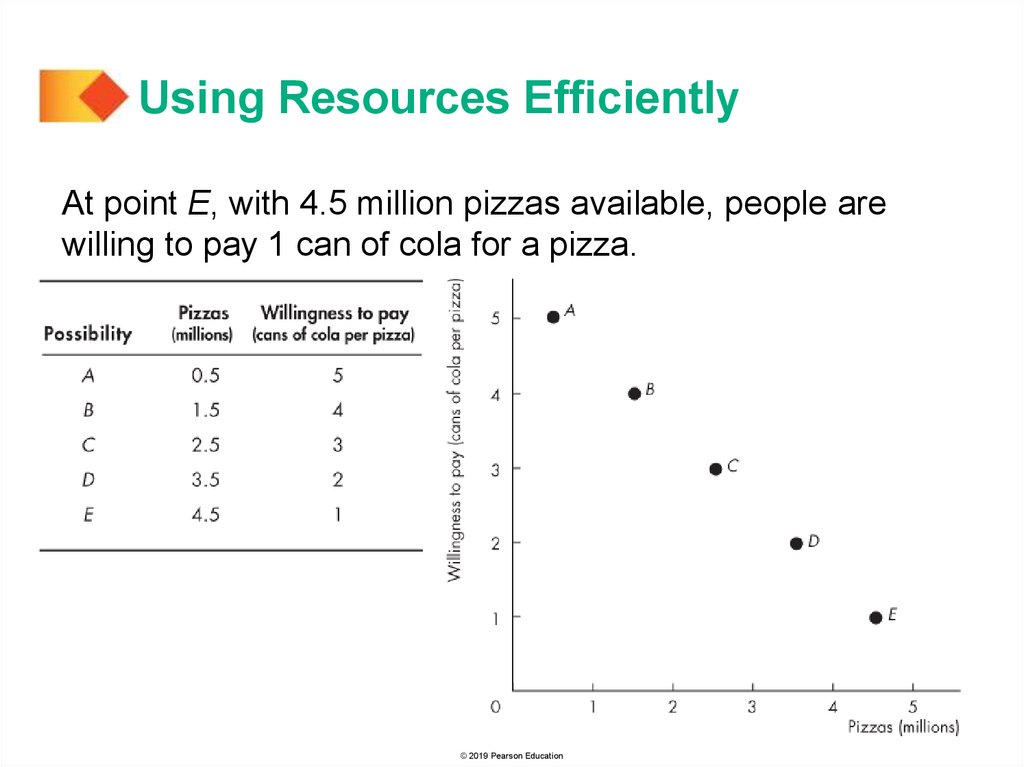
Using Resources EfficientlyAt point A, with 0.5 million pizzas available, people are
willing to pay 5 cans of cola for a pizza.
.
© 2019 Pearson Education
21.
Using Resources EfficientlyAt point B, with 1.5 million pizzas available, people are
willing to pay 4 cans of cola for a pizza
© 2019 Pearson Education
22.
Using Resources EfficientlyAt point E, with 4.5 million pizzas available, people are
willing to pay 1 can of cola for a pizza.
© 2019 Pearson Education
23.
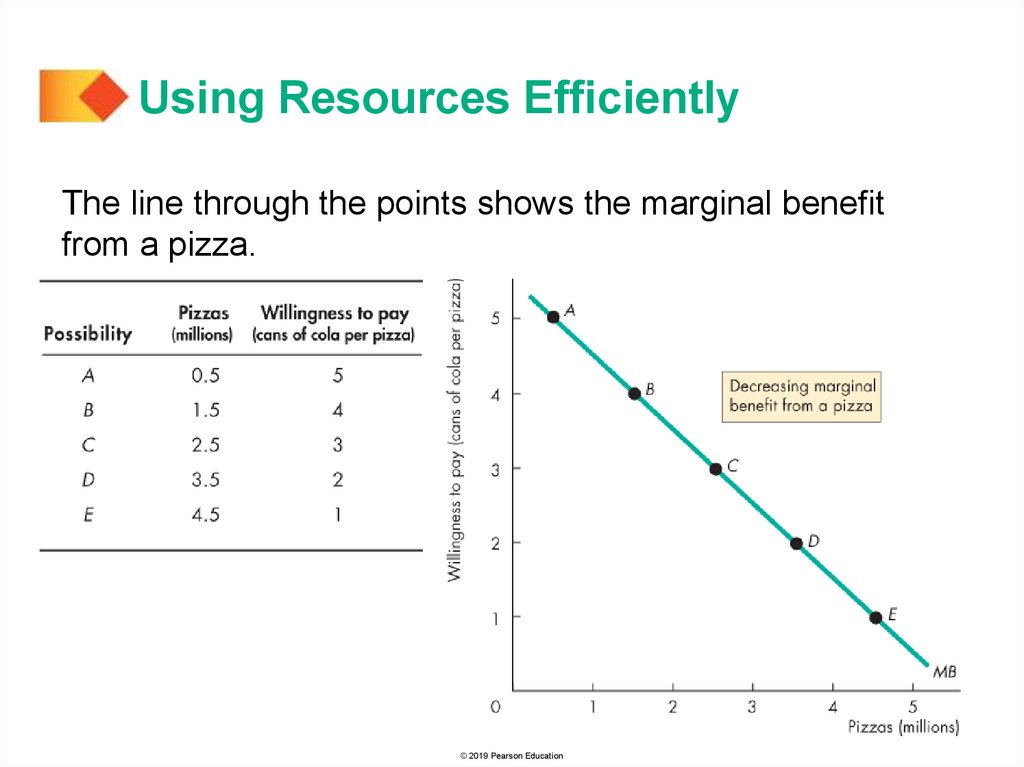
Using Resources EfficientlyThe line through the points shows the marginal benefit
from a pizza.
© 2019 Pearson Education
24.
Using Resources EfficientlyAllocative Efficiency
When we cannot produce more of any one good
without giving up some other good, we have achieved
production efficiency.
We are producing at a point on the PPF.
When we cannot produce more of any one good
without giving up some other good that we value more
highly, we have achieved allocative efficiency.
We are producing at the point on the PPF that we
prefer above all other points.
© 2019 Pearson Education
25.
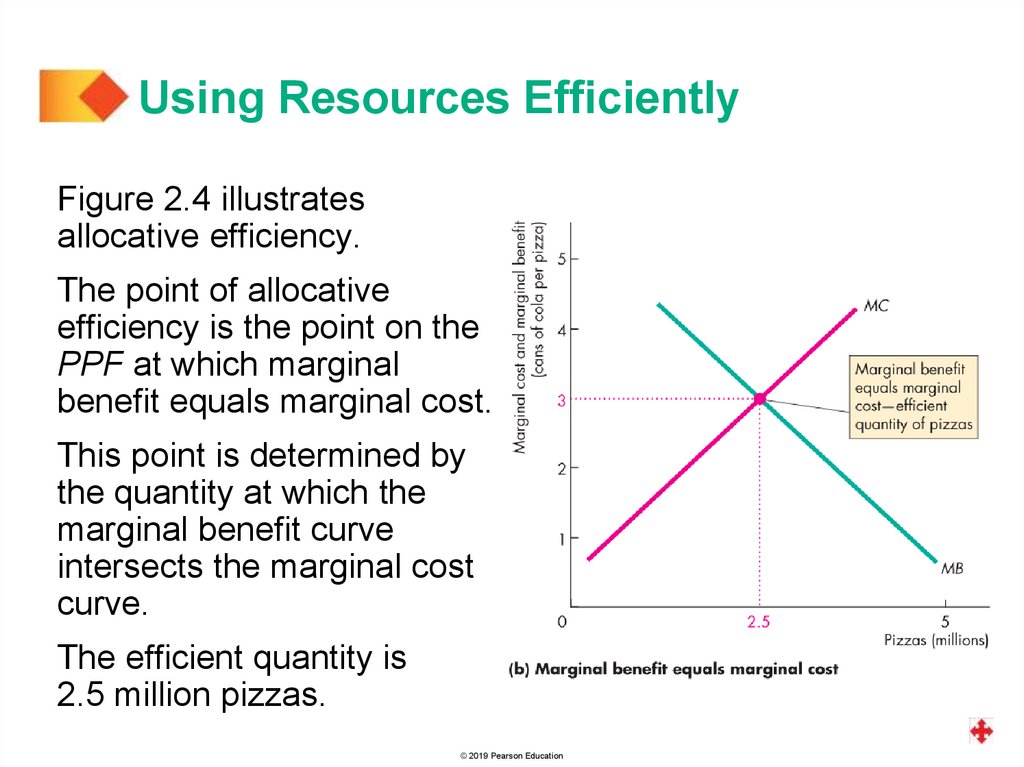
Using Resources EfficientlyFigure 2.4 illustrates
allocative efficiency.
The point of allocative
efficiency is the point on the
PPF at which marginal
benefit equals marginal cost.
This point is determined by
the quantity at which the
marginal benefit curve
intersects the marginal cost
curve.
The efficient quantity is
2.5 million pizzas.
© 2019 Pearson Education
26.
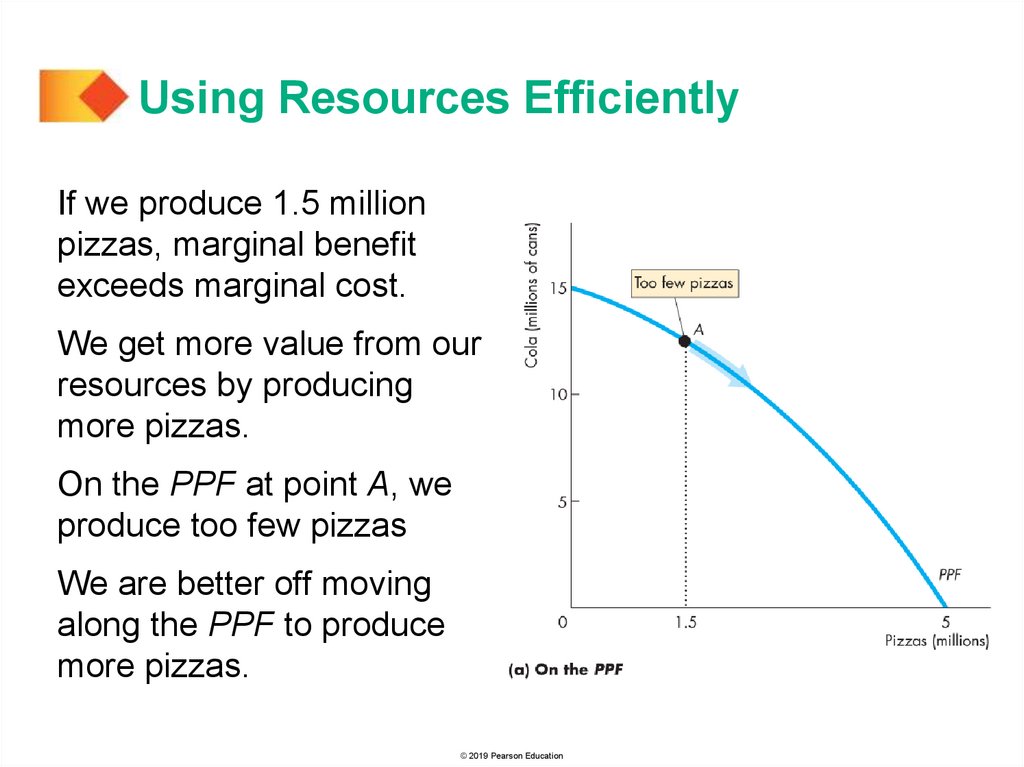
Using Resources EfficientlyIf we produce 1.5 million
pizzas, marginal benefit
exceeds marginal cost.
We get more value from our
resources by producing
more pizzas.
On the PPF at point A, we
produce too few pizzas
We are better off moving
along the PPF to produce
more pizzas.
© 2019 Pearson Education
27.
Using Resources EfficientlyIf we produce 3.5 million
pizzas, marginal cost
exceeds marginal benefit.
We get more value from our
resources by producing
fewer pizzas.
On the PPF at point C, we
produce too many pizzas.
We are better off moving
along the PPF to produce
fewer pizzas.
© 2019 Pearson Education
28.
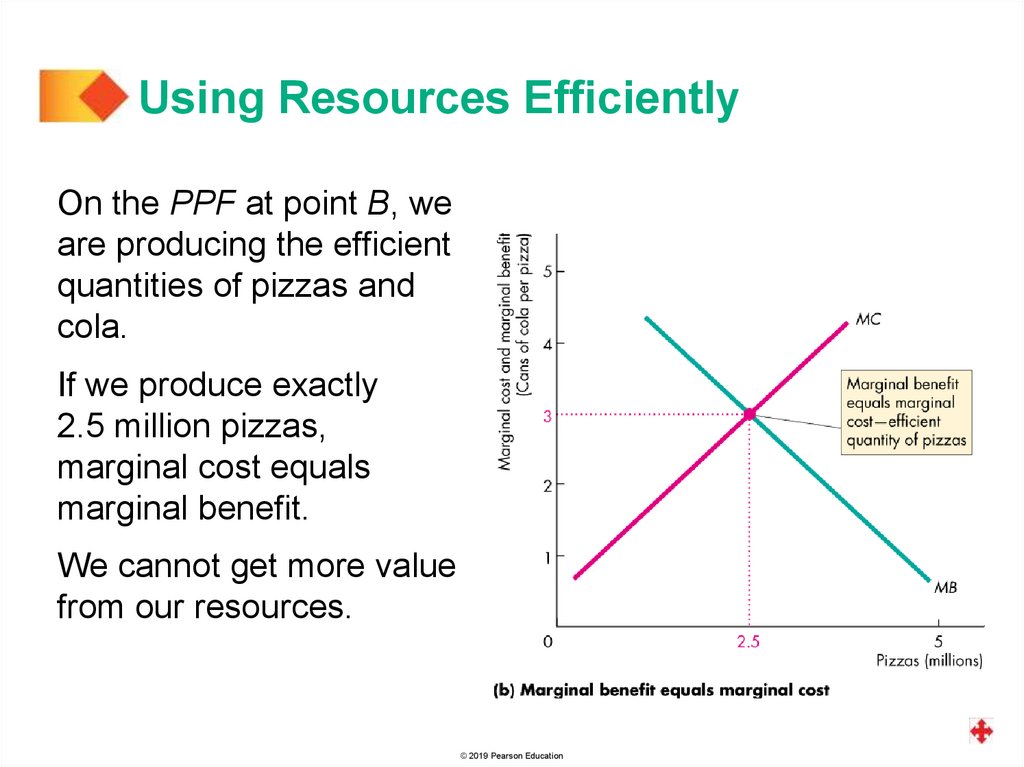
Using Resources EfficientlyOn the PPF at point B, we
are producing the efficient
quantities of pizzas and
cola.
If we produce exactly
2.5 million pizzas,
marginal cost equals
marginal benefit.
We cannot get more value
from our resources.
© 2019 Pearson Education
29.
Gains from TradeComparative Advantage and Absolute Advantage
A person has a comparative advantage in an activity if
that person can perform the activity at a lower opportunity
cost than anyone else.
A person has an absolute advantage if that person is
more productive than others.
Absolute advantage involves comparing productivities
while comparative advantage involves comparing
opportunity costs.
Let’s look at Joe and Liz who operate smoothie bars.
© 2019 Pearson Education
30.
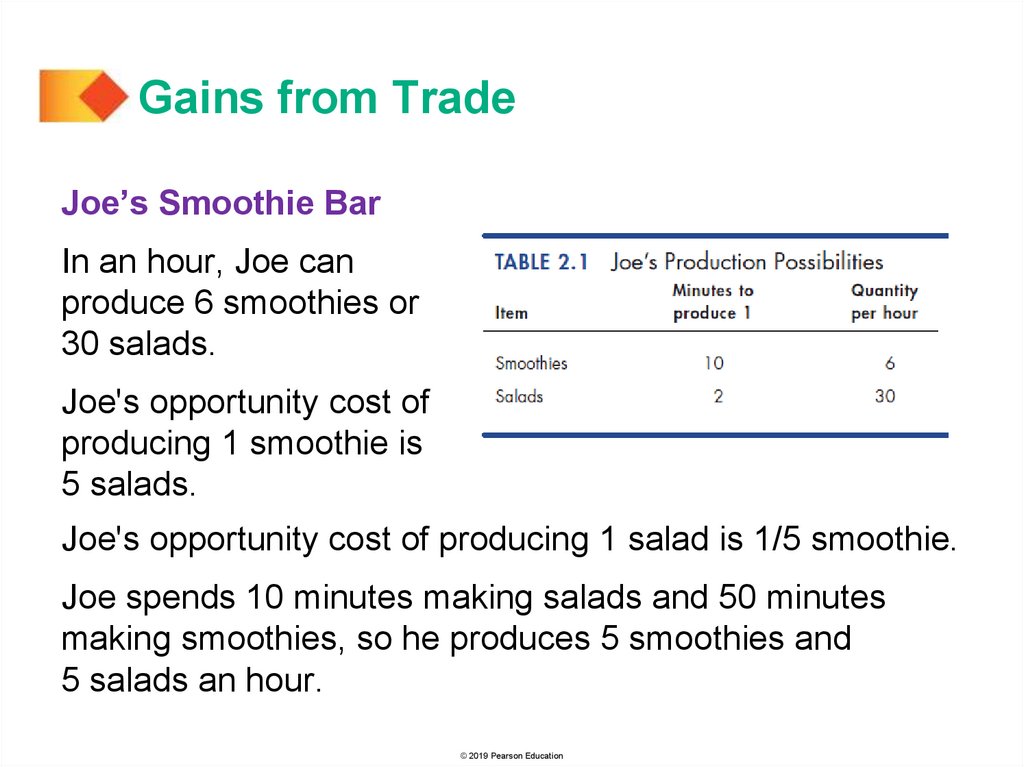
Gains from TradeJoe’s Smoothie Bar
In an hour, Joe can
produce 6 smoothies or
30 salads.
Joe's opportunity cost of
producing 1 smoothie is
5 salads.
Joe's opportunity cost of producing 1 salad is 1/5 smoothie.
Joe spends 10 minutes making salads and 50 minutes
making smoothies, so he produces 5 smoothies and
5 salads an hour.
© 2019 Pearson Education
31.
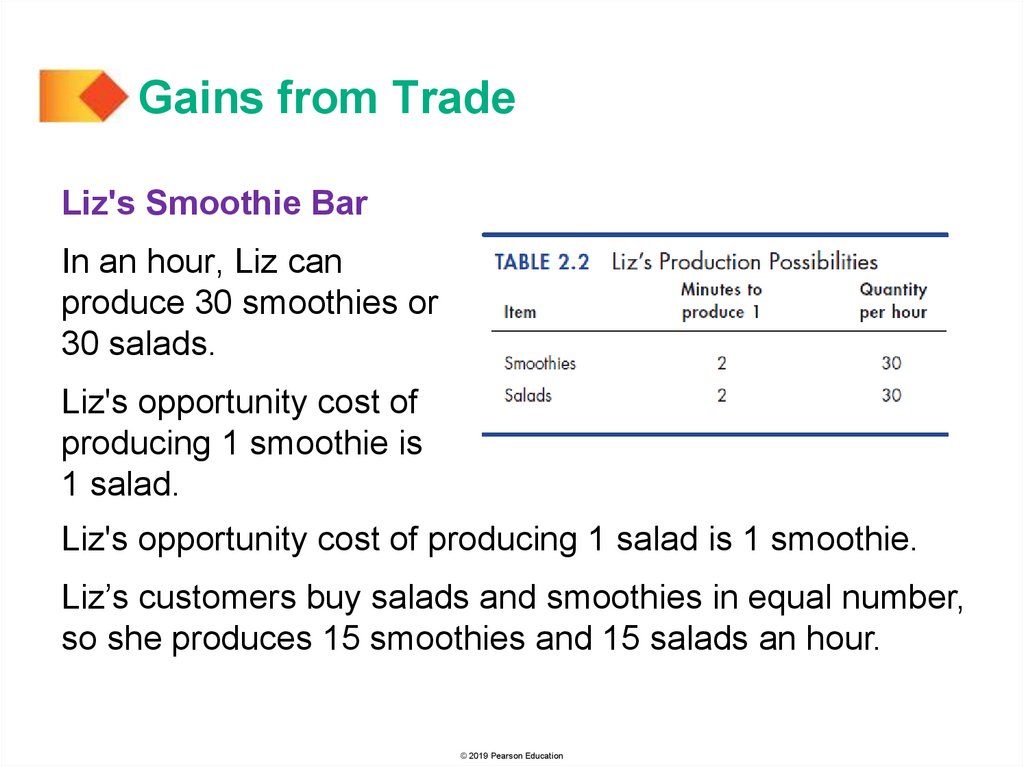
Gains from TradeLiz's Smoothie Bar
In an hour, Liz can
produce 30 smoothies or
30 salads.
Liz's opportunity cost of
producing 1 smoothie is
1 salad.
Liz's opportunity cost of producing 1 salad is 1 smoothie.
Liz’s customers buy salads and smoothies in equal number,
so she produces 15 smoothies and 15 salads an hour.
© 2019 Pearson Education
32.
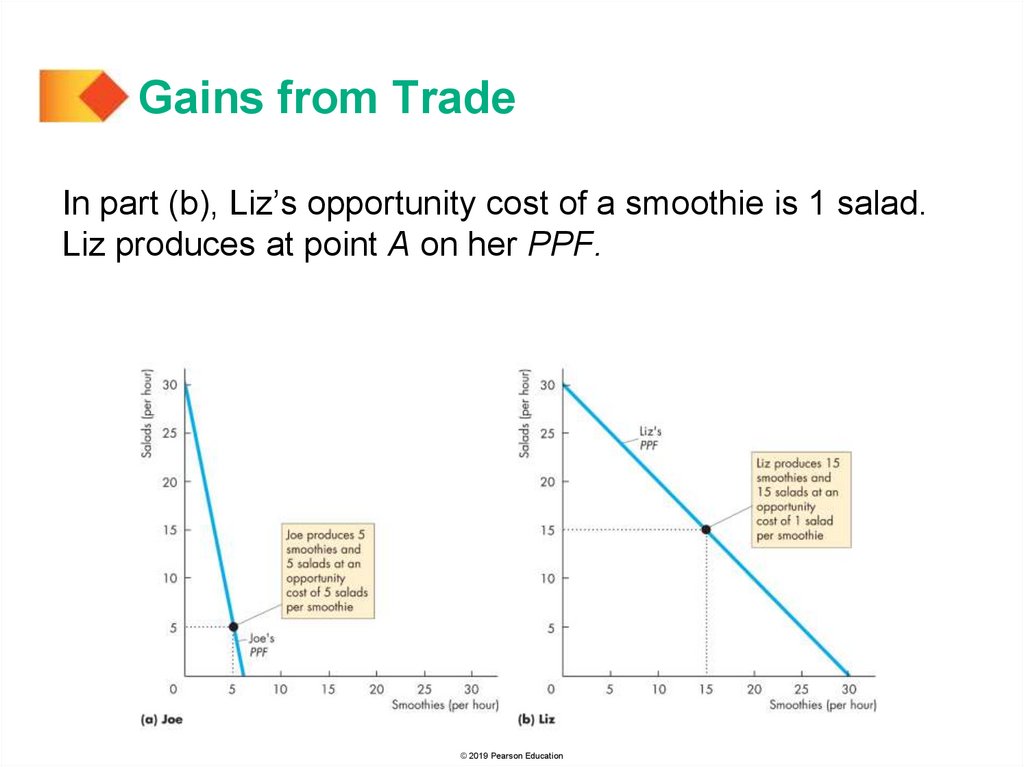
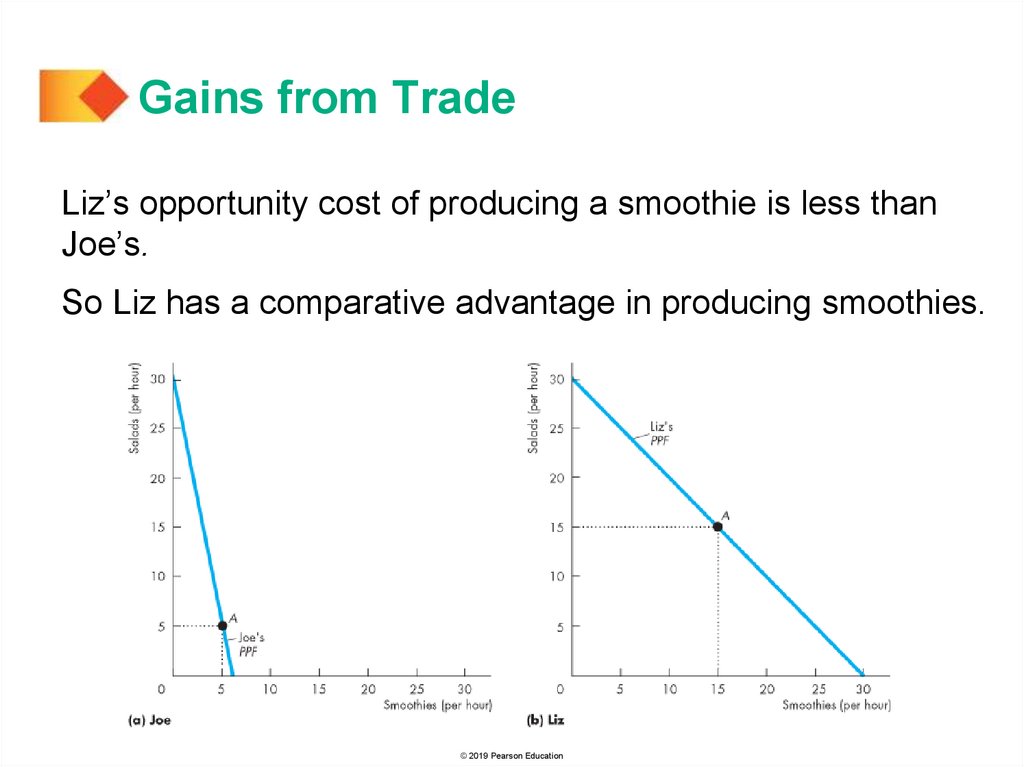
Gains from TradeFigure 2.5 shows the production possibility frontiers.
In part (a), Joe’s opportunity cost of a smoothie is
5 salads. Joe produces at point A on his PPF.
© 2019 Pearson Education
33.
Gains from TradeIn part (b), Liz’s opportunity cost of a smoothie is 1 salad.
Liz produces at point A on her PPF.
© 2019 Pearson Education
34.
Gains from TradeJoe’s Comparative Advantage
Joe’s opportunity cost of a salad is 1/5 smoothie.
Liz’s opportunity cost of a salad is 1 smoothie.
Joe’s opportunity cost of a salad is less than Liz’s.
So Joe has a comparative advantage in producing salads.
© 2019 Pearson Education
35.
Gains from TradeLiz’s Comparative Advantage
Liz’s opportunity cost of a smoothie is 1 salad.
Joe’s opportunity cost of a smoothie is 5 salads.
Liz’s opportunity cost of a smoothie is less than Joe’s.
So Liz has a comparative advantage in producing
smoothies.
© 2019 Pearson Education
36.
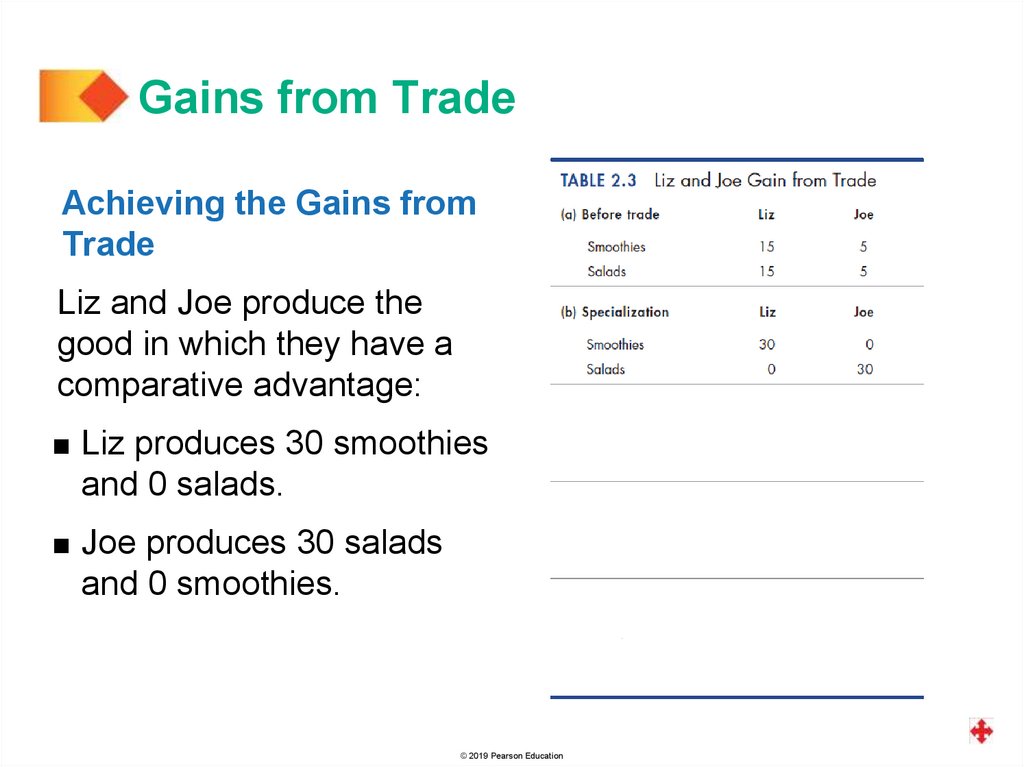
Gains from TradeAchieving the Gains from
Trade
Liz and Joe produce the
good in which they have a
comparative advantage:
Liz
produces 30 smoothies
and 0 salads.
Joe
produces 30 salads
and 0 smoothies.
© 2019 Pearson Education
37.
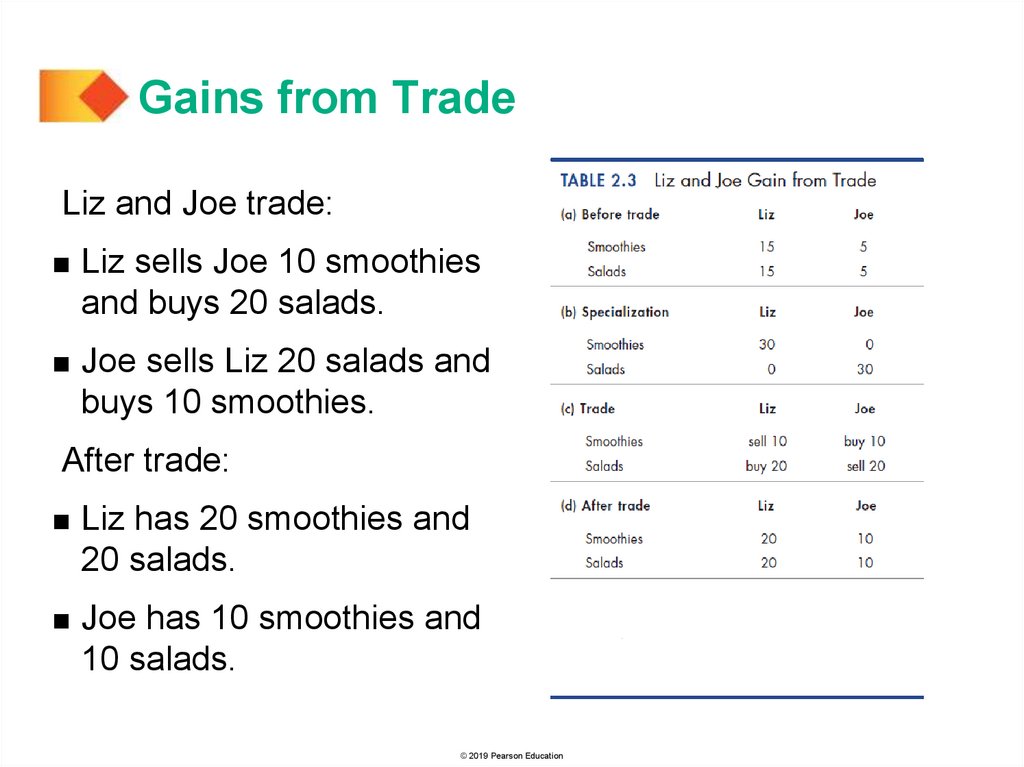
Gains from TradeLiz and Joe trade:
Liz
sells Joe 10 smoothies
and buys 20 salads.
Joe
sells Liz 20 salads and
buys 10 smoothies.
After trade:
Liz
has 20 smoothies and
20 salads.
Joe
has 10 smoothies and
10 salads.
© 2019 Pearson Education
38.
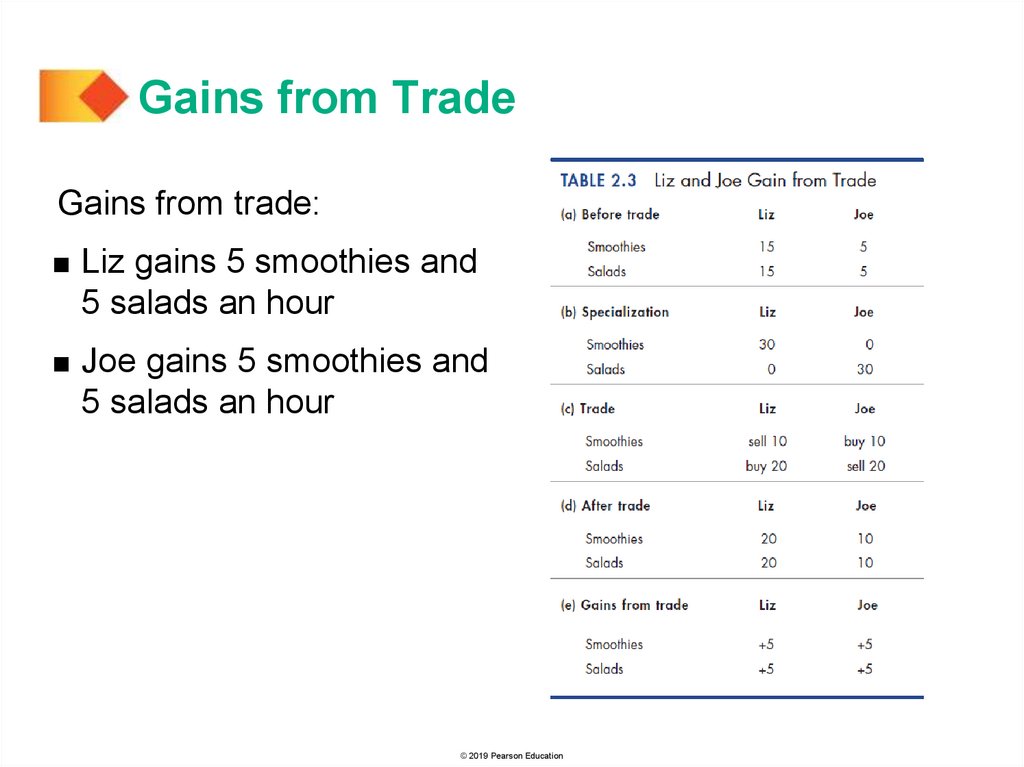
Gains from TradeGains from trade:
Liz
gains 5 smoothies and
5 salads an hour
Joe
gains 5 smoothies and
5 salads an hour
© 2019 Pearson Education
39.
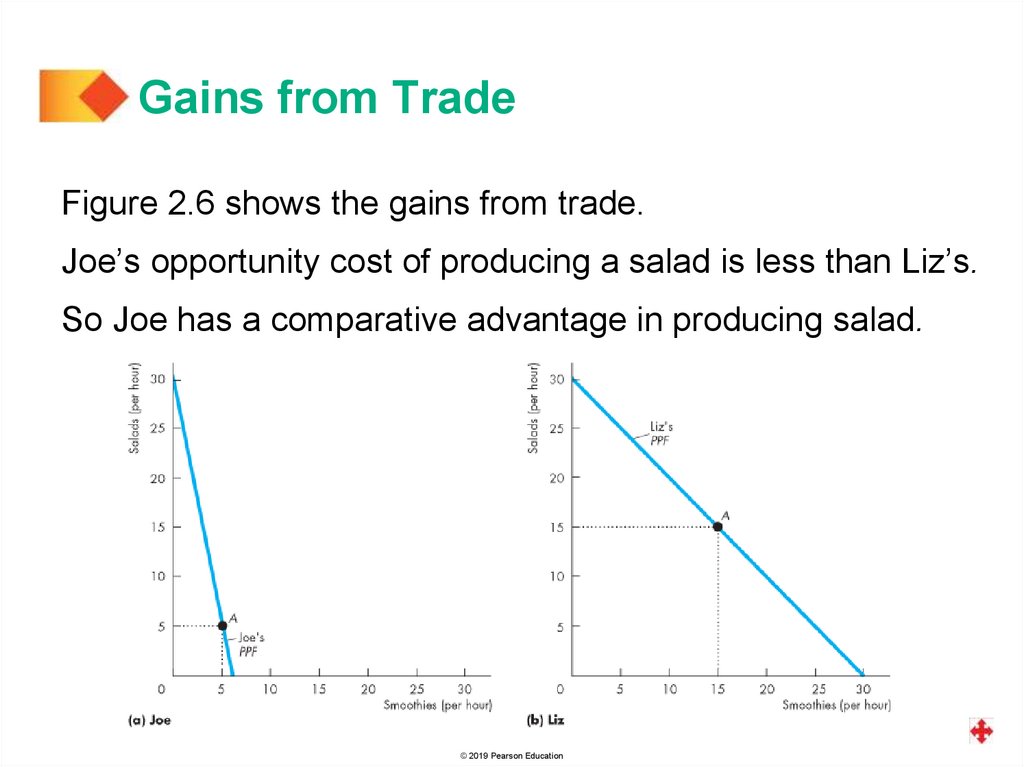
Gains from TradeFigure 2.6 shows the gains from trade.
Joe’s opportunity cost of producing a salad is less than Liz’s.
So Joe has a comparative advantage in producing salad.
© 2019 Pearson Education
40.
Gains from TradeLiz’s opportunity cost of producing a smoothie is less than
Joe’s.
So Liz has a comparative advantage in producing smoothies.
© 2019 Pearson Education
41.
Gains from TradeJoe specializes in producing salad and he produces
30 salads an hour at point B on his PPF.
© 2019 Pearson Education
42.
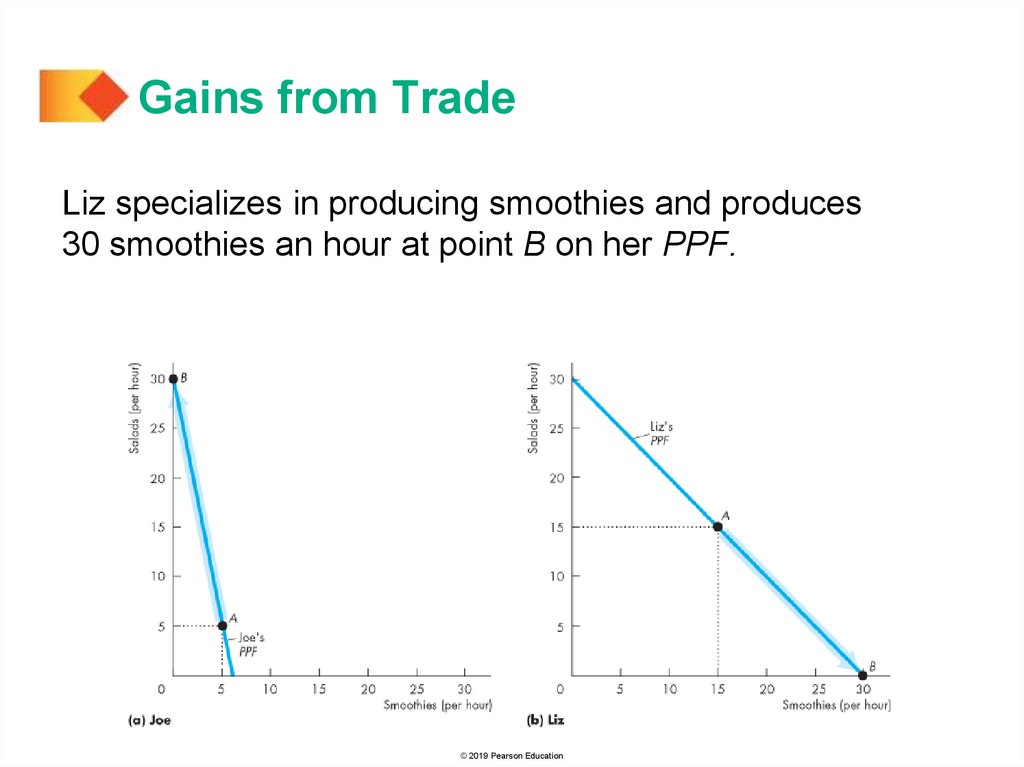
Gains from TradeLiz specializes in producing smoothies and produces
30 smoothies an hour at point B on her PPF.
© 2019 Pearson Education
43.
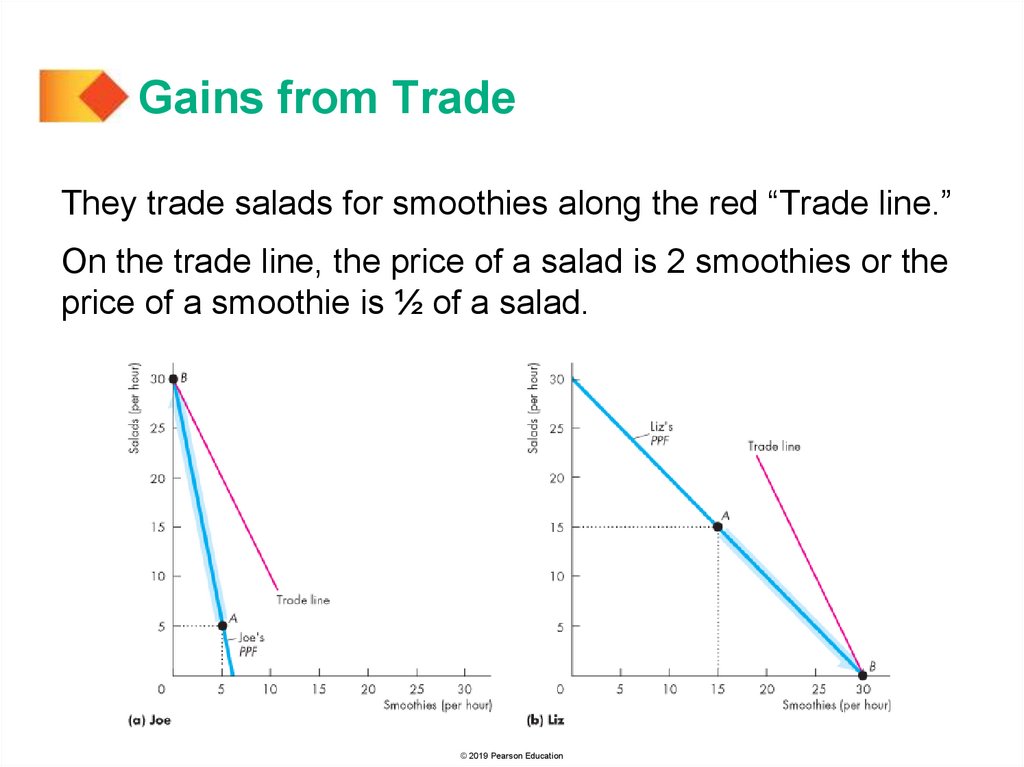
Gains from TradeThey trade salads for smoothies along the red “Trade line.”
On the trade line, the price of a salad is 2 smoothies or the
price of a smoothie is ½ of a salad.
© 2019 Pearson Education
44.
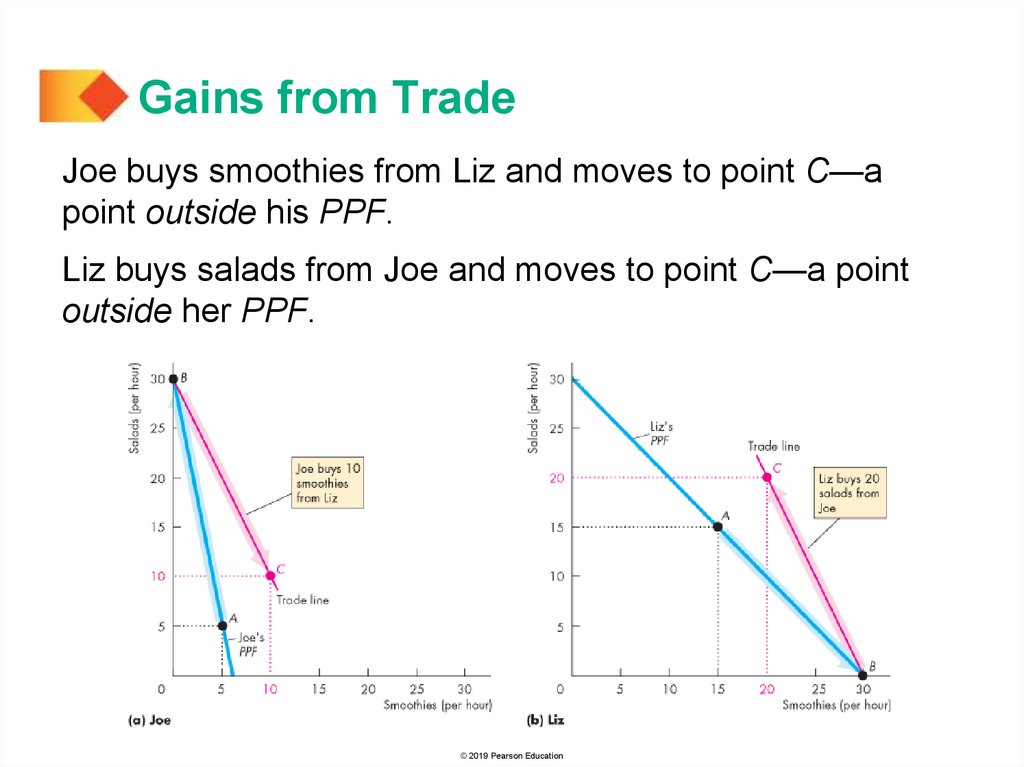
Gains from TradeJoe buys smoothies from Liz and moves to point C—a
point outside his PPF.
Liz buys salads from Joe and moves to point C—a point
outside her PPF.
© 2019 Pearson Education
45.
Gains from TradeThe Liz-Joe Economy and its PPF
With specialization and trade both Liz and Joe get
outside their PPFs.
If Liz and Joe are the only producers in the economy,
what does the economy’s PPF look like?
Figure 2.7 on the next slide shows the construction of
the economy’s PPF.
© 2019 Pearson Education
46.
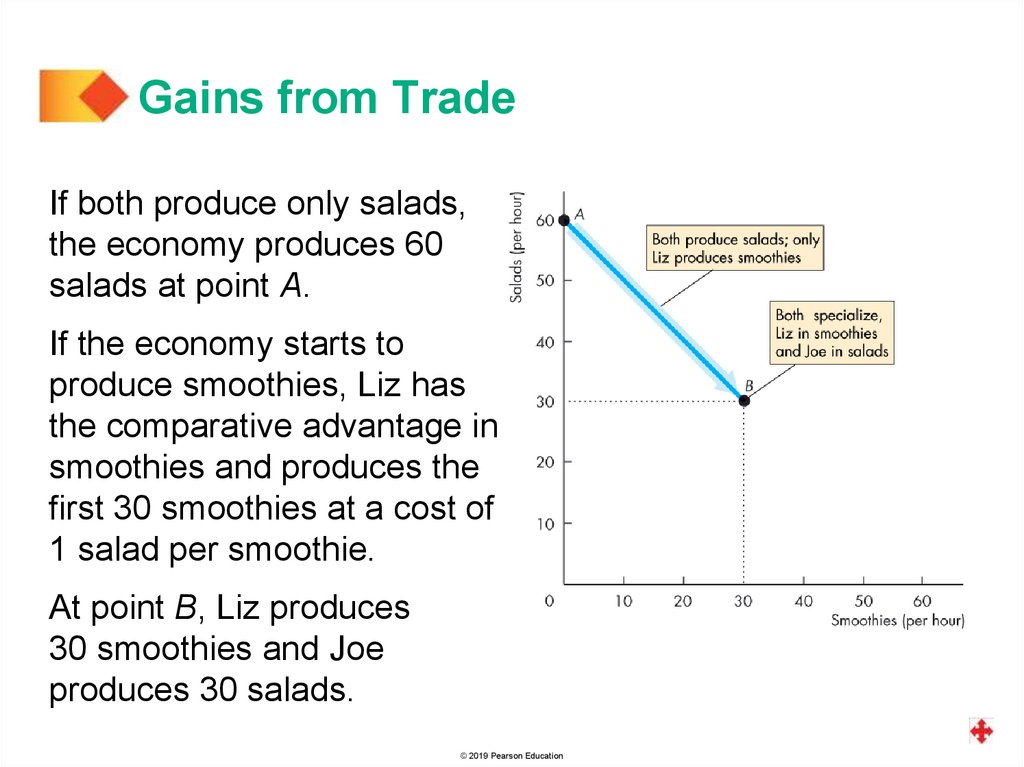
Gains from TradeIf both produce only salads,
the economy produces 60
salads at point A.
If the economy starts to
produce smoothies, Liz has
the comparative advantage in
smoothies and produces the
first 30 smoothies at a cost of
1 salad per smoothie.
At point B, Liz produces
30 smoothies and Joe
produces 30 salads.
© 2019 Pearson Education
47.
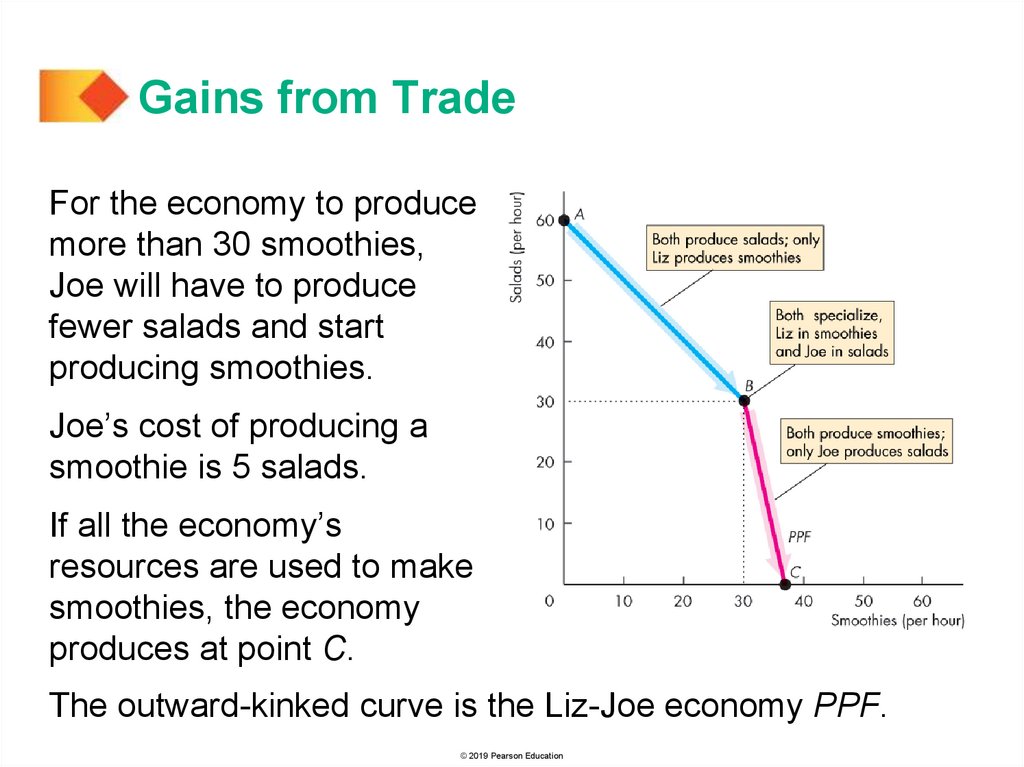
Gains from TradeFor the economy to produce
more than 30 smoothies,
Joe will have to produce
fewer salads and start
producing smoothies.
Joe’s cost of producing a
smoothie is 5 salads.
If all the economy’s
resources are used to make
smoothies, the economy
produces at point C.
The outward-kinked curve is the Liz-Joe economy PPF.
© 2019 Pearson Education
48.
Gains from TradeEfficiency and Inefficiency
When both Liz and Joe
specialize, they produce
efficiently at point B on the
economy’s PPF.
At all other points on the
economy’s PPF, one person
specializes and production
is efficient.
Production at any point on
the PPF is efficient.
© 2019 Pearson Education
49.
Gains from TradeBut with no specialization,
Joe and Liz produce at a
point inside the
economy’s PPF.
Production at point D is
inefficient.
© 2019 Pearson Education
50.
Economic GrowthThe expansion of production possibilities—an increase in
the standard of living—is called economic growth.
Two key factors influence economic growth:
Technological change
Capital accumulation
Technological change is the development of new goods
and of better ways of producing goods and services.
Capital accumulation is the growth of capital resources,
which includes human capital.
© 2019 Pearson Education
51.
Economic GrowthThe Cost of Economic Growth
To use resources in research and development and to
produce new capital, we must decrease our production
of consumption goods and services.
So economic growth is not free.
The opportunity cost of economic growth is less current
consumption.
© 2019 Pearson Education
52.
Economic GrowthFigure 2.8 illustrates the
tradeoff we face.
We can produce pizzas or
pizza ovens along PPF0.
By using some resources to
produce pizza ovens today,
the PPF shifts outward in the
future.
© 2019 Pearson Education
53.
Economic GrowthChanges in What We Produce
Investment in capital and technology creates economic
growth and increases income.
The model of specialization and trade explains the
different patterns of production across countries.
Figure 2.9 illustrates how economic growth influences the
pattern of production.
© 2019 Pearson Education
54.
Economic GrowthFigure 2.9(a) compares low-income Ethiopia and China.
Figure 2.9(b) compares China and the rich United States.
© 2019 Pearson Education
55.
Economic CoordinationTo reap the gains from trade, the choices of individuals
must be coordinated.
To make coordination work, four complimentary social
institutions have evolved over the centuries:
Firms
Markets
Property rights
Money
© 2019 Pearson Education
56.
Economic CoordinationA firm is an economic unit that hires factors of production
and organizes those factors to produce and sell goods
and services.
A market is any arrangement that enables buyers and
sellers to get information and do business with each other.
Property rights are the social arrangements that govern
ownership, use, and disposal of resources, goods, or
services.
Money is any commodity or token that is generally
acceptable as a means of payment.
© 2019 Pearson Education
57.
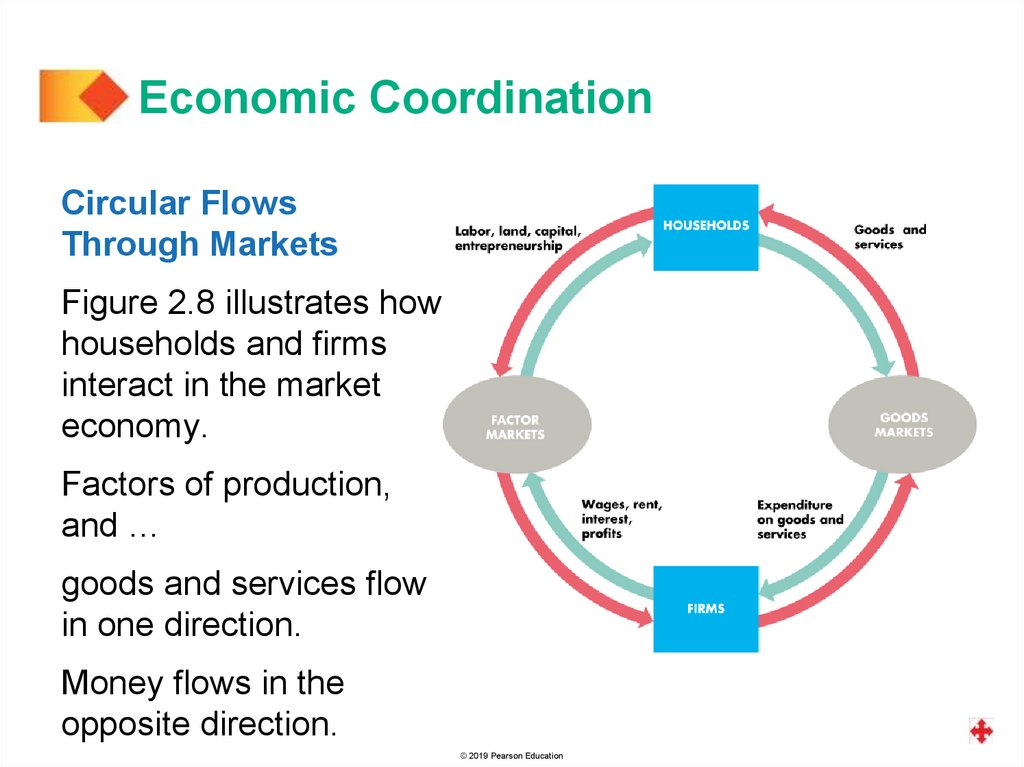
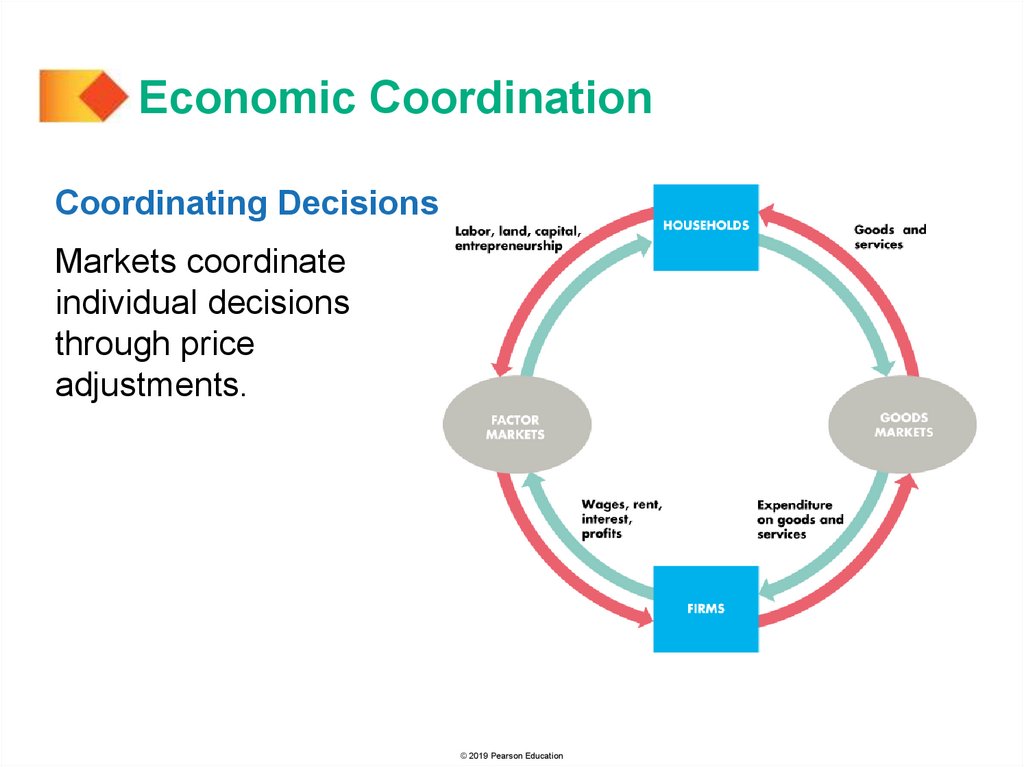
Economic CoordinationCircular Flows
Through Markets
Figure 2.8 illustrates how
households and firms
interact in the market
economy.
Factors of production,
and …
goods and services flow
in one direction.
Money flows in the
opposite direction.
© 2019 Pearson Education
58.
Economic CoordinationCoordinating Decisions
Markets coordinate
individual decisions
through price
adjustments.
© 2019 Pearson Education