


 finance
 business
Similar presentations:


")

Project comments. Project comments International finance and globalization
1. Project comments
Expected return and riskStock evaluation
Portfolio calculation
Project comments
International finance and globalization
Project
©Ella Khromova
2.
Expected return and riskStock evaluation
Portfolio calculation
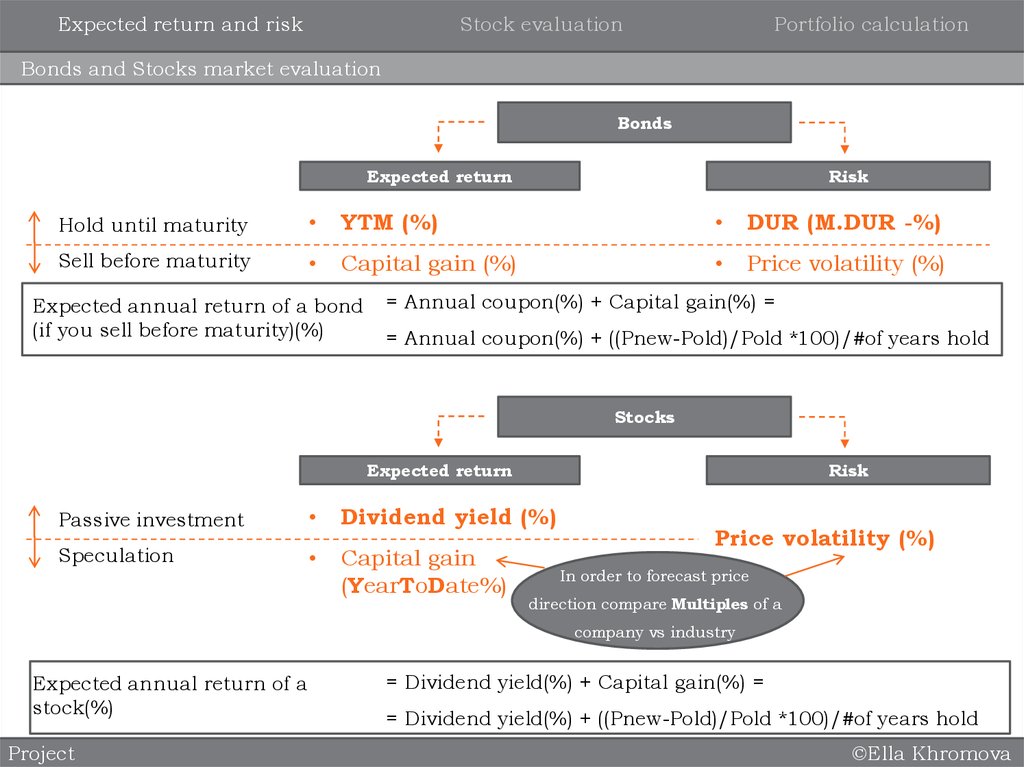
Bonds and Stocks market evaluation
Bonds
Expected return
Risk
Hold until maturity
YTM (%)
DUR (M.DUR -%)
Sell before maturity
Capital gain (%)
Price volatility (%)
Expected annual return of a bond
(if you sell before maturity)(%)
= Annual coupon(%) + Capital gain(%) =
= Annual coupon(%) + ((Pnew-Pold)/Pold *100)/#of years hold
Stocks
Expected return
Risk
Passive investment
Dividend yield (%)
Speculation
Capital gain
(YearToDate%)
Price volatility (%)
In order to forecast price
direction compare Multiples of a
company vs industry
Expected annual return of a
stock(%)
Project
= Dividend yield(%) + Capital gain(%) =
= Dividend yield(%) + ((Pnew-Pold)/Pold *100)/#of years hold
©Ella Khromova
3.
Target-settingBonds
Client Profile
Stocks
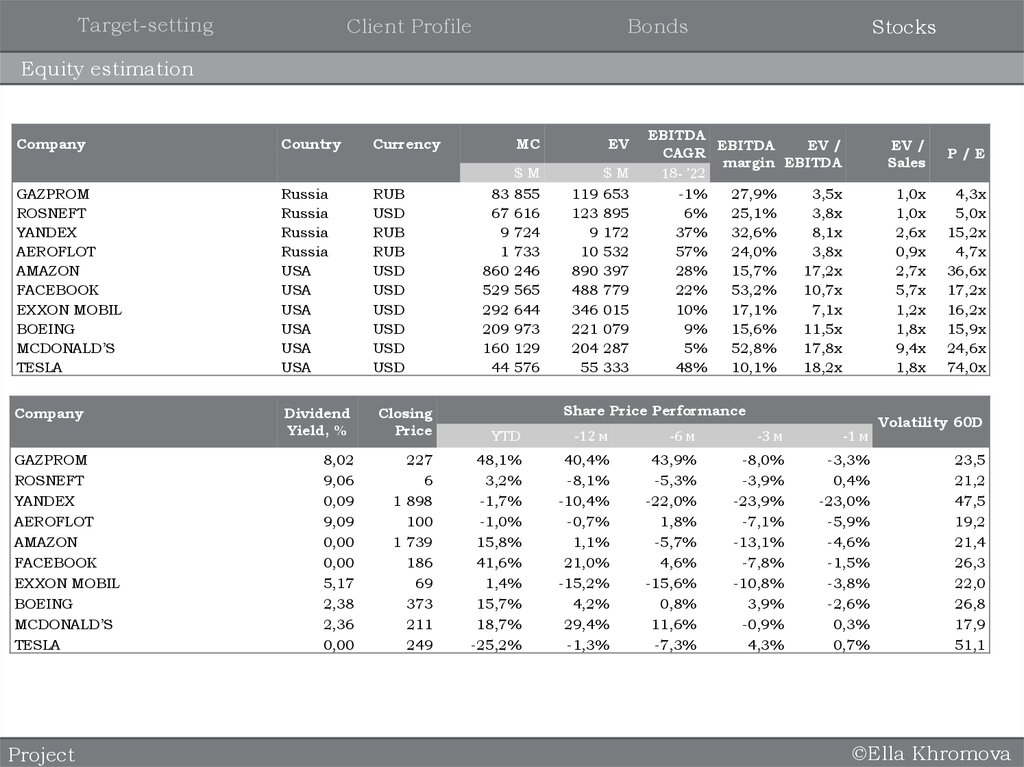
Equity estimation
Company
Country
Currency
MC
EV
RUB
USD
RUB
RUB
USD
USD
USD
USD
USD
USD
$M
855
616
724
733
246
565
644
973
129
576
$M
653
895
172
532
397
779
015
079
287
333
GAZPROM
ROSNEFT
YANDEX
AEROFLOT
AMAZON
EXXON MOBIL
BOEING
MCDONALD’S
TESLA
Russia
Russia
Russia
Russia
USA
USA
USA
USA
USA
USA
Company
Dividend
Yield, %
Closing
Price
YTD
-12 м
-6 м
-3 м
-1 м
8,02
9,06
0,09
9,09
0,00
0,00
5,17
2,38
2,36
0,00
227
6
1 898
100
1 739
186
69
373
211
249
48,1%
3,2%
-1,7%
-1,0%
15,8%
41,6%
1,4%
15,7%
18,7%
-25,2%
40,4%
-8,1%
-10,4%
-0,7%
1,1%
21,0%
-15,2%
4,2%
29,4%
-1,3%
43,9%
-5,3%
-22,0%
1,8%
-5,7%
4,6%
-15,6%
0,8%
11,6%
-7,3%
-8,0%
-3,9%
-23,9%
-7,1%
-13,1%
-7,8%
-10,8%
3,9%
-0,9%
4,3%
-3,3%
0,4%
-23,0%
-5,9%
-4,6%
-1,5%
-3,8%
-2,6%
0,3%
0,7%
GAZPROM
ROSNEFT
YANDEX
AEROFLOT
AMAZON
EXXON MOBIL
BOEING
MCDONALD’S
TESLA
Project
83
67
9
1
860
529
292
209
160
44
119
123
9
10
890
488
346
221
204
55
EBITDA
EBITDA
EV /
CAGR
margin EBITDA
18- '22
-1%
27,9%
3,5x
6%
25,1%
3,8x
37%
32,6%
8,1x
57%
24,0%
3,8x
28%
15,7%
17,2x
22%
53,2%
10,7x
10%
17,1%
7,1x
9%
15,6%
11,5x
5%
52,8%
17,8x
48%
10,1%
18,2x
Share Price Performance
EV /
Sales
P/E
1,0x
1,0x
2,6x
0,9x
2,7x
5,7x
1,2x
1,8x
9,4x
1,8x
4,3x
5,0x
15,2x
4,7x
36,6x
17,2x
16,2x
15,9x
24,6x
74,0x
Volatility 60D
23,5
21,2
47,5
19,2
21,4
26,3
22,0
26,8
17,9
51,1
©Ella Khromova
4.
Financial InstrumentsEquity
Relative Valuation: Most Commonly used Multiples
Multiples
Attributable to all stakeholders:
debtors and shareholders
(based on enterprise value)
EV/Sales
EV/EBITDA
Lecture 7
Attributable to shareholders
only
(based on equity value)
P/E=Price to Earnings=
(Equity Value aka Market
Capitalization / Net Income)
©Ella Khromova
5.
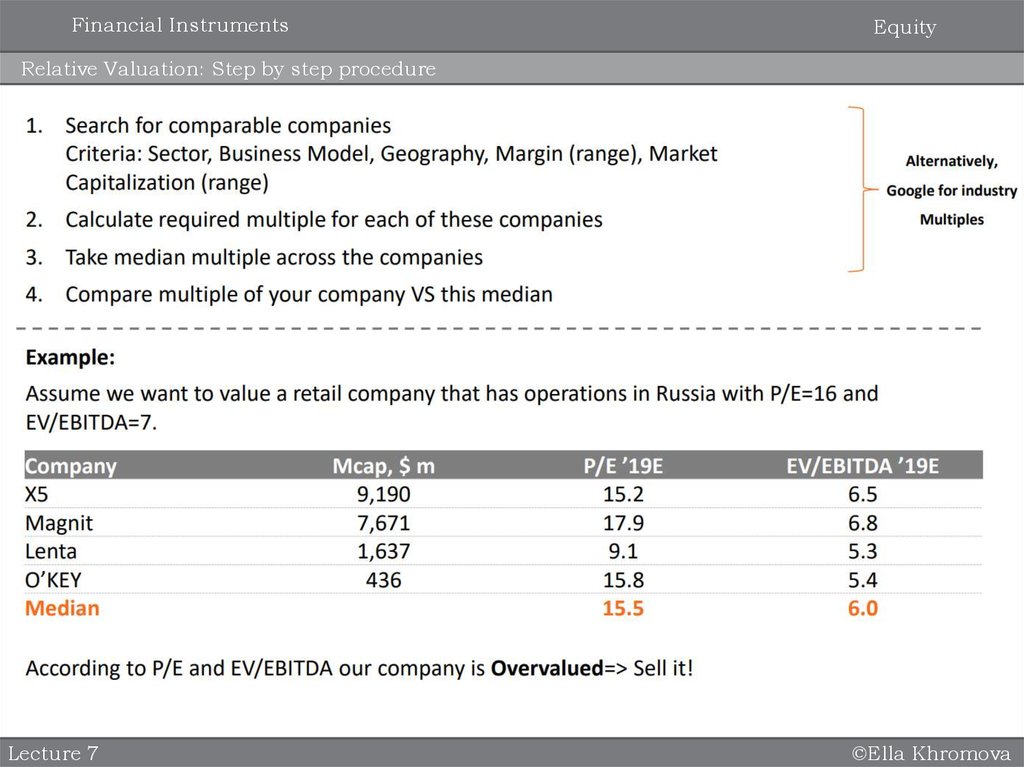
Financial InstrumentsEquity
Relative Valuation: Step by step procedure
Lecture 7
©Ella Khromova
6.
Expected return and riskStock evaluation
Portfolio calculation
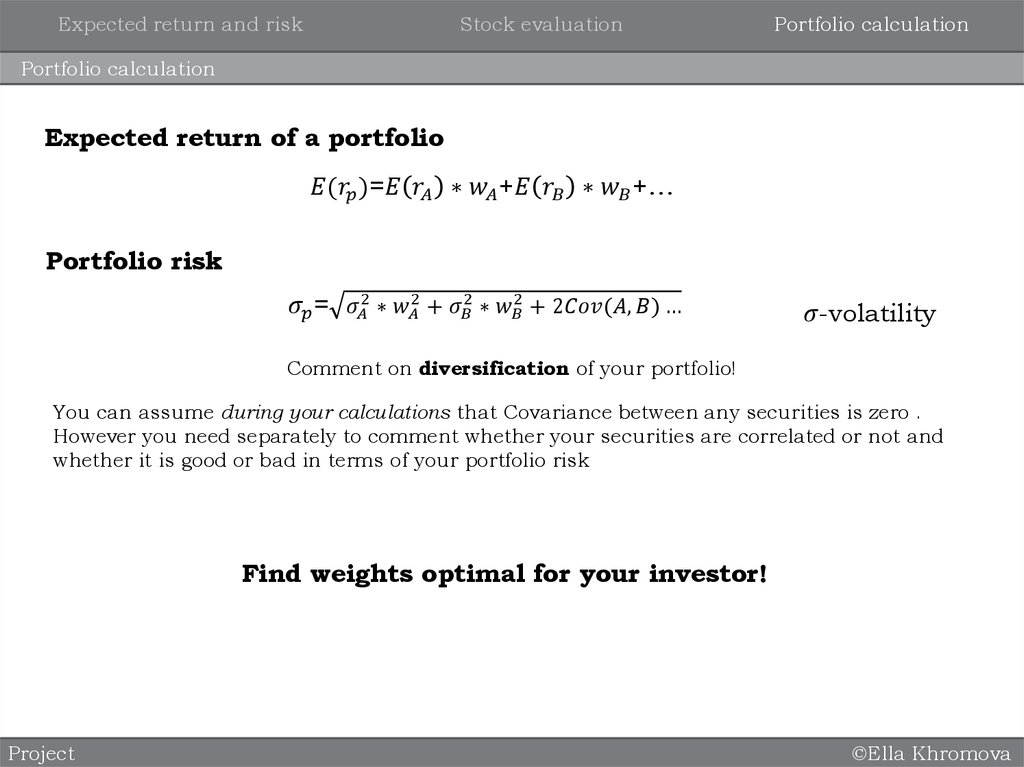
Portfolio calculation
Expected return of a portfolio