


 finance
Similar presentations:
")
")


Basics of fundamental analysis (part 2)
1.
TOPIC 1. BASICS OF FUNDAMENTALANALYSIS (part 2)
1.
Analysis of the company's investment attractiveness.
2.
Formation of investment strategy and types of investment portfolio.
3.
Principles of investment portfolio formation.
4.
Index funds.
2.
1. Analysis of the company's investment attractiveness.The choice of industry - is primary, allowing you to choose the most promising
business model.
Choosing a particular company, on the other hand - is finding the industry leader,
the "star" that can best implement that business model (comparative evaluation and
finding the best or best companies within the same industry).
When we buy a stock, we are buying a business model that, in turn, generates (or does
not generate) income.
In the stock market, fundamental analysts determine whether or not the stock market
has correctly evaluated the risk and future returns.
3.
Types of analysis of companies(types of fundamental analysis):
quantitative (related to the study of financial and accounting
statements);
qualitative (evaluation of management performance,
management experience, corporate governance, industry and
competition and business, among others, net earnings per share,
return on equity, etc.).
4.
Tips for investors from Buffett:invest in companies whose activities you understand;
analyze not only financial statements, but also the corporate structure and
biographies of managers;
invest in companies that will remain on the market for a long time (so he
invested in Coca-Cola, Gillette, American Express, McDonald's and even Walt
Disney, the Washington Post.
Buffett invested Washington Post in 11 million dollars, and received $ 1 billion.
Buffett used the products of these companies;
minimize risk;
not interfere in the operational management of the companies he bought.
5.
12 possible stages of company analysis:the volume of revenue, profit (income) and cash flow, sales volumes.
the amount of dividends paid by the company.
how the market evaluates securities ( "bull" or "bear trend". "Trend is your friend")
market share of the company.
the level of diversification of a company's activity.
stability of profit.
quality of management.
amount of debt / net profit
liquidity of assets = current assets / current liabilities
capital turnover = proceeds / assets
company size
business model
6.
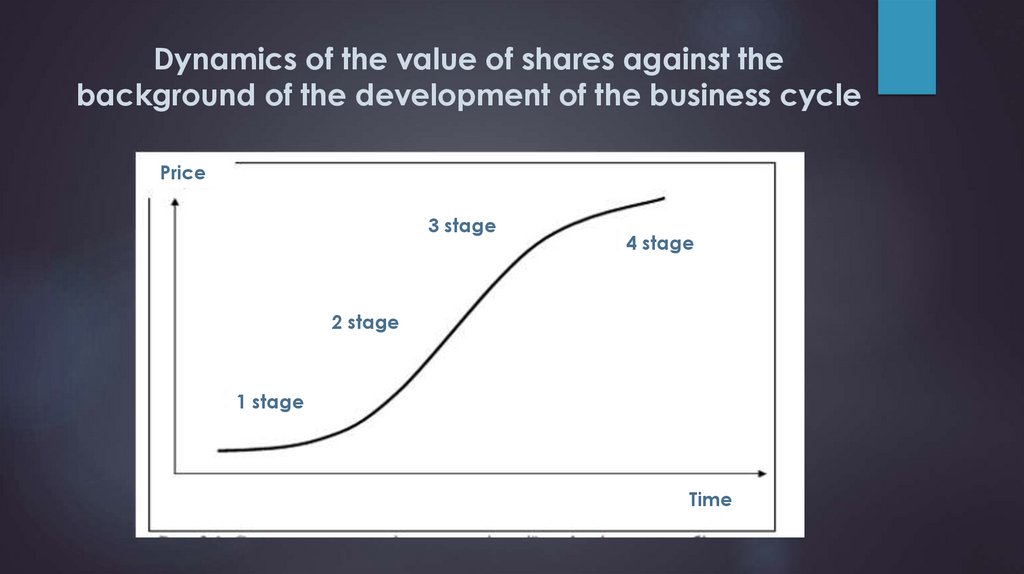
Dynamics of the value of shares against thebackground of the development of the business cycle
Price
3 stage
4 stage
2 stage
1 stage
Time
7.
Valuation of shares (multipliers)Why do we calculate multipliers?
Benchmarking takes place in three steps:
Searching for similar companies that have market value
Selecting and calculating the variables to be analyzed, the multipliers
Making adjustments to account for differences in assets.
P/E (Price/Earnings) (P/EPS) = market price of stock / net income per share =
market capitalization / net income
Net income = earnings after taxes, interest and dividends on preferred stock.
8.
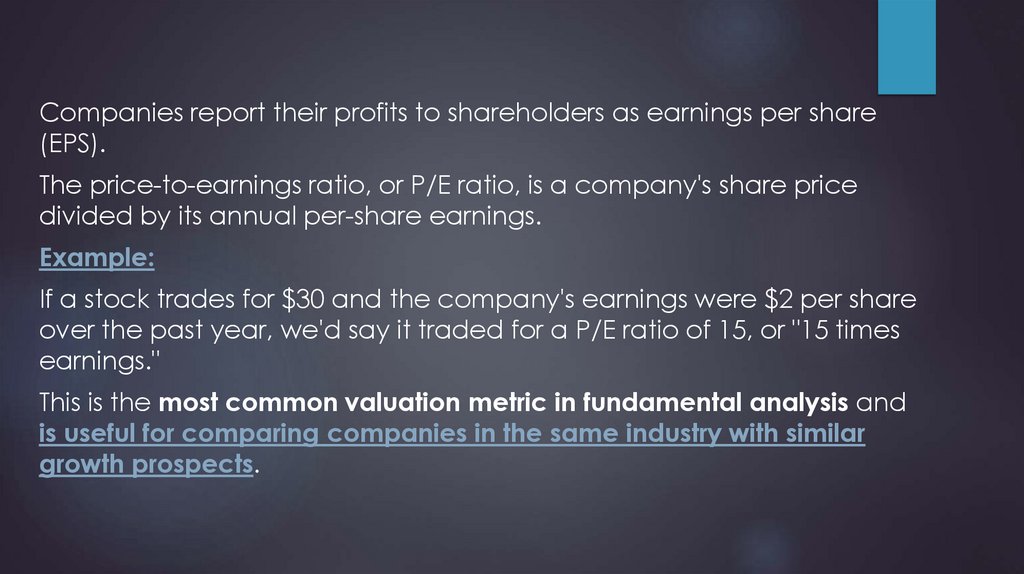
Companies report their profits to shareholders as earnings per share(EPS).
The price-to-earnings ratio, or P/E ratio, is a company's share price
divided by its annual per-share earnings.
Example:
If a stock trades for $30 and the company's earnings were $2 per share
over the past year, we'd say it traded for a P/E ratio of 15, or "15 times
earnings."
This is the most common valuation metric in fundamental analysis and
is useful for comparing companies in the same industry with similar
growth prospects.
9.
P/E shows:how many years does a joint-stock company need to
work in order to regain its market value,
how much to pay per dollar of the company's net profit.
P/E jumps:
the first - during the depression of 1890-1903;
the second - during the Great Depression of 1929-1933;
the third - in early 2000.
10.
The high value of P/E for the investor is not attractivebecause:
per unit of invested funds, he will receive a small return;
For example, if P / E = 10 → to obtain 1 gr. from profit per year you need to invest 10 gr.
Investments at constant profitability pay off in 10 years.
The P/E ratio changes over time for both the shares of an individual corporation and for
all shares of the market as a whole.
Shares with low P/E:
are mostly more profitable than shares of companies with a higher value of this
indicator;
indicator of market undervalued;
companies are usually quite large, have low growth rates, stable business and low risk.
11.
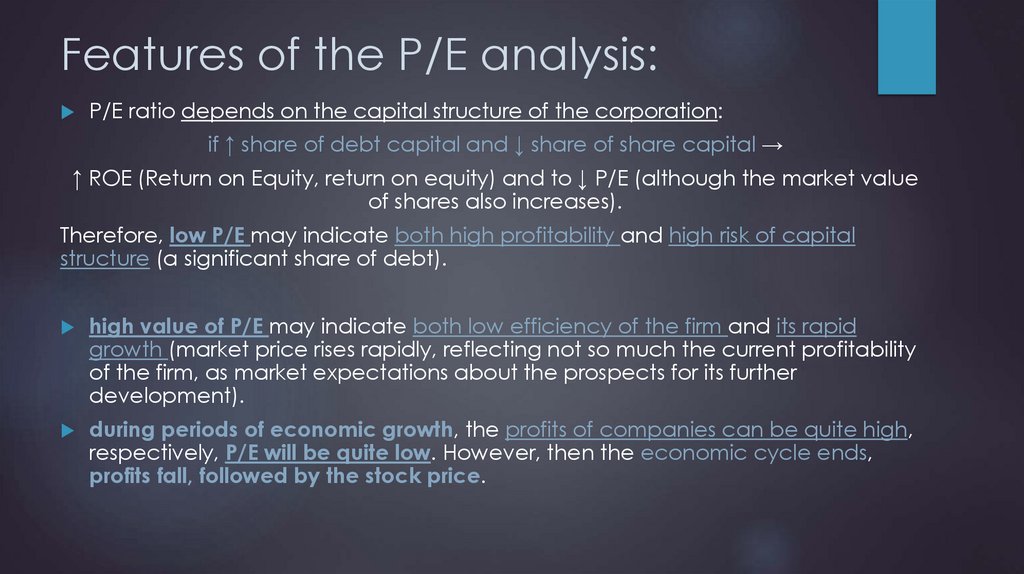
Features of the P/E analysis:P/E ratio depends on the capital structure of the corporation:
if ↑ share of debt capital and ↓ share of share capital →
↑ ROE (Return on Equity, return on equity) and to ↓ P/E (although the market value
of shares also increases).
Therefore, low P/E may indicate both high profitability and high risk of capital
structure (a significant share of debt).
high value of P/E may indicate both low efficiency of the firm and its rapid
growth (market price rises rapidly, reflecting not so much the current profitability
of the firm, as market expectations about the prospects for its further
development).
during periods of economic growth, the profits of companies can be quite high,
respectively, P/E will be quite low. However, then the economic cycle ends,
profits fall, followed by the stock price.
12.
It is necessary to analyze the coefficient in the dynamics of the last 5 years!It will be different for each industry!
Examples:
ASOS - in 2012: P/E = 68.7. However, over the next two years, the company
increased 4 times (ie, the ratio did not take into account the possibility of
growth). An example is that buying expensive stocks can also be profitable.
AVON Products had a very high P/E ratio = 64. Share price = $ 140. High level of
sales, the company had nowhere to grow, so 1974 - no growth in profits, falling
stock price to $ 18.5.
_________________________________________________________________________________
All other things being equal, companies with low P/E will be ahead of companies
with high performance in the long run.
However, in the "bull market" in the short term, the shares of companies with a
high P/E ratio have a chance to bypass the "value" shares with a low P/E.
13.
Types of P/E indicator:Forward P/E - "future P/E" (calculated not on the basis of
actual profit, but projected) (can be manipulated)
TTM P/E (Trailing Twelve Month) - P/E, calculated on the
basis of profit for the last 12 months.
14.
P/E alternatives:P/FCF (price/free cash flow) – according to P/E a company can look expensive.
But at the same time it generates a lot of FCF, which is greater than net profit. In
this case, the company may be valued fairly or undervalued based on its FCF.
FCF is the money that a company could freely spend on dividends.
PEG ratio = (P/E) / expected profit growth rate
For example, if P/E = 10 and profit growth rate = 5%, then PEG = 2.
The higher ↑ the profit growth rate is, the ↓ PEG is.
It is better to buy companies in which PEG <1.
The idea is that a fast-growing company can be "cheaper" than a slower-growing
one.
Adjustment: If the company pays dividends, than the dividend yield must be
added to the profit growth rate.
15.
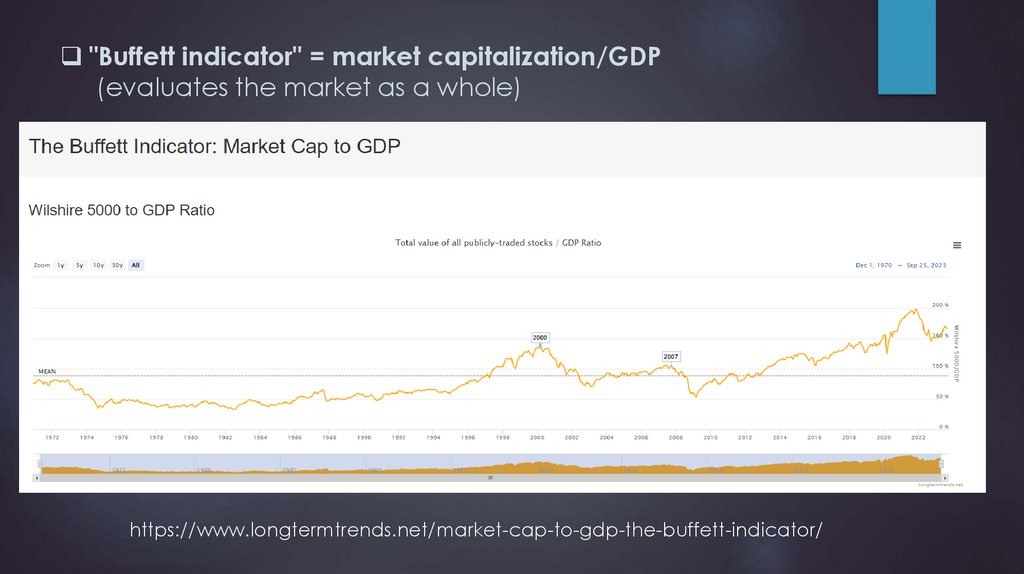
"Buffett indicator" = market capitalization/GDP(evaluates the market as a whole)
https://www.longtermtrends.net/market-cap-to-gdp-the-buffett-indicator/
16.
"Buffett indicator"https://www.gurufocus.com/stock-market-valuations.php
17.
https://www.currentmarketvaluation.com/models/buffett-indicator.php18.
Shiller P/E (CAPE) (evaluates the market as a whole) differs from P/E in that the net profit margin is taken as the average valuefor 10 years, adjusted for inflation.
During the dotcom crisis in 2000, CAPE (45) was significantly higher than
P/E (25).
https://www.gurufocus.com/shiller-PE.php
19.
P/B (Market Price/Book Ratio) == market share price / book share price.
If P/B is low the shares are undervalued.
Book share price = value of net assets / number of issued shares
outstanding.
Net assets = value of the company's assets - intangible assets, the
sum of all debts and the nominal value of preferred shares.
Or analog M/B (or MC/BV) = market capitalization/book value.
A company's book value is the net value of all of its assets.
Think of book value as the amount of money a company would theoretically
have if it shut down its business and sold everything it owned.
20.
P/S (Price/Sales) == share price (market capitalization) / sales volume.
It is a reliable analysis tool if used to identify signs of potential
financial recovery of a declining company.
If P/S is too high the shares are overvalued.
Often used for those companies in which there is no net profit.
EPS (E) (Earning per Share) - indicates the amount of profit
received in the reporting year per share.
Its positive dynamics is a strong argument for the investor.
21.
EV/EBITDA and EV/EBIT - shows the company's valuation interms of the value of the firm as a whole.
EV (Enterprise Value) = market. capitalization + company
debt - cash.
EBITDA - income before interest, taxes, depreciation and
amortization.
EBIT - income before interest and taxes.
D/P (Dividend Yield) = dividend per share / share price.
22.
Debt-to-EBITDA ratio:One good way to gauge financial health is by looking at a
company's debt.
There are several debt metrics, but the debt-to-EBITDA ratio is a
good one for beginners to learn.
You can find a company's total debts on its balance sheet, and
you'll find its EBITDA (earnings before interest, taxes, depreciation,
and amortization) on its income statement.
Then turn the two numbers into a ratio.
A high debt-to-EBITDA ratio could be a sign of a higher-risk
investment, especially during recessions and other tough times.
23.
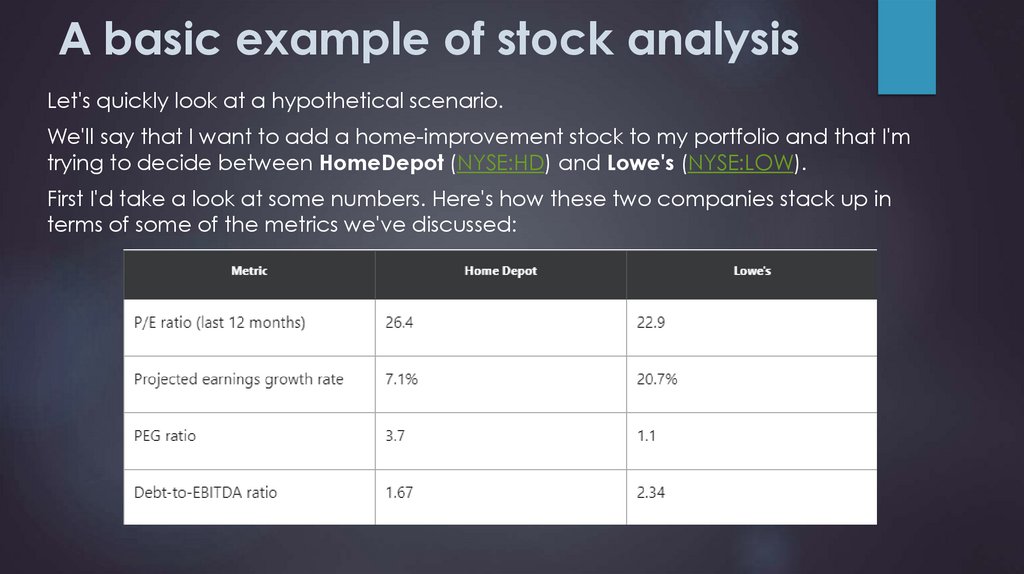
A basic example of stock analysisLet's quickly look at a hypothetical scenario.
We'll say that I want to add a home-improvement stock to my portfolio and that I'm
trying to decide between HomeDepot (NYSE:HD) and Lowe's (NYSE:LOW).
First I'd take a look at some numbers. Here's how these two companies stack up in
terms of some of the metrics we've discussed:
24.
Here's the key takeaway from these figures.-
Lowe's actually appears to be the cheaper buy on both a P/E and a PEG basis.
-
Lowe's has a higher debt-to-EBITDA multiple, so this could indicate Lowe's is the riskier of the two.
I wouldn't say that either company has a major competitive advantage over the other. Home Depot
arguably has the better brand name and distribution network, but not so much that it would sway my
investment decision, especially when Lowe's looks far more attractive. I'm a fan of both management
teams, and the home improvement industry is one that will always be busy.
If you think I'm picking a few metrics to focus on and basing my opinions on them, you're right. And that's
the point: There's no one perfect way to research stocks, which is why different investors choose different
stocks.
25.
Сomparative analysisTicker
F
N
Branch
Oil and gas
Oil and gas
Capital
3937.1419
3642.9599
P/E
2.57
6.98
P/S
0.48
4.11
P/BV
0.31
3.38
EV/S
1.23
4.41
EV/EBITDA
3.6
6.34
DEBT/EBITDA
2.5
0.57
EPS gr.
99%
204%
ROE
12%
49%
The company name
N earns more money on its own capital and has higher profit growth rates.
26.
A potentially undervalued company may have:low P/E combined with high expected earnings per
share growth;
low P/B combined with high return on capital (ROE)
ROE = Net Return/Equity
low P/S combined with high profitability sales.
27.
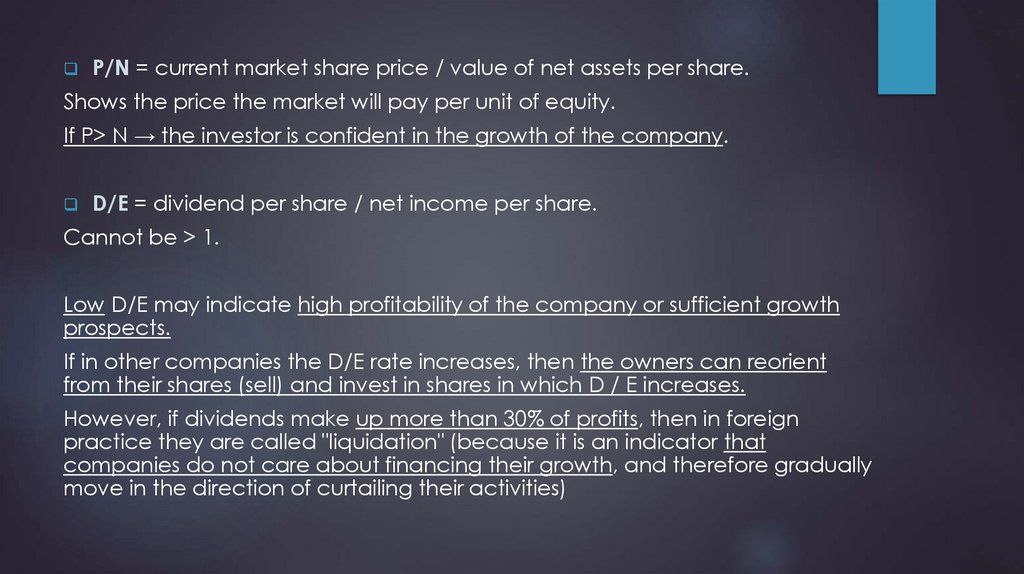
P/N = current market share price / value of net assets per share.Shows the price the market will pay per unit of equity.
If P> N → the investor is confident in the growth of the company.
D/E = dividend per share / net income per share.
Cannot be > 1.
Low D/E may indicate high profitability of the company or sufficient growth
prospects.
If in other companies the D/E rate increases, then the owners can reorient
from their shares (sell) and invest in shares in which D / E increases.
However, if dividends make up more than 30% of profits, then in foreign
practice they are called "liquidation" (because it is an indicator that
companies do not care about financing their growth, and therefore gradually
move in the direction of curtailing their activities)
28.
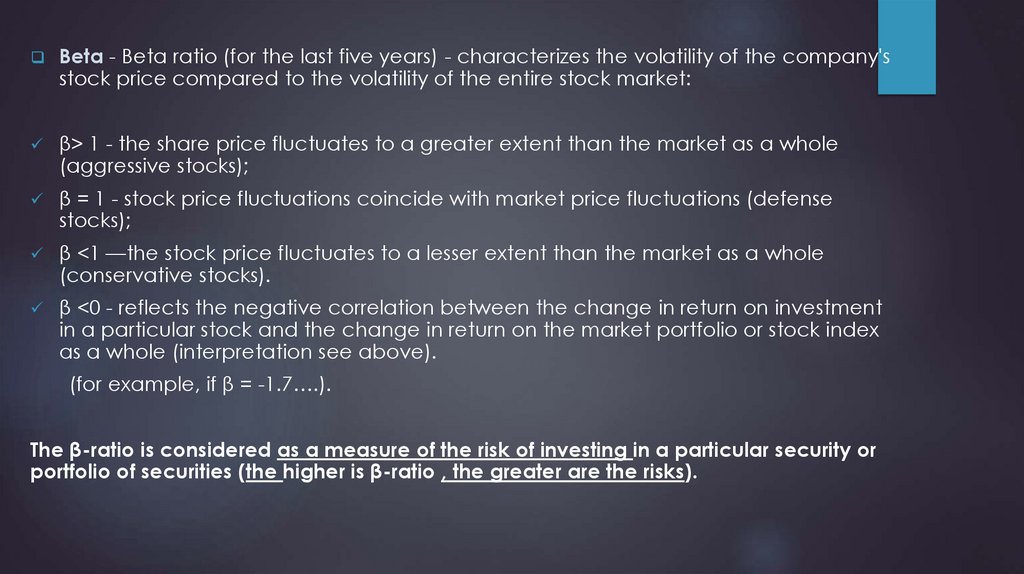
Beta - Beta ratio (for the last five years) - characterizes the volatility of the company'sstock price compared to the volatility of the entire stock market:
β> 1 - the share price fluctuates to a greater extent than the market as a whole
(aggressive stocks);
β = 1 - stock price fluctuations coincide with market price fluctuations (defense
stocks);
β <1 —the stock price fluctuates to a lesser extent than the market as a whole
(conservative stocks).
β <0 - reflects the negative correlation between the change in return on investment
in a particular stock and the change in return on the market portfolio or stock index
as a whole (interpretation see above).
(for example, if β = -1.7….).
The β-ratio is considered as a measure of the risk of investing in a particular security or
portfolio of securities (the higher is β-ratio , the greater are the risks).
29.
Summaryhttps://finance.yahoo.com/quote/TSLA?p=TSLA
30.
Statistics31.
Financials32.
Useful links:Buffett Indicator: Where Are We with Market Valuations?
https://www.gurufocus.com/stock-market-valuations.php
https://www.longtermtrends.net/market-cap-to-gdp-the-buffettindicator/
The Buffett Indicator
https://www.currentmarketvaluation.com/models/buffett-indicator.php
Shiller P/E
https://www.gurufocus.com/sector_shiller_pe.php
https://www.gurufocus.com/shiller-PE.php