
")


 Diagrams")


")


 management
Similar presentations:


CS189A/172 - Winter 2008
1. CS189A/172 - Winter 2008
Lectures 8 and 9: UML2. UML (Unified Modeling Language)
• Combines several visual specification techniques– use case diagrams, component diagrams, package diagrams,
deployment diagrams, class diagrams, sequence diagrams,
collaboration diagrams, state diagrams, activity diagrams
• Based on object oriented principles and concepts
– encapsulation, abstraction
– classes, objects
• Semi-formal
– Precise syntax but no formal semantics
– There are efforts in formalizing UML semantics
• There are tools which support UML
– Can be used for developing UML models and analyzing them
3. Examples for UML Tool Support
• IBM’s Rational Rose is a software development tool based on UML . Ithas code generation capability, configuration management etc.
• Microsoft Visio has support for UML shapes and can be used for basic
UML diagram drawing.
• ArgoUML (http://argouml.tigris.org/), open source tool for developing
UML models
• USE (http://www.db.informatik.uni-bremen.de/projects/USE/) an open
source tool which supports UML class diagrams and Object Constraint
Language
4. UML References
• There are lots of books on UML. The ones I used are:– “UML Distilled,” Martin Fowler
• The examples I use in this lecture are from this book
– “Using UML,” Perdita Stevens
– “UML Explained,” Kendall Scott
– “UML User Guide,” Grady Booch, James Rumbaugh, Ivar Jacobson
• The Object Management Group (OMG, a computer industry
consortium) defines the UML standard
– The current UML language specification is available at:
http://www.uml.org/
5. UML
• UML can be used in all phases of software development– specification of requirements, architectural design, detailed design
and implementation
• There are different types of UML diagrams for specifying different
aspects of software:
– Functionality, requirements
• Use-case diagrams
– Architecture, modularization, decomposition
• Class diagrams (class structure)
• Component diagrams, Package diagrams, Deployment
diagrams (architecture)
– Behavior
• State diagrams, Activity diagrams
– Communication, interaction
• Sequence diagrams, Collaboration diagrams
6. UML Class Diagrams
• Class diagram describes– Types of objects in the system
– Static relationships among them
• Two principal kinds of static relationships
– Associations between classes
– Subtype relationships between classes
• Class descriptions show
– Attributes
– Operations
• Class diagrams can also show constraints on associations
7. UML Class Diagrams
• Class diagrams can be used at different stages of development– For requirements specification, for design specification, and for
implementation
• In requirements specification class diagrams can be used to model real
world objects or concepts
• In design specification it can be used to specify interfaces and classes
that will be implemented in an object oriented program
• In implementation they can be used to show the structure of the
software by showing the relationships among different classes
8. Classes
• A class is represented as a three-part box• Class Name
• Attributes
– At conceptual level it is a piece of information associated with the
class that can be accessed and possibly modified
– Corresponds to a field at the implementation level
– Difference from association: navigability is from class to attribute
(not both ways as in association)
• Operations
– The processes the class can carry out (methods at implementation
level)
– Basic operations (such as getValue) on attributes can be omitted
(they can be inferred)
9. Classes
Class NameAttributes
Operations
Customer
name
address
For abstract classes, class name is
written in italic: Customer
+creditRating():String
Visibility:
public + (default) any outside class with visibility to the given class can use the feature
protected # any descendant of the class can use the feature
private – only the class itself can use the feature
10. Classes
Attribute syntax:visibility name[ multiplicity ] : type = initial-value { property-string }
can be:
changeable (is modifiable)
addOnly (for collections, items can
be added but cannot be removed)
frozen (no modification is allowed)
Example:
accountName [0..1] : String {changeable}
Operation syntax: visibility name ( parameter-list ) : return-type { property-string }
Parameters can be marked as:
in: input parameter (cannot be modified)
out: output parameter
inout: an input parameter that can be modified
Example:
can be:
isQuery (does not change state of the object)
sequential (should not be called concurrently)
guarded (like synchronized)
concurrent (can be executed concurrently)
+ getAccountName (number : Integer) : String {isQuery}
11. Associations
Associations are shown as lines between classesOrder
• An association shows a relationship between
dateReceived
isPrepaid
instances of two classes
number: String
– Each association has two roles (one for each
price: Money
direction)
dispatch()
– A role can be explicitly named with a label
close()
– Roles have multiplicity showing how many
1 Association
objects participate in the relationship
– Associations can have multiplicities
Role Name
Multiplicity:
• A fixed value (such as 1 or 3)
1 or more
• Many denoted by * (unlimited number, 0
Ordered
1..*
or more)
Product
• A range of values 0..1 or 3..*
Product Order
• A set of values 2,4,8
quantity: Int
price: Money
isSatisfied: Bool
12. Generalization
Generalization is used to showsubtyping between classes
– Subtype is a specialization of the
supertype
– Subtype can be substituted for the
supertype
– Subtype inherits the interface
– Subtype inherits the operations
Customer
name
address
creditRating():String
indicates
generalization
Corporate
Customer
contactName
creditRating
creditLimit
remind()
billForMonth(Int)
Personal
Customer
creditCardNumber
13. Constraints
• Constraints can be used to represent further restrictions onassociations or classes
• Constraints are stated inside braces {}
– Object Constraint Language (OCL) is a formal language for
specifying constraints
Order
dateReceived
isPrepaid
number: String
price: Money
dispatch()
close()
Customer
1..*
1
name
address
creditRating():String
A constraint
for the Order class
Going from one class to another by following
the association links is called navigation
{ if Order.customer.creditRating() = “poor”
then Order.isPrepaid = true }
14. Example Class Diagram
OrderdateReceived
isPrepaid
number: String
price: Money
Customer
1
1..*
creditRating():String
Constraint
for order class
dispatch()
close()
1
indicates
generalization
Corporate
Customer
{ if Order.customer.creditRating() = “poor”
then Order.isPrepaid = true }
Ordered
Product
name
address
1..*
creditCardNumber
remind()
billForMonth(Int) {creditRating()=“poor”}
Product Order
quantity: Int
price: Money
isSatisfied: Bool
contactName
creditRating
creditLimit
Personal
Customer
1..*
1
Product
1..*
Sales
Rep 0..1
Employee
indicates that credit
rating is always
set to poor for a
Personal Customer
15. Aggregation and Composition
Aggregation is a part-of relationshipComposition is also a part-of relationship, but part and whole
live and die together
Order
1
shows
aggregation
1
1
1
1
Shipping
Information
Billing
Information
1..*
Book
shows
composition
16. Association Classes
• Adds attributes and operations to an association– Allows exactly one instance of the association class between any
two objects
• Can use an actual class instead if you need more instances
Company
0..*
1..*
employer
employee
Job
description
dateHired
salary
Person
17. Sequence Diagrams
• A sequence diagram shows a particular sequence of messagesexchanged between a number of objects
• Sequence diagrams also show behavior by showing the ordering of
message exchange
• A sequence diagram shows some particular communication sequences
in some run of the system
– it is not characterizing all possible runs
18. Sequence Diagrams
• Sequence diagrams can be used in conjunction with use-cases– At the requirements phase they can be used to visually represent
the use cases
– At the design phase they can be used to show the system’s
behavior that corresponds to a use-case
• During the testing phase sequence diagrams from the requirements or
design phases can be used to generate test cases for the software
product
• Sequence diagrams are similar to MSCs (Message Sequence Charts)
which are a part of SDL and have formal semantics
19. Components of Sequence Diagrams
• Object (an instance of aclass)
– shown as a box at the
top of a vertical dashed
line
– instance syntax
instanceName:ClassName
• Lifeline
– dashed line, represents
time flow
:OrderEntryWindow
Object
Lifeline
instance name
can be omitted
(means anonymous
instance)
20. Components of Sequence Diagrams
• Messages– communication between
objects
– correspond to method calls at
the implementation level
:ProductOrder
:StockItem
Message
check()
needsToReorder()
• Special message types
– self-delegation
– return
• show returns only if it adds
to clarity
– <<create>>
– <<destroy>>
Self-delegation
Return
Denotes procedure call (control flow passes from caller to callee)
Denotes interaction among two threads of control (no transfer of control)
21. Components of Sequence Diagrams
• Two kinds of controlinformation:
– message conditions
• message is sent only
if the condition is true
– iteration marker: *
• message sent to
multiple receiver
objects
:Order
:ProductOrder
*prepare()
:StockItem
check()
Iteration
[check=“true”]
message
condition
remove()
22. Example Sequence Diagram
:OrderEntryWindow:Order
:ProductOrder
:StockItem
prepare()
*prepare()
check()
[check=“true”]
remove()
needsToReorder()
[needsToReorder=“true”]
<<create>>
:ReorderItem
[check=“true”]
<<create>>
:DeliveryItem
23. Sequence diagrams
• Show conditional behavior on separate diagrams to keep themunderstandable
– for example for a use case you can give the basic path as one
sequence diagram and have separate sequence diagrams for
alternative paths or exceptions
• Use sequence diagrams to show the behavior of several objects within
a use case
– use a state diagram when you want to show the behavior of an
object across many use cases
24. Sequence Diagrams
• Focus of control (or activation)can be shown in sequence
diagrams as a thin rectangle put
on top of the lifeline of an object
• Shows the period of time during
which the given object is in
control of the flow
– From an implementation point
of view, you can think of it as
showing how long an
activation record stays in the
control stack
• It is optional to use focus of
control rectangles in a sequence
diagram
– use it when it adds to clarity
:Order
:ProductOrder
*prepare()
:StockItem
check()
Iteration
[check=“true”]
message
condition
focus of control
or activation
lifeline
remove()
25. Collaboration (Communication) Diagrams
• Collaboration diagrams (aka Communication diagrams) show aparticular sequence of messages exchanged between a number of
objects
– this is what sequence diagrams do too!
• Use sequence diagrams to model flows of control by time ordering
– sequence diagrams can be better for demonstrating the ordering of
the messages
– sequence diagrams are not suitable for complex iteration and
branching
• Use collaboration diagrams to model flows of control by organization
– collaboration diagrams are good at showing the static connections
among the objects while demonstrating a particular sequence of
messages at the same time
26. Example Sequence Diagram
:OrderEntryWindow:Order
:ProductOrder
:StockItem
prepare()
*prepare()
check()
[check=“true”]
remove()
needsToReorder()
[needsToReorder=“true”]
<<create>>
:ReorderItem
[check=“true”]
<<create>>
:DeliveryItem
27. Corresponding Collaboration Diagram
object:OrderEntryWindow
1:prepare()
link
message
Sequence numbers are used
to show the time ordering among
the messages
sequence number
:Order
1.1:*prepare()
:ProductOrder
:StockItem
1.1.1:check()
1.1.2:[check==true]remove()
1.1.3:[check==true]new
:ReorderItem
1.1.2.1:needsToReorder()
1.1.2.2:new
:DeliveryItem
28. State Diagrams (Statecharts a la UML)
• State diagrams are used to show possible states a single object canget into
– shows states of an object
• How object changes state in response to events
– shows transitions between states
• UML state diagrams are a variation of Statecharts
– “A Visual Formalism for Complex Systems,” David Harel, Science
of Computer Programming, 1987
– Statecharts are basically hierarchical state machines
– Statecharts have formal semantics
29. State Diagrams
• State diagrams are used to show possible states a single object canget into
– shows states of an object
• How object changes state in response to events
– shows transitions between states
• Uses the same basic ideas from statecharts and adds some extra
concepts such as internal transitions, deferred events etc.
30. State Diagrams
• Hierarchical grouping of states– composite states are formed by grouping other states
– A composite state has a set of sub-states
• Concurrent composite states can be used to express concurrency
– When the system is in a concurrent composite state, it is in all of its
substates at the same time
– When the system is in a normal (non-concurrrent) composite state,
it is in only one of its substates
– If a state has no substates it is an atomic state
• Synchronization and communication between different parts of the
system is achieved using events
31. State Diagrams: Transitions
• Transitions consist of– source state and target states: shown by the arrow representing
the transition
– trigger event: the event that makes the transition fire, for example
it could be receipt of a message
– guard condition: a boolean expression that is evaluated when the
trigger event occurs, the transition can fire only if the guard
condition evaluates to true
– action: an executable atomic computation that can directly act on
the object that owns the state machine or indirectly on other objects
that are visible to the object such as sending a message
source state
target state
trigger-event[guard-condition]/action
32. State Diagrams: States
• States are represented as rounded boxes which contain:– the state name
– and the following optional fields
• entry and exit actions: entry and exit actions are
executed whenever the state is entered or exited,
respectively
• internal transitions: internal transitions do not activate
the entry and exit actions (different than self-transitions
which activate the entry and exit actions).
• activities: Typically, once the system enters a state it
sits idle until an event triggers a transition. Activities help
you to model situations where while in a state, the object
does some work that will continue until it is interrupted
by an event
• deferred events: If an event does not trigger a transition
in a state, it is lost. In situations where you want to save
an event until it triggers a transition, use deferred events
33. State Diagrams: States
Trackingentry action
exit action
internal transition
activity
entry / setMode(on Track)
exit / setMode(off Track)
newTarget / tracker.Acquire()
do / followTarget
selfTest / defer
deferred event
Note that, “entry”, “exit”, “do”, and “defer” are keywords
34. State Diagrams
shows the initial (default) state/ getFirstItem
getNextItem
[not all items checked]
Checking
do / checkItem
cancelled
shows the final state
initial and final states: shown as filled black circle
and a filled black circle surrounded by an unfilled circle, respectively
35. State Diagram Example: States of an Order object
/ getFirstItemgetNextItem
[not all items checked]
Checking
[all items checked and
all items available]
do/checkItem
Dispatching
do/initiate
Delivery
itemReceived
[all items available]
[all items checked and
some items not in stock]
cancelled
itemsReceived
[some items not in stock]
cancelled
Waiting
Delivered
cancelled
Cancelled
36. State Diagrams: Superstates
/ getFirstItemgetNextItem
[not all items checked]
Checking
Active is a superstate
with substates Checking,
Waiting and Dispatching
Active
[all items checked and
all items available]
do/checkItem
Dispatching
do/initiate
Delivery
itemReceived
[all items available]
[all items checked and
some items not in stock]
itemsReceived
[some items not in stock]
Waiting
cancelled
Cancelled
Delivered
37. State Diagrams: Concurrent states
• Payment authorization is done concurrently with the order processingAuthorizing
do/check
Payment
[payment OK]
Authorized
Delivered
[payment not OK]
Rejected
38. State Diagrams: Concurrent States
cancelledWaiting
Cancelled
Checking
Dispatching
Delivered
Authorizing
[payment not OK]
Authorized
Rejected
this transition
can only be taken
after both concurrent
states reach their
final states
39. State Diagrams
• Good at describing behavior of an object across several use-cases• Use them to show the behavior of a single object not many objects
– for many objects use interaction diagrams
• Do not try to draw state diagrams for every class in the system, use
them to show interesting behavior and increase understanding
40. Activity Diagrams
• Activity diagrams show the flow among activities and actionsassociated with a given object using:
– activity and actions
– transitions
– branches
– merges
– forks
– joins
• Activity diagrams are similar to SDL state diagrams, SDL state
diagrams have formal semantics
• Activity diagrams are basically an advanced version of flowcharts
41. Activity Diagrams
• Activity– represents a task that has to be performed, a non-atomic execution
within a state machine
– from an implementation perspective it can represent a method
• Action
– an atomic computation that changes the state of the system or
returns a value
42. Activity Diagrams
• When an activity or action iscompleted the control passes
immediately to the next action
or activity
• Transitions can have guard
conditions
• Multiple trigger symbol * is
used to show iteration
initial state
Receive Supply
action or
activity
transition
Choose Outstanding
Order Item
* for each chosen
order item
Assign Goods
in Order
43. Activity Diagrams: Branches
• Conditional branches– correspond to if-then-else or
switch statements at the
implementation level
• a branch is shown as a diamond
• a branch can have one incoming
transition and two or more
outgoing
• the guard conditions on different
outgoing transitions should not
overlap to prevent nondeterminism
• guard conditions on different
outgoing transitions should cover
all the possibilities so that the
control flow does not get stuck at
the branch
guard
expressions
Authorize
Payment
branch
[succeeded]
[failed]
Dispatch Order
Cancel Order
44. Activity Diagrams: Forks and Joins
• Forks and joins are used to modelconcurrent execution paths
• They can be used to express
parallelism and synchronization
– forks create concurrent threads
– joins merge different threads
Receive Order
fork
Authorize
Payment
Check Order
Items
two threads are executing
concurrently
Dispatch
Order
join
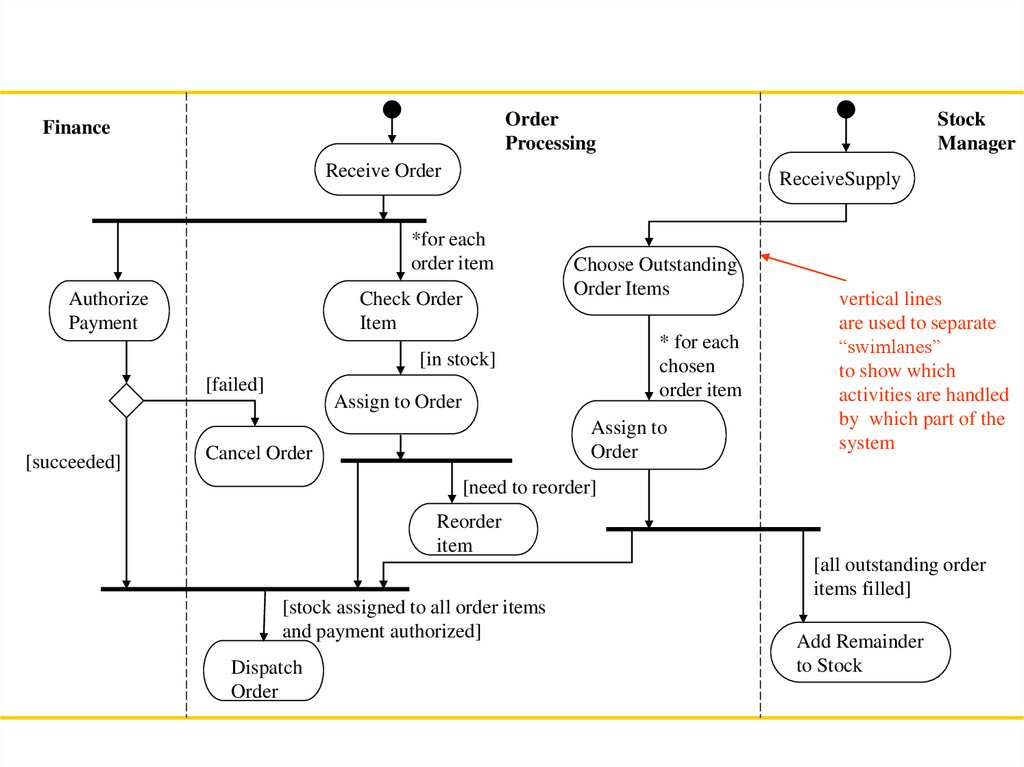
45.
OrderProcessing
Finance
Stock
Manager
Receive Order
ReceiveSupply
*for each
order item
Authorize
Payment
Check Order
Item
Choose Outstanding
Order Items
* for each
chosen
order item
[in stock]
[failed]
[succeeded]
Assign to Order
Assign to
Order
Cancel Order
vertical lines
are used to separate
“swimlanes”
to show which
activities are handled
by which part of the
system
[need to reorder]
Reorder
item
[all outstanding order
items filled]
[stock assigned to all order items
and payment authorized]
Dispatch
Order
Add Remainder
to Stock
46. UML Diagrams
• Functionality, requirements– use case diagrams
• Architecture, modularization, decomposition
– class diagrams (class structure)
– component diagrams, package diagrams, deployment
diagrams (architecture)
• Behavior
– state diagrams, activity diagrams
• Communication, interaction
– sequence diagrams, collaboration diagrams
47. How do they all fit together?
• Requirements analysis and specification– use-cases, use-case diagrams, sequence diagrams
• Design and Implementation
– Class diagrams can be used for showing the decomposition of the
design
– Activity diagrams can be used to specify behaviors described in use
cases
– State diagrams are used to specify behavior of individual objects
– Sequence and collaboration diagrams are used to show interaction
among different objects
– Component diagrams, package diagrams and deployment
diagrams can be used to show the high level architecture
– Use cases and sequence diagrams can be used to derive test
cases