


")
")


")
")


")
")
")


")


 management
Similar presentations:


")
")
Facility Layout
1. Facilities
Chapter 7Facilities
Operations Management - 5th Edition
Roberta Russell & Bernard W. Taylor, III
Copyright 2006 John Wiley & Sons, Inc.
Beni Asllani
University of Tennessee at Chattanooga
2. Lecture Outline
Basic LayoutsDesigning Process Layouts
Designing Service Layouts
Designing Product Layouts
Hybrid Layouts
Copyright 2006 John Wiley & Sons, Inc.
7-2
3. Facility Layout
Arrangement of areas within a facility to:Minimize material-handling
costs
Utilize space efficiently
Utilize labor efficiently
Eliminate bottlenecks
Facilitate communication and
interaction
Reduce manufacturing cycle
time
Reduce customer service time
Eliminate wasted or redundant
movement
Increase capacity
Copyright 2006 John Wiley & Sons, Inc.
Facilitate entry, exit, and
placement of material, products,
and people
Incorporate safety and security
measures
Promote product and service
quality
Encourage proper maintenance
activities
Provide a visual control of
activities
Provide flexibility to adapt to
changing conditions
7-3
4. BASIC LAYOUTS
Process layoutsgroup similar activities together
according to process or function they
perform
Product layouts
arrange activities in line according to
sequence of operations for a particular
product or service
Fixed-position layouts
are used for projects in which product
cannot be moved
Copyright 2006 John Wiley & Sons, Inc.
7-4
5. Process Layout in Services
Women’slingerie
Shoes
Housewares
Women’s
dresses
Cosmetics
and jewelry
Children’s
department
Women’s
sportswear
Entry and
display area
Men’s
department
Copyright 2006 John Wiley & Sons, Inc.
7-5
6. Manufacturing Process Layout
Lathe DepartmentL
L
L
L
L
L
L
L
L
L
Milling
Department
Drilling Department
M
M
D
D
D
D
M
M
D
D
D
D
G
G
G
P
G
G
G
P
Grinding
Department
Receiving and
Shipping
Copyright 2006 John Wiley & Sons, Inc.
Painting Department
A
A
A
Assembly
7-6
7. A Product Layout
InOut
Copyright 2006 John Wiley & Sons, Inc.
7-7
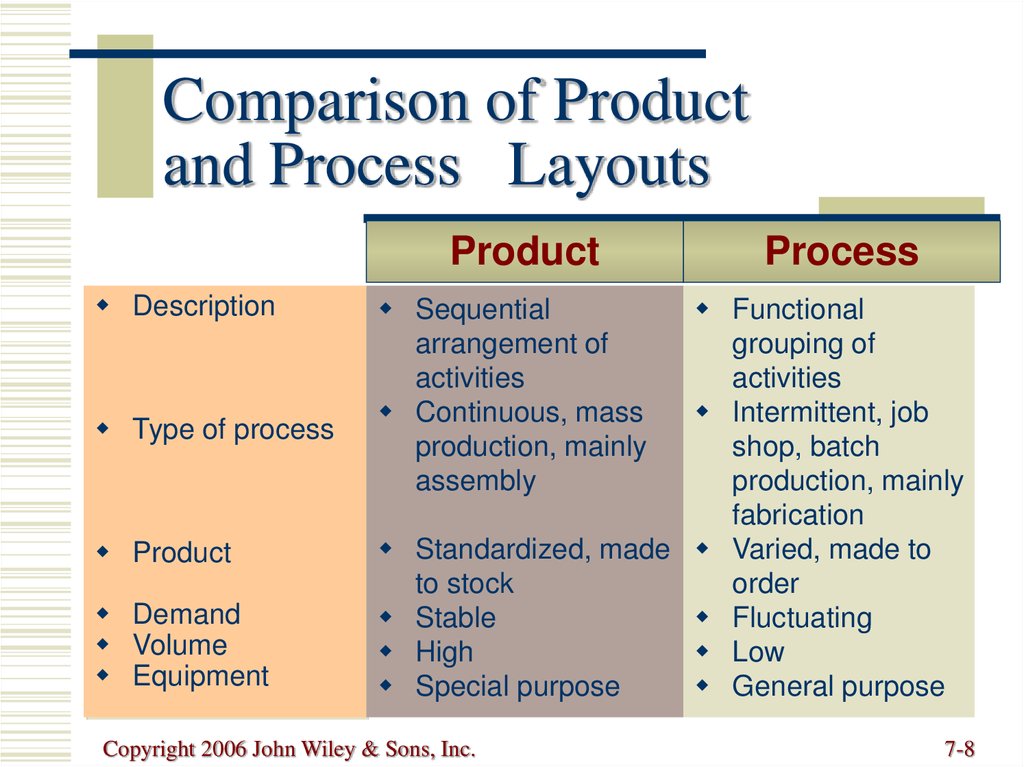
8.
Comparison of Productand Process Layouts
Product
Description
Type of process
Process
Sequential
arrangement of
activities
Continuous, mass
production, mainly
assembly
Product
Demand
Volume
Equipment
Functional
grouping of
activities
Intermittent, job
shop, batch
production, mainly
fabrication
Standardized, made Varied, made to
to stock
order
Stable
Fluctuating
High
Low
Special purpose
General purpose
Copyright 2006 John Wiley & Sons, Inc.
7-8
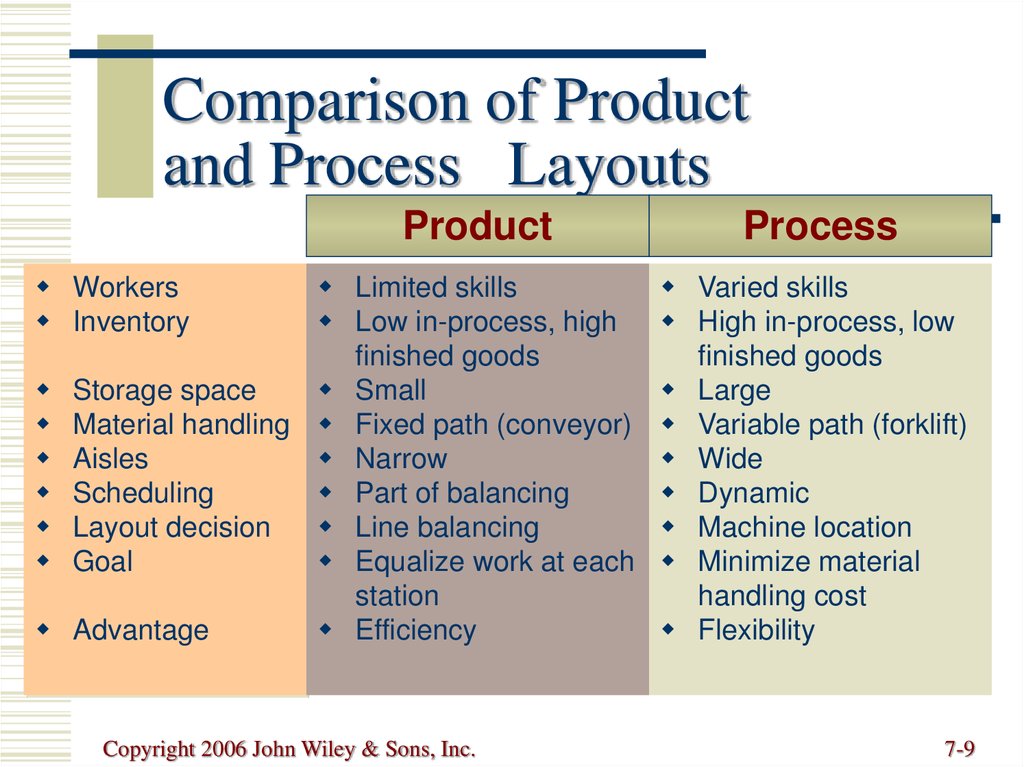
9.
Comparison of Productand Process Layouts
Product
Workers
Inventory
Limited skills
Low in-process, high
finished goods
Storage space
Small
Material handling Fixed path (conveyor)
Aisles
Narrow
Scheduling
Part of balancing
Layout decision
Line balancing
Goal
Equalize work at each
station
Advantage
Efficiency
Copyright 2006 John Wiley & Sons, Inc.
Process
Varied skills
High in-process, low
finished goods
Large
Variable path (forklift)
Wide
Dynamic
Machine location
Minimize material
handling cost
Flexibility
7-9
10. Fixed-Position Layouts
Typical of projectsEquipment, workers,
materials, other
resources brought to the
site
Highly skilled labor
Often low fixed
Typically high variable
costs
Copyright 2006 John Wiley & Sons, Inc.
7-10
11. Designing Process Layouts
Goal: minimize material handling costsBlock Diagramming
minimize nonadjacent loads
use when quantitative data is available
Relationship Diagramming
based on location preference between areas
use when quantitative data is not available
Copyright 2006 John Wiley & Sons, Inc.
7-11
12. Block Diagramming
STEPScreate load summary chart
quantity in which
material is normally
calculate composite (two
moved
way) movements
develop trial layouts
Nonadjacent load
minimizing number of
distance farther
nonadjacent loads
than the next block
Unit load
Copyright 2006 John Wiley & Sons, Inc.
7-12
13. Block Diagramming: Example
Load Summary Chart1
4
2
3
FROM/TO
DEPARTMENT
Department 1
2
3
100
—
50
200
—
5
Copyright 2006 John Wiley & Sons, Inc.
1
2
3
4
5
—
60
100
50
4
50
40
—
5
50
60
—
7-13
14. Block Diagramming: Example (cont.)
22
1
1
4
3
2
3
1
1
3
4
3
2
5
5
5
4
4
5
200 loads
150 loads
110 loads
100 loads
60 loads
50 loads
50 loads
40 loads
0 loads
0 loads
Copyright 2006 John Wiley & Sons, Inc.
Nonadjacent Loads:
110+40=150
0
110
1
4
Grid 1
2
100
2
150
200
3
4
150 200
50 5050 40 60
110
50
60
3
5
5
40
7-14
15. Block Diagramming: Example (cont.)
(a) Initial block diagram1
(b) Final block diagram
2
4
3
5
Copyright 2006 John Wiley & Sons, Inc.
1
4
2
3
5
7-15
16. Relationship Diagramming
Schematic diagram thatuses weighted lines to
denote location preference
Muther’s grid
format for displaying
manager preferences for
department locations
Copyright 2006 John Wiley & Sons, Inc.
7-16
17. Relationship Diagramming: Example
necessaryRelationship AE Absolutely
Especially important
I Important
Diagramming: Example
O Okay
U Unimportant
X Undesirable
Production
O
A
Offices
U
E
O
Stockroom
Shipping and
receiving
I
A
A
X
U
U
U
O
O
Locker room
O
Toolroom
Copyright 2006 John Wiley & Sons, Inc.
7-17
18. Relationship Diagrams: Example (cont.)
(a) Relationship diagram of original layoutOffices
Stockroom
Locker
room
Toolroom
Copyright 2006 John Wiley & Sons, Inc.
Shipping
and
receiving
Key: A
E
I
Production
O
U
X
7-18
19. Relationship Diagrams: Example (cont.)
(b) Relationship diagram of revised layoutStockroom
Shipping
and
receiving
Offices
Toolroom
Production
Copyright 2006 John Wiley & Sons, Inc.
Locker
room
Key: A
E
I
O
U
X
7-19
20. Computerized layout Solutions
CRAFTComputerized Relative Allocation of Facilities
Technique
CORELAP
Computerized Relationship Layout Planning
PROMODEL and EXTEND
visual feedback
allow user to quickly test a variety of scenarios
Three-D modeling and CAD
integrated layout analysis
available in VisFactory and similar software
Copyright 2006 John Wiley & Sons, Inc.
7-20
21. Designing Service Layouts
Must be both attractive and functionalTypes
Free flow layouts
Grid layouts
encourage browsing, increase impulse purchasing, are flexible
and visually appealing
encourage customer familiarity, are low cost, easy to clean and
secure, and good for repeat customers
Loop and Spine layouts
both increase customer sightlines and exposure to products,
while encouraging customer to circulate through the entire
store
Copyright 2006 John Wiley & Sons, Inc.
7-21
22. Types of Store Layouts
Copyright 2006 John Wiley & Sons, Inc.7-22
23. Designing Product Layouts
ObjectiveBalance the assembly line
Line balancing
tries to equalize the amount of work at each
workstation
Precedence requirements
physical restrictions on the order in which operations
are performed
Cycle time
maximum amount of time a product is allowed to
spend at each workstation
Copyright 2006 John Wiley & Sons, Inc.
7-23
24. Cycle Time Example
Cd =Cd =
production time available
desired units of output
(8 hours x 60 minutes / hour)
(120 units)
Cd =
480
120
Copyright 2006 John Wiley & Sons, Inc.
= 4 minutes
7-24
25. Flow Time vs Cycle Time
Cycle time = max time spent at any stationFlow time = time to complete all stations
1
2
3
4 minutes
4 minutes
4 minutes
Flow time = 4 + 4 + 4 = 12 minutes
Cycle time = max (4, 4, 4) = 4 minutes
Copyright 2006 John Wiley & Sons, Inc.
7-25
26. Efficiency of Line
EfficiencyMinimum number
of workstations
i
t
i
t
i
i=1
E = nC
a
N=
i
i=1
Cd
where
ti
j
n
Ca
Cd
= completion time for element i
= number of work elements
= actual number of workstations
= actual cycle time
= desired cycle time
Copyright 2006 John Wiley & Sons, Inc.
7-26
27. Line Balancing Procedure
1. Draw and label a precedence diagram2. Calculate desired cycle time required for the line
3. Calculate theoretical minimum number of
workstations
4. Group elements into workstations, recognizing cycle
time and precedence constraints
5. Calculate efficiency of the line
6. Determine if the theoretical minimum number of
workstations or an acceptable efficiency level has
been reached. If not, go back to step 4.
Copyright 2006 John Wiley & Sons, Inc.
7-27
28. Line Balancing: Example
WORK ELEMENTA
B
C
D
PRECEDENCE
TIME (MIN)
—
A
A
B, C
0.1
0.2
0.4
0.3
Press out sheet of fruit
Cut into strips
Outline fun shapes
Roll up and package
0.2
B
0.1 A
D 0.3
C
Copyright 2006 John Wiley & Sons, Inc.
0.4
7-28
29. Line Balancing: Example (cont.)
WORK ELEMENTA
B
C
D
Press out sheet of fruit
Cut into strips
Outline fun shapes
Roll up and package
PRECEDENCE
TIME (MIN)
—
A
A
B, C
0.1
0.2
0.4
0.3
40 hours x 60 minutes / hour
2400
Cd =
=
= 0.4 minute
6,000 units
6000
0.1 + 0.2 + 0.3 + 0.4
1.0
N=
=
= 2.5 3 workstations
0.4
0.4
Copyright 2006 John Wiley & Sons, Inc.
7-29
30. Line Balancing: Example (cont.)
WORKSTATION1
2
3
ELEMENT
REMAINING
TIME
REMAINING
ELEMENTS
0.3
0.1
0.0
0.1
B, C
C, D
D
none
A
B
C
D
0.2
Cd = 0.4
N = 2.5
B
0.1 A
D 0.3
C
Copyright 2006 John Wiley & Sons, Inc.
0.4
7-30
31. Line Balancing: Example (cont.)
Workstation 1
Work
station 2
Work
station 3
A, B
C
D
0.3
minute
0.4
minute
0.3
minute
Cd = 0.4
N = 2.5
1.0
0.1 + 0.2 + 0.3 + 0.4
E=
=
= 0.833 = 83.3%
1.2
3(0.4)
Copyright 2006 John Wiley & Sons, Inc.
7-31
32. Computerized Line Balancing
Use heuristics to assign tasks toworkstations
Longest operation time
Shortest operation time
Most number of following tasks
Least number of following tasks
Ranked positional weight
Copyright 2006 John Wiley & Sons, Inc.
7-32
33. Hybrids Layouts
Cellular layoutsgroup dissimilar machines into work centers
(called cells) that process families of parts with
similar shapes or processing requirements
Flexible manufacturing system
automated machining and material handling
systems which can produce an enormous variety
of items
Mixed-model assembly line
processes more than one product model in one
line
Copyright 2006 John Wiley & Sons, Inc.
7-33
34. Cellular Layouts
1. Identify families of parts with similarflow paths
2. Group machines into cells based on
part families
3. Arrange cells so material movement
is minimized
4. Locate large shared machines at
point of use
Copyright 2006 John Wiley & Sons, Inc.
7-34
35. Parts Families
A family ofsimilar parts
Copyright 2006 John Wiley & Sons, Inc.
A family of related
grocery items
7-35
36. Original Process Layout
Assembly4
7
6
8
5
2
A
B
12
10
3
1
9
C
11
Raw materials
Copyright 2006 John Wiley & Sons, Inc.
7-36
37. Part Routing Matrix
Parts1
2
A
B
C
D
E
F
G
H
x
x
3
Machines
4 5 6 7
8 9 10 11 12
x
x
x
x
x
x
x
x
x
x
Figure 5.8
Copyright 2006 John Wiley & Sons, Inc.
x
x
x
x x
x
x
x
x
x
x
x
x
x
x
x
x
x
7-37
38. Revised Cellular Layout
Assembly8
10
9
12
11
4
Cell 1
Cell 2
6
Cell 3
7
2
1
3
5
A B C
Raw materials
Copyright 2006 John Wiley & Sons, Inc.
7-38
39. Reordered Routing Matrix
Parts1
2
4
Machines
8 10 3 6
A
D
F
C
G
B
H
E
x
x
x
x
x
x
x
x
x x
x x
x
Copyright 2006 John Wiley & Sons, Inc.
x
x
x
x
9 5
x
x
x
x
7 11 12
x
x
x
x
x
x
x
x
x
7-39
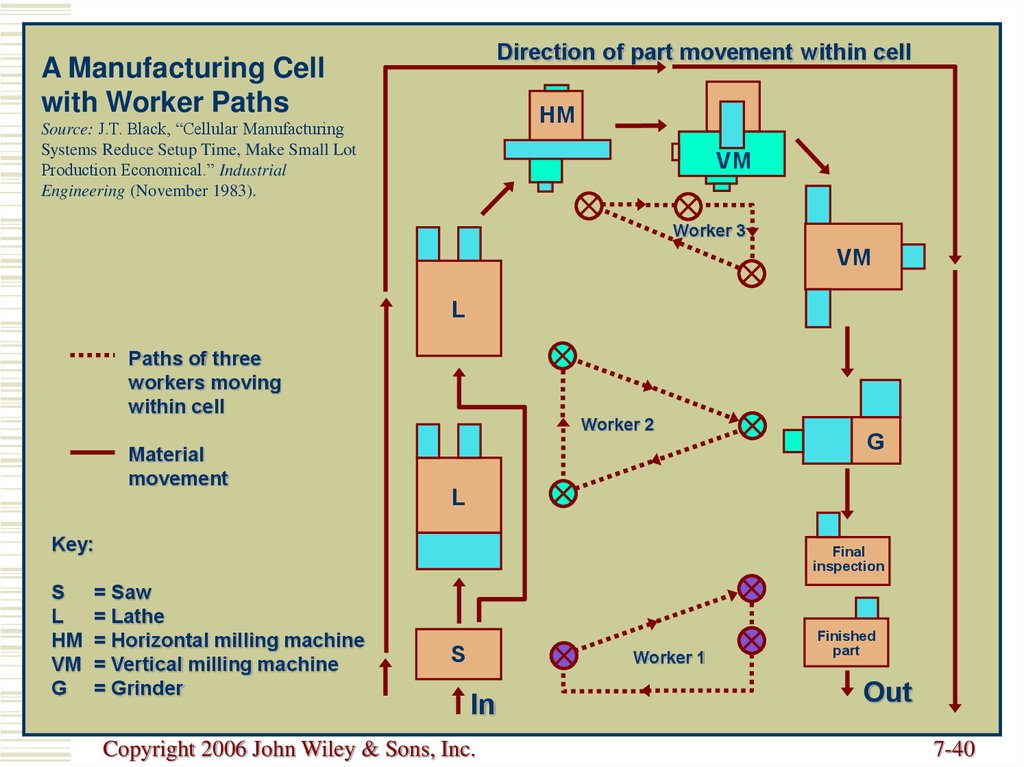
40.
Direction of part movement within cellA Manufacturing Cell
with Worker Paths
HM
Source: J.T. Black, “Cellular Manufacturing
Systems Reduce Setup Time, Make Small Lot
Production Economical.” Industrial
Engineering (November 1983).
VM
Worker 3
VM
L
Paths of three
workers moving
within cell
Worker 2
Material
movement
L
Key:
S
L
HM
VM
G
G
Final
inspection
= Saw
= Lathe
= Horizontal milling machine
= Vertical milling machine
= Grinder
S
Worker 1
In
Copyright 2006 John Wiley & Sons, Inc.
Finished
part
Out
7-40
41. Automated Manufacturing Cell
Source: J. T. Black, “CellularManufacturing Systems Reduce Setup
Time, Make Small Lot
Production Economical.” Industrial
Engineering (November 1983)
Copyright 2006 John Wiley & Sons, Inc.
7-41
42. Advantages and Disadvantages of Cellular Layouts
AdvantagesReduced material
handling and transit time
Reduced setup time
Reduced work-inprocess inventory
Better use of human
resources
Easier to control
Easier to automate
Copyright 2006 John Wiley & Sons, Inc.
Disadvantages
Inadequate part families
Poorly balanced cells
Expanded training and
scheduling
of workers
Increased capital
investment
7-42
43. Flexible Manufacturing Systems (FMS)
FMS consists of numerous programmablemachine tools connected by an automated
material handling system and controlled by
a common computer network
FMS combines flexibility with efficiency
FMS layouts differ based on
variety of parts that the system can process
size of parts processed
average processing time required for part
completion
Copyright 2006 John Wiley & Sons, Inc.
7-43
44. Full-Blown FMS
Copyright 2006 John Wiley & Sons, Inc.7-44
45. Mixed Model Assembly Lines
Produce multiple models in any orderon one assembly line
Issues in mixed model lines
Line balancing
U-shaped line
Flexible workforce
Model sequencing
Copyright 2006 John Wiley & Sons, Inc.
7-45
46. Balancing U-Shaped Lines
Precedence diagram:A
Cycle time = 12 min
B
C
D
E
(a) Balanced for a straight line
A,B
C,D
E
9 min
12 min
3 min
Efficiency =
(b) Balanced for a U-shaped line
A,B
24
24
=
= .6666 = 66.7 %
3(12)
36
C,D
E
24
24
=
= 100 % 12 min
2(12)
24
Copyright 2006 John Wiley & Sons, Inc.
Efficiency =
12 min
7-46
47.
Copyright 2006 John Wiley & Sons, Inc.All rights reserved. Reproduction or translation of this work beyond that
permitted in section 117 of the 1976 United States Copyright Act without
express permission of the copyright owner is unlawful. Request for further
information should be addressed to the Permission Department, John Wiley &
Sons, Inc. The purchaser may make back-up copies for his/her own use only and
not for distribution or resale. The Publisher assumes no responsibility for
errors, omissions, or damages caused by the use of these programs or from the
use of the information herein.
Copyright 2006 John Wiley & Sons, Inc.
7-47