


 is constant")


 Chase Demand")
 Level Production")
 management
Similar presentations:


")

Review for midterm exam II
1. REVIEW FOR MIDTERM EXAM II
2. The Line Balancing Problem
The problem is to arrange theindividual tasks at the workstations
so that the total time required at
each workstation is approximately
the same.
Note that it is nearly impossible to
reach perfect balance
3. Line Balancing
The actual cycle time which is the maximumworkload assigned to a workstation should be
either equal to or less than the required cycle
time. Otherwise, the desired output per day can
not be achieved.
Note that Cycle Time is the time between parts
coming off the line.
4. Question 1: A Line Balancing «Most Following Tasks»
WorkElement
A
B
C
D
E
F
Time Immediate
Description
(min) Predecessor(s)
Tan leather
30
Dye leather
15
A
Shape case
5
B
Mold hinges and fixtures 15
Install hinges and fixtures 10
C,D
Assemble case
10
E
If the demand is 12 cases per 8-hour day, compute a) the required
cycle time b) min. # of WSs. required to satisfy the demand c) min and
max output per day d) Balance the line using «most following
heuristic» e) efficiency and balance delay, f) tot. cycle time per day
4
5. Question 2: Chapter 9, Problem 16, Line Balancing
6. Question 2: Chapter 9, Problem 16, Line Balancing
a) Draw the precedence diagramb) Calculate the minimum and maximum output
possible per 8-hr day
c) Calculate min. # of WSs. required to satisfy
the demand
d) Balance the line using «most following
heuristic» to satisfy the demand
e) Calculate efficiency and balance delay
f) Calculate total idle time per day
7. Inventory Management EOQ Model
8. Inventory Management
Objective is to minimize total costsTotal cost of
holding and
setup (order)
Annual cost
Minimum
total cost
Holding cost
Setup (or order)
cost
Optimal order
quantity (Q*)
Order quantity
Table 12.4(c)
© 2011 Pearson Education, Inc. publishing as Prentice Hall
12 - 8
9. Inventory Management EOQ Model
10. EOQ Model Equations
2 D SOptimal Order Quantity Q *
H
D
Expected Number Orders N
Q*
Expected Time Between Orders T
d
D
Working Days / Year
ROP d L
Working Days / Year
N
D = Demand per year
S = Setup (order) cost per order
H = Holding (carrying) cost
d = Demand per day
L = Lead time in days
11. Question 3, EOQ
The ABC store needs 1000 coffee makersper year. Ordering cost is $100 per order.
Carrying cost per unit per year is $32.20.
Lead time is 5 days. The store is open 365
days/yr. Calculate:
a)
b)
c)
d)
Economic Order Quantity(EOQ),
Total annual cost
Reorder Point
Expected time between orders
12. Production Order Quantity Model
Inventory levelProduction Order Quantity
Model
Part of inventory cycle during
which production (and usage)
is taking place
Demand part of cycle
with no production
Q
Qmax
t1
t2
T
© 2011 Pearson Education, Inc. publishing as Prentice Hall
Time
Figure 12.6
12 - 12
13. EOQ and POQ Models
In the EOQ model, maximum inventory isequal to the Order Size (Q).
Average Inventory = Q/2
In the POQ model, maximum inventory is
less than the Order Size.
Why? Because we produce the item and
use it while it is being produced.
Average Inventory = Qmax / 2
where Qmax= (p-d)Q/p
© 2011 Pearson Education, Inc. publishing as Prentice Hall
12 - 13
14. POQ Model
D – annual demandS – Setup cost
Q
*
p
2 DS
H (1 d / p)
H – Holding cost
d – daily demand rate
p – daily production rate
TC= (Qmax/2) H + (D/Q*) S
12 - 14
15. Question 4, POQ
A plant manager of XYZ chemical plant mustdetermine the lot size for a particular chemical. The
production rate is 190 barrels/day, annual demand
is 10,500 barrels, setup cost is $200 per order,
annual holding cost is $0.21/barrel, and the plant
operates 350 days/year.
a. What is the optimal production quantity?
b. What is the optimal number of production runs
per year?
c. What is the time between production runs?
d. What is the total annual cost?
e. What is the percent of time spent for production.
12 - 15
16. Question 5:Chapter 12, Problem 20, POQ
17. Quantity Discount Model
Same as the EOQ model, except:Unit price depends upon the quantity
ordered
The total cost equation becomes:
D Q
TC QD S H
Q 2
PD
17
© Wiley 2010
12 - 17
18. Question 6: Quantity Discount Model
ABC Sport store is considering goingto a different hat supplier. The present
supplier charges $10/hat and requires
minimum quantities of 490 hats. New
supplier is offering hats at $9 in lots of
at least 4000 or more. The annual
demand is 12,000 hats, the ordering
cost is $20 per order, and the annual
inventory carrying cost per unit is 20%
of the hat cost. What should be
optimum order quantity?
© 2011 Pearson Education, Inc. publishing as Prentice Hall
12 - 18
19. Holding Cost= 0.20 x Purchasing price
Total cost $Holding Cost= 0.20 x Purchasing price
Total cost curve for discount 2
Total cost
curve for
discount 1
Total cost curve for discount 3
b
a
1st price
break
0
490
2nd price
break
3999
© 2011 Pearson Education, Inc. publishing as Prentice Hall
Order quantity
12 - 19
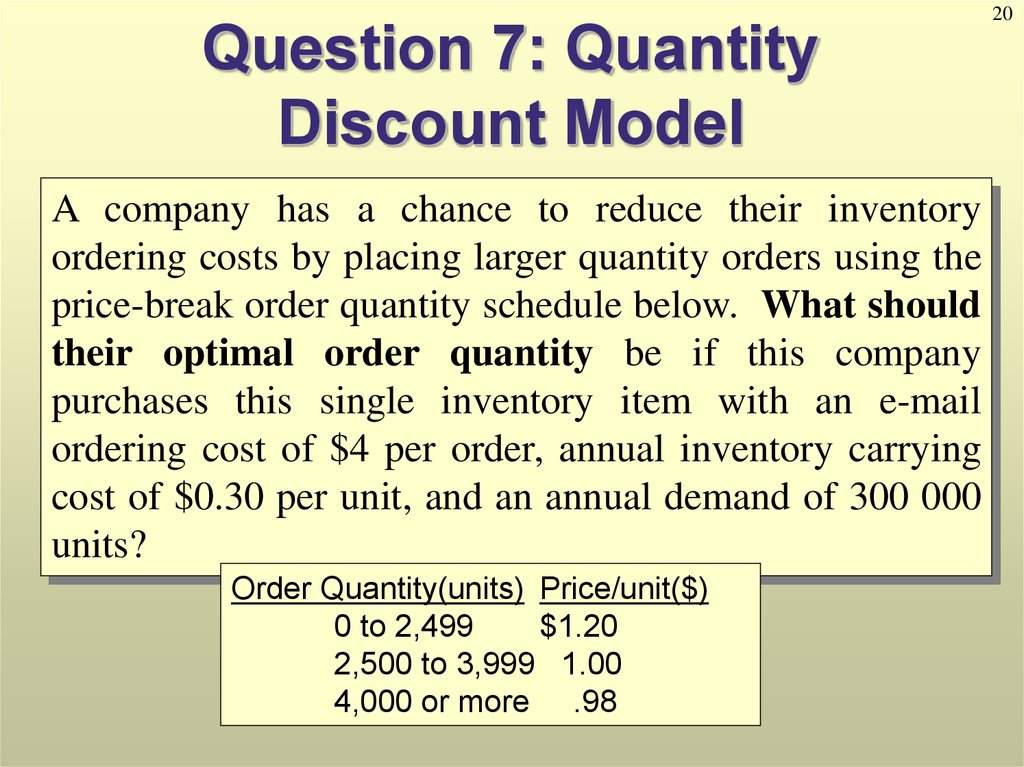
20.
Question 7: QuantityDiscount Model
A company has a chance to reduce their inventory
ordering costs by placing larger quantity orders using the
price-break order quantity schedule below. What should
their optimal order quantity be if this company
purchases this single inventory item with an e-mail
ordering cost of $4 per order, annual inventory carrying
cost of $0.30 per unit, and an annual demand of 300 000
units?
Order Quantity(units) Price/unit($)
0 to 2,499
$1.20
2,500 to 3,999 1.00
4,000 or more .98
20
21. Total Cost with Constant Holding Costs
Total CostTCa
In this case there is a
single minimum point;
all curves will have
their minimum point at
the same quantity
TCb
Decreasing
Price
TCc
HCa,b,c
OC
EOQ
Quantity
12 - 21
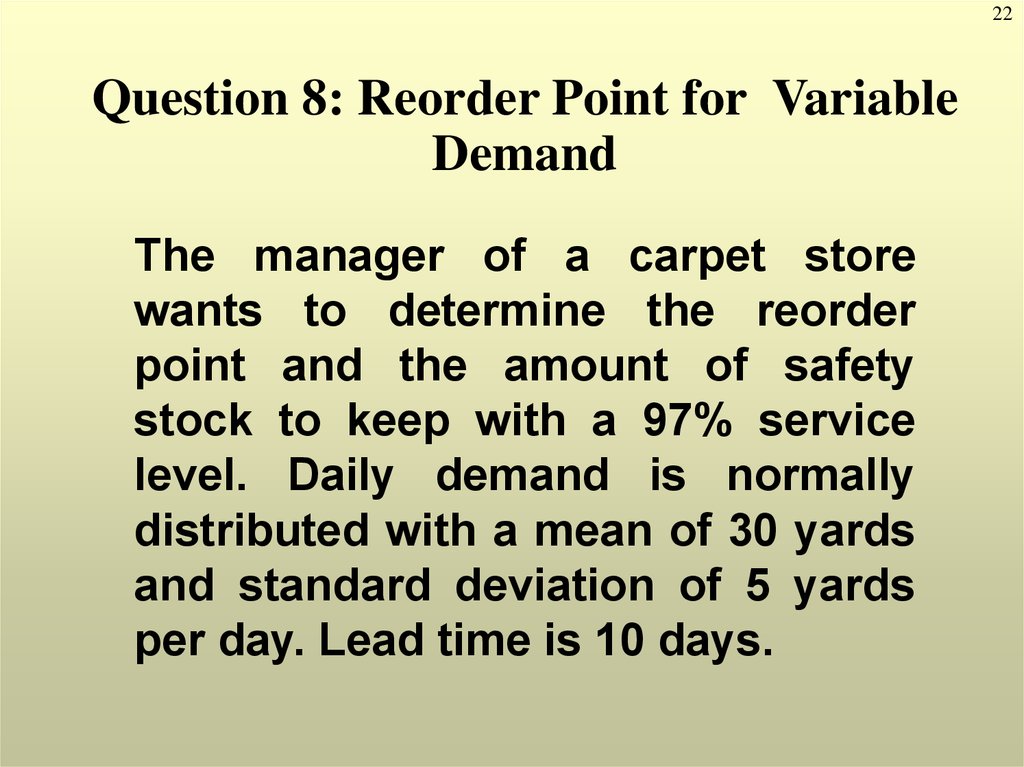
22.
22Question 8: Reorder Point for Variable
Demand
The manager of a carpet store
wants to determine the reorder
point and the amount of safety
stock to keep with a 97% service
level. Daily demand is normally
distributed with a mean of 30 yards
and standard deviation of 5 yards
per day. Lead time is 10 days.
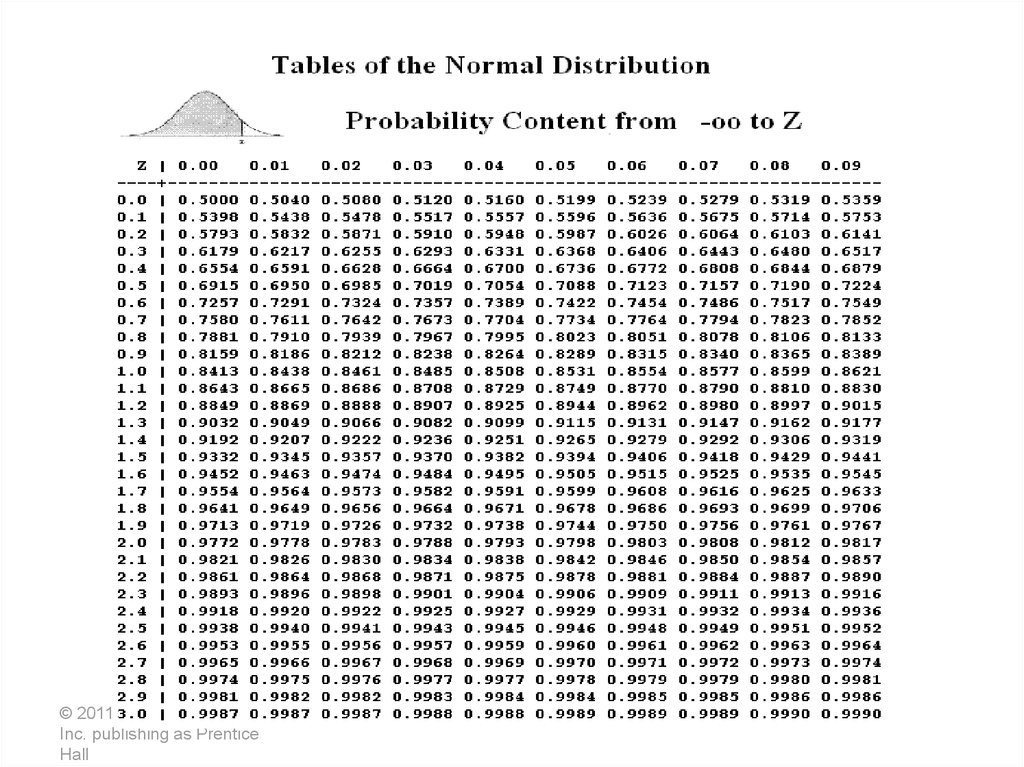
23. Demand per day is variable and lead time (in days) is constant
ROP =(Average daily demand)* Lead time in days) + ZsdLT
wheresdLT = sd
Lead time
sd= standard deviation of demand per day
12 - 23
24.
© 2011 Pearson Education,Inc. publishing as Prentice
Hall
25. Question 9: Aggregate Production Planning
ABC Company has the following aggregate demandrequirements for the upcoming four quarters:
Quarter
1
2
3
4
Demand
1500
1800
1600
1200
Previous quarter's
output
Beginning inventory
Subcontacting Cost
Inventory holding cost
Hiring workers
Laying off workers
Production cost
© 2011 Pearson Education, Inc. publishing as Prentice Hall
1425 units
100 units
$50 per unit
$10 per quarter/unit
$40 per unit
$80 per unit
$30 per unit
12 - 25
26. Question 9: Aggregate Production Planning
Which of the following production plans isbetter:
Plan A–chase demand by hiring and layoffs
Plan B–level strategy and subcontracting
Calculate the total cost of each production
plan.
© 2011 Pearson Education, Inc. publishing as Prentice Hall
12 - 26
27. a) Chase Demand
DemandRegular Time
Units
Units
Production
Increase
Decrease
Quarter 1
Quarter 2
Quarter 3
Quarter 4
Total Units
Total Cost
© 2011 Pearson Education, Inc. publishing as Prentice Hall
13 - 27
28. b) Level Production
RegularTime
Units
Units
Demand Production Backordering Inventory Increase Decrease
Quarter 1
Quarter 2
Quarter 3
Quarter 4
Total Units
Total Cost
© 2011 Pearson Education, Inc. publishing as Prentice Hall
13 - 28