


")

 electronics
Similar presentations:


 An introduction")


")
Deutsches Elektronen Synchrotron DESY. Halo Monitoring
1.
Deutsches Elektronen Synchrotron DESYHalo Monitoring
= Very High Dynamic Beam Profile Measurements;
Transversal (and Longitudinal)
Kay Wittenburg, DESY, MDI
Many slides from:
• Beam halo and bunch purity monitoring, CAS 2008
• Overview of Recent Halo Diagnosis and Non-Destrucive
Beam Profile Monitoring, HB2006
see what’s new…
Kay.Wittenburg@desy.de
2. Outline
• Halo diagnostic:– What is Halo?
– Halo Quantification
– Halo Measurements
• Some examples
3. What is Halo?
“It is very difficult to give a simple definition of the “halo”. It could be a solebeam characteristic or a beam accelerator system characteristic linked to the
potential losses it can produced. It could be defined by a number of particles (in
the halo) or a size (of the halo). It could be described in the geometric space or in
the phase-spaces… “
N. Pichoff et al, IPAC14
-------------------------------------------------------------------------------------------…it became clear that even at this workshop (HALO 03) a general definition of
"Beam Halo" could not be given, because of the very different requirements in
different machines, and because of the differing perspectives of
instrumentation specialists and accelerator physicists.
From the diagnostics point of view, one thing is certainly
clear – by definition halo is low density and therefore
difficult to measure…
• Profile measurements are often questioned at the
level of a few percent, the difficulty is easily seen in
making halo measurements already at the level of 10-4
and beyond.
… it is bigger on the inside. Dr. Who, 1963 - , BBC
4.
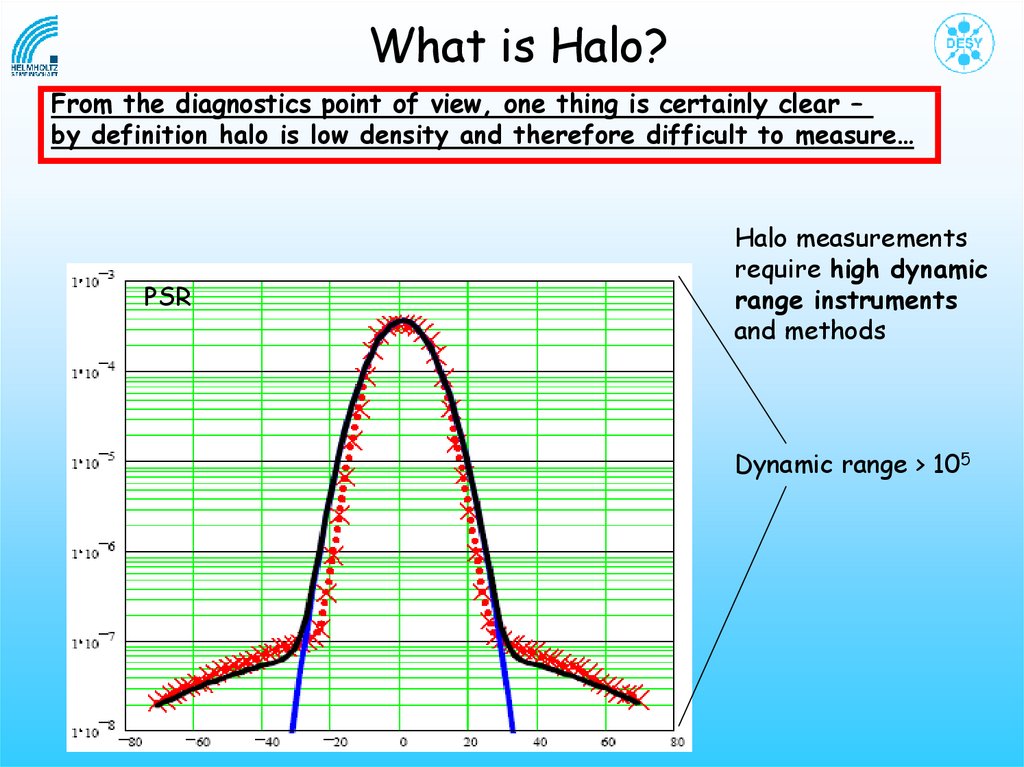
What is Halo?From the diagnostics point of view, one thing is certainly clear –
by definition halo is low density and therefore difficult to measure…
PSR
Halo measurements
require high dynamic
range instruments
and methods
Dynamic range > 105
5.
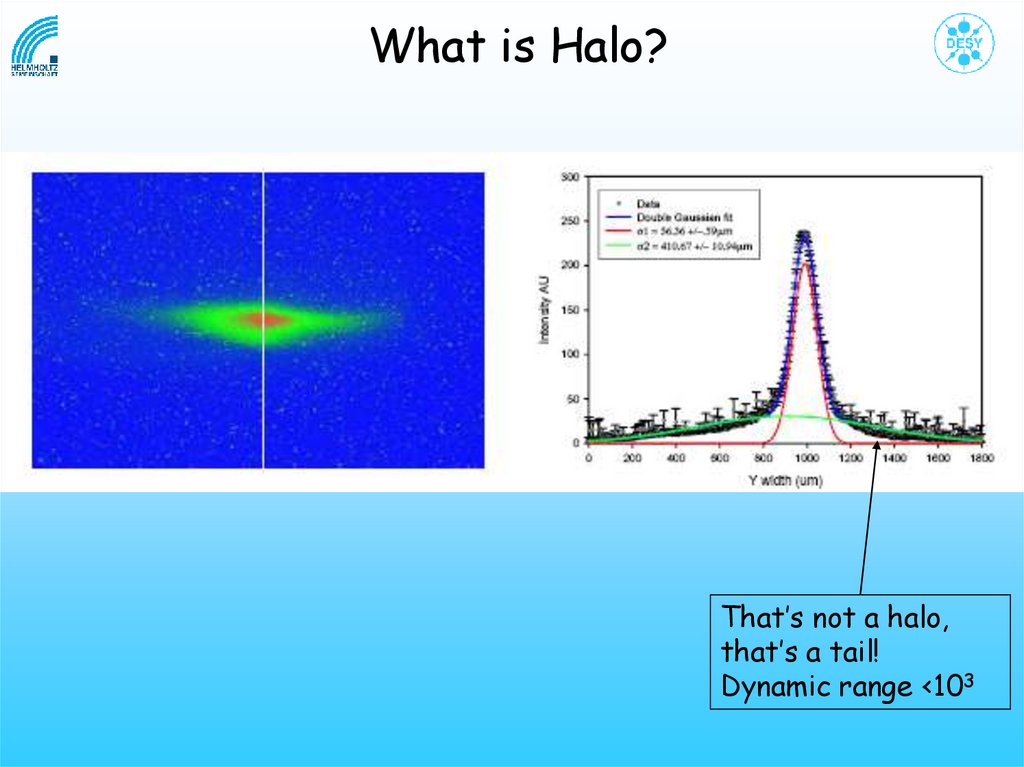
What is Halo?That’s not a halo,
that’s a tail!
Dynamic range <103
6.
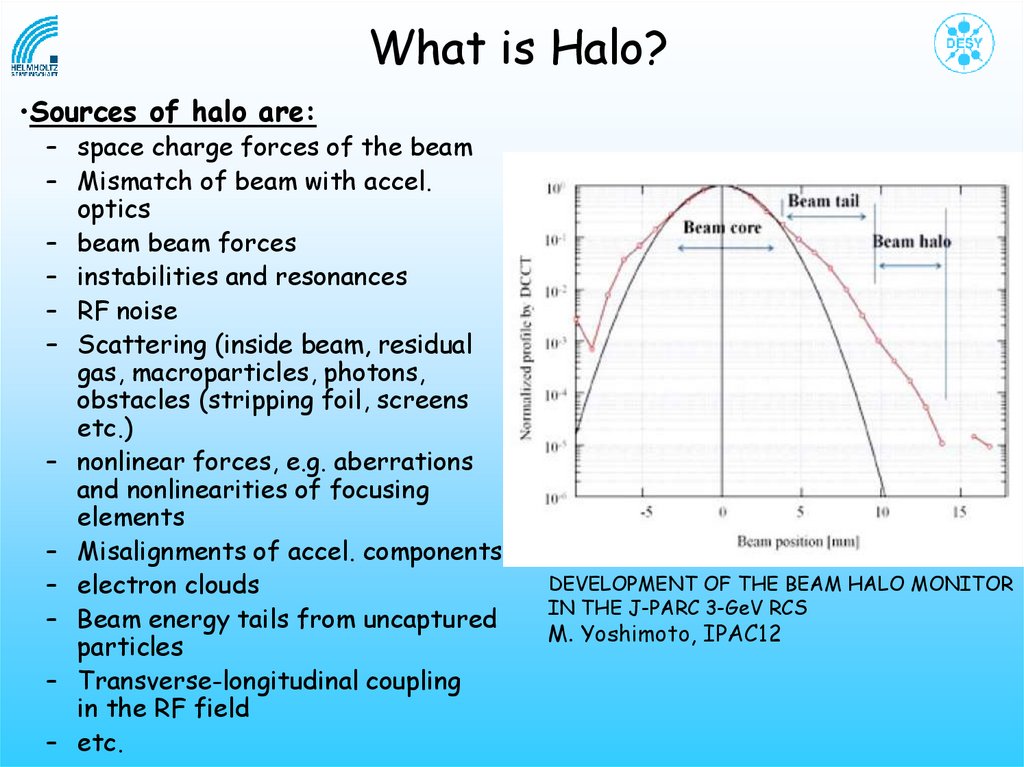
What is Halo?•Sources of halo are:
– space charge forces of the beam
– Mismatch of beam with accel.
optics
– beam beam forces
– instabilities and resonances
– RF noise
– Scattering (inside beam, residual
gas, macroparticles, photons,
obstacles (stripping foil, screens
etc.)
– nonlinear forces, e.g. aberrations
and nonlinearities of focusing
elements
– Misalignments of accel. components
– electron clouds
– Beam energy tails from uncaptured
particles
– Transverse-longitudinal coupling
in the RF field
– etc.
DEVELOPMENT OF THE BEAM HALO MONITOR
IN THE J-PARC 3-GeV RCS
M. Yoshimoto, IPAC12
7. Outline
• Halo diagnostic:– What is Halo?
– Halo Quantification
– Halo Measurements
• Some examples
8.
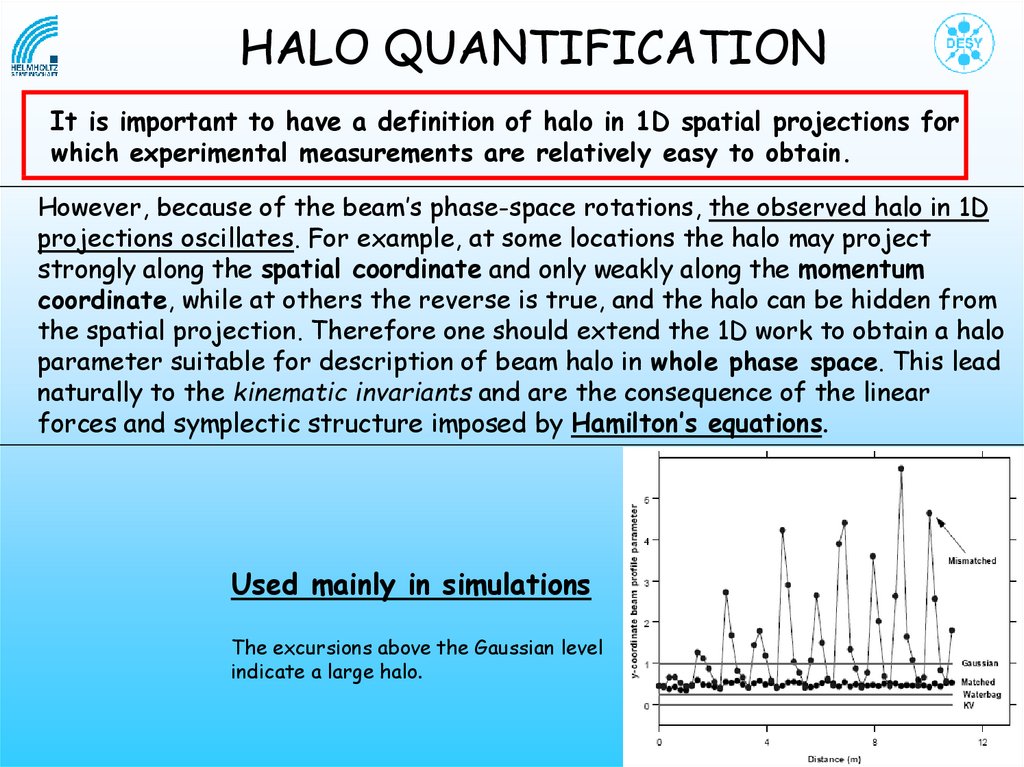
HALO QUANTIFICATIONIt is important to have a definition of halo in 1D spatial projections for
which experimental measurements are relatively easy to obtain.
However, because of the beam’s phase-space rotations, the observed halo in 1D
projections oscillates. For example, at some locations the halo may project
strongly along the spatial coordinate and only weakly along the momentum
coordinate, while at others the reverse is true, and the halo can be hidden from
the spatial projection. Therefore one should extend the 1D work to obtain a halo
parameter suitable for description of beam halo in whole phase space. This lead
naturally to the kinematic invariants and are the consequence of the linear
forces and symplectic structure imposed by Hamilton’s equations.
Used mainly in simulations
The excursions above the Gaussian level
indicate a large halo.
9.
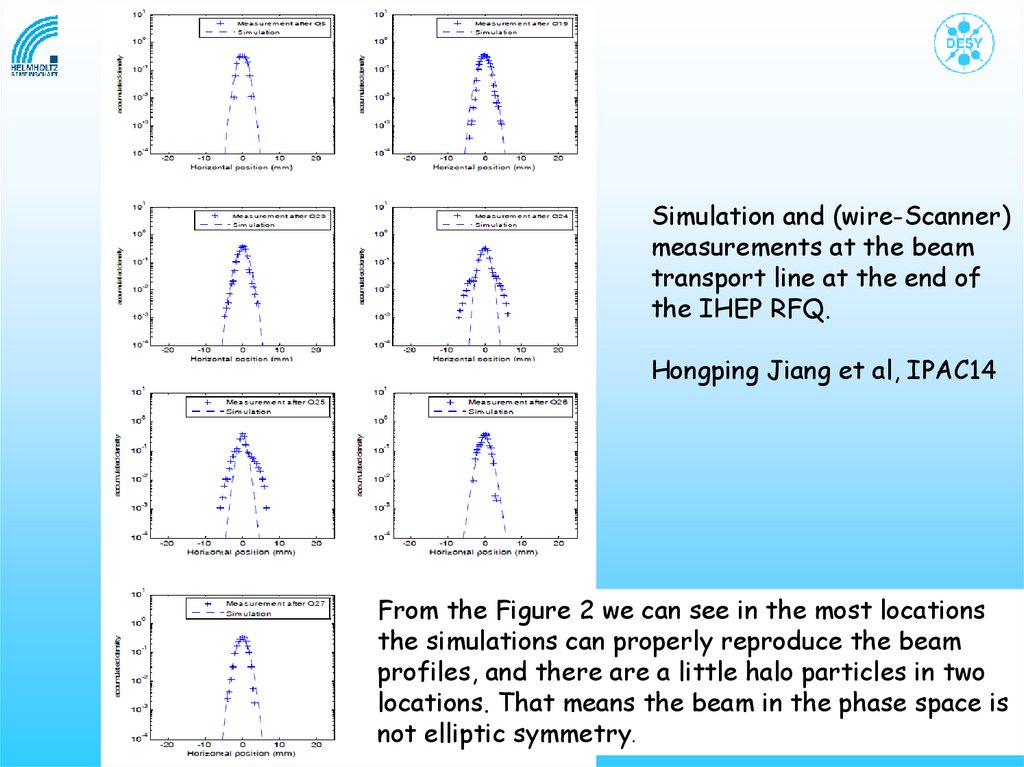
Simulation and (wire-Scanner)measurements at the beam
transport line at the end of
the IHEP RFQ.
Hongping Jiang et al, IPAC14
From the Figure 2 we can see in the most locations
the simulations can properly reproduce the beam
profiles, and there are a little halo particles in two
locations. That means the beam in the phase space is
not elliptic symmetry.
10.
HALO QUANTIFICATION1)
2)
3)
4)
There is no clearly defined separation between the halo and the main
core of the beam. Consequently, there has been some difficulty
identifying a suitable quantitative measure of the halo content of a
beam in a model-independent way.
A general characteristic of beam halo is the increased population of
the outer part of the beam.
Methods have been developed, and computationally studied, to
characterize beam halo.
Kurtosis
The Gaussian area ratio method
Ratio of beam core to offset
Ratio of halo to core
Note that
1. A measurement always contains instrumental effects!!!!
2. Powerful simulations are useless if significant physical mechanisms
are missing or if the beam input distribution is unrealistic.
11.
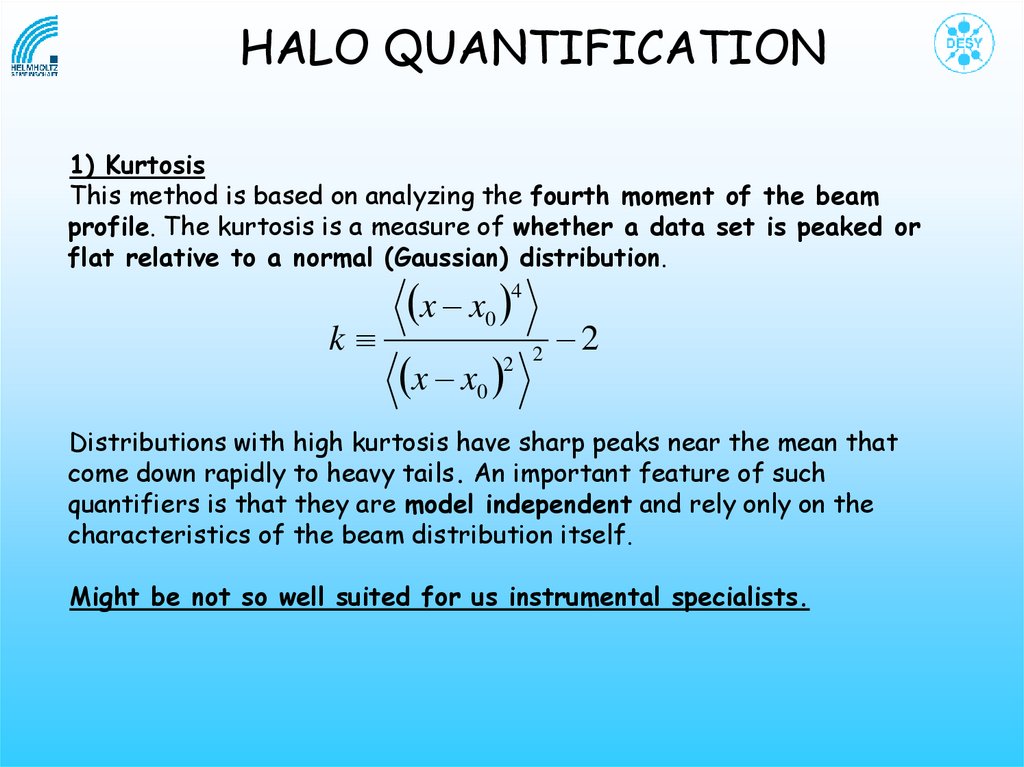
HALO QUANTIFICATION1) Kurtosis
This method is based on analyzing the fourth moment of the beam
profile. The kurtosis is a measure of whether a data set is peaked or
flat relative to a normal (Gaussian) distribution.
k
x x0 4
x x0
2 2
2
Distributions with high kurtosis have sharp peaks near the mean that
come down rapidly to heavy tails. An important feature of such
quantifiers is that they are model independent and rely only on the
characteristics of the beam distribution itself.
Might be not so well suited for us instrumental specialists.
12.
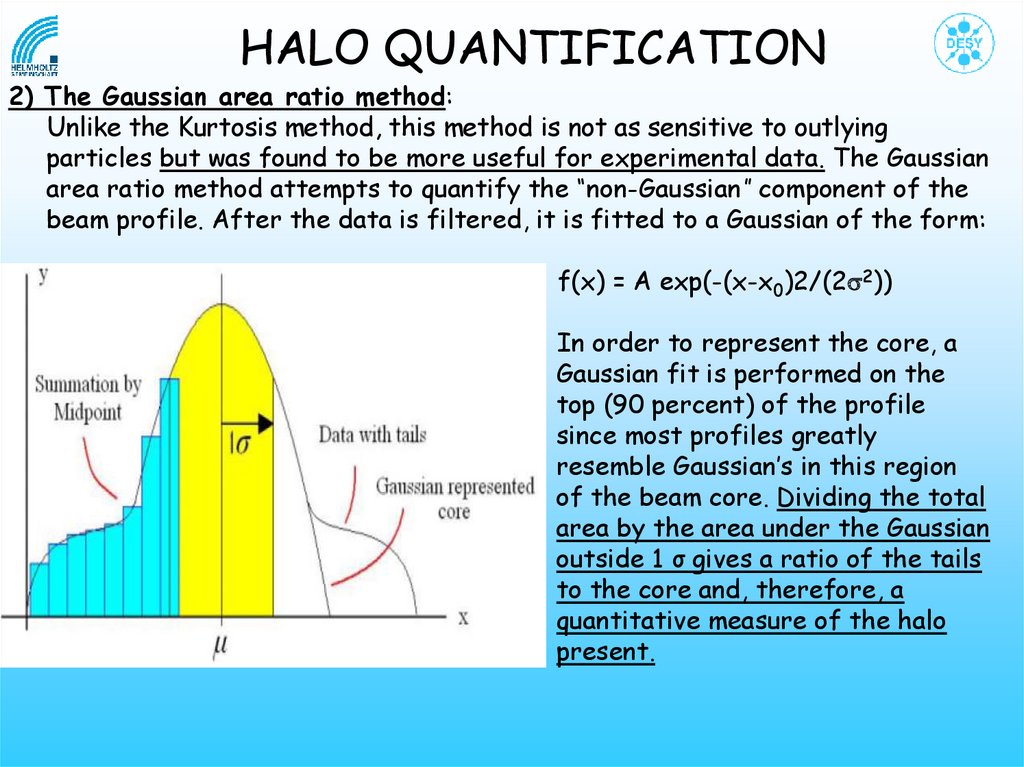
HALO QUANTIFICATION2) The Gaussian area ratio method:
Unlike the Kurtosis method, this method is not as sensitive to outlying
particles but was found to be more useful for experimental data. The Gaussian
area ratio method attempts to quantify the “non-Gaussian” component of the
beam profile. After the data is filtered, it is fitted to a Gaussian of the form:
f(x) = A exp(-(x-x0)2/(2s2))
In order to represent the core, a
Gaussian fit is performed on the
top (90 percent) of the profile
since most profiles greatly
resemble Gaussian’s in this region
of the beam core. Dividing the total
area by the area under the Gaussian
outside 1 σ gives a ratio of the tails
to the core and, therefore, a
quantitative measure of the halo
present.
13.
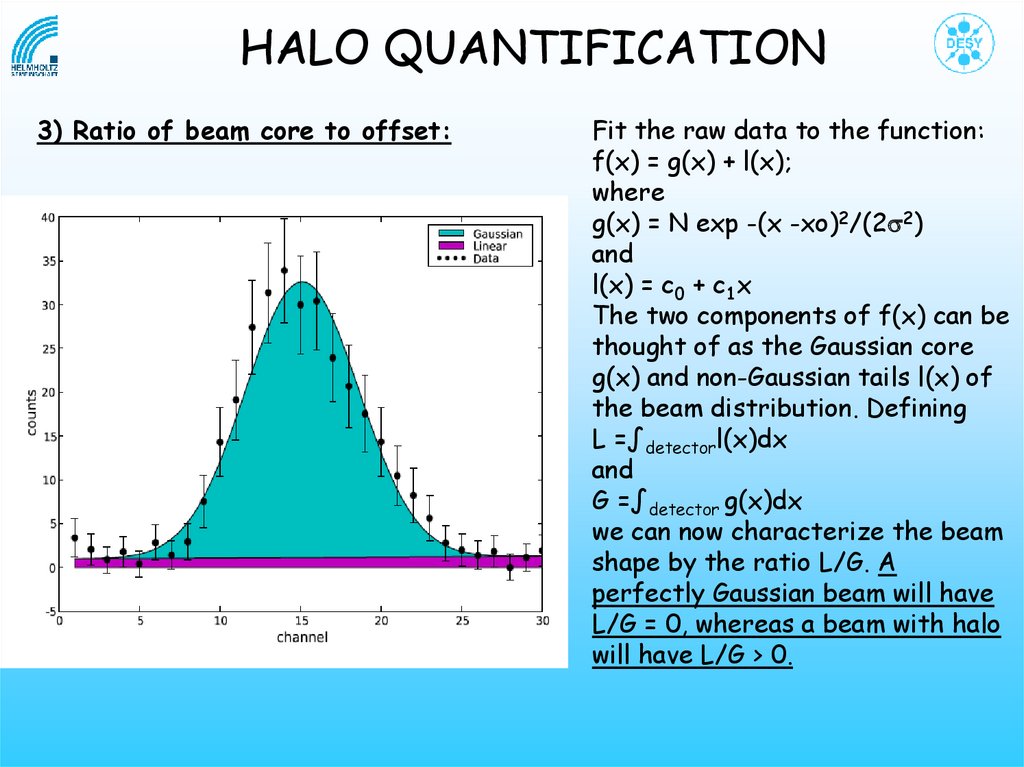
HALO QUANTIFICATION3) Ratio of beam core to offset:
Fit the raw data to the function:
f(x) = g(x) + l(x);
where
g(x) = N exp -(x -xo)2/(2s2)
and
l(x) = c0 + c1x
The two components of f(x) can be
thought of as the Gaussian core
g(x) and non-Gaussian tails l(x) of
the beam distribution. Defining
L =∫detectorl(x)dx
and
G =∫detector g(x)dx
we can now characterize the beam
shape by the ratio L/G. A
perfectly Gaussian beam will have
L/G = 0, whereas a beam with halo
will have L/G > 0.
14.
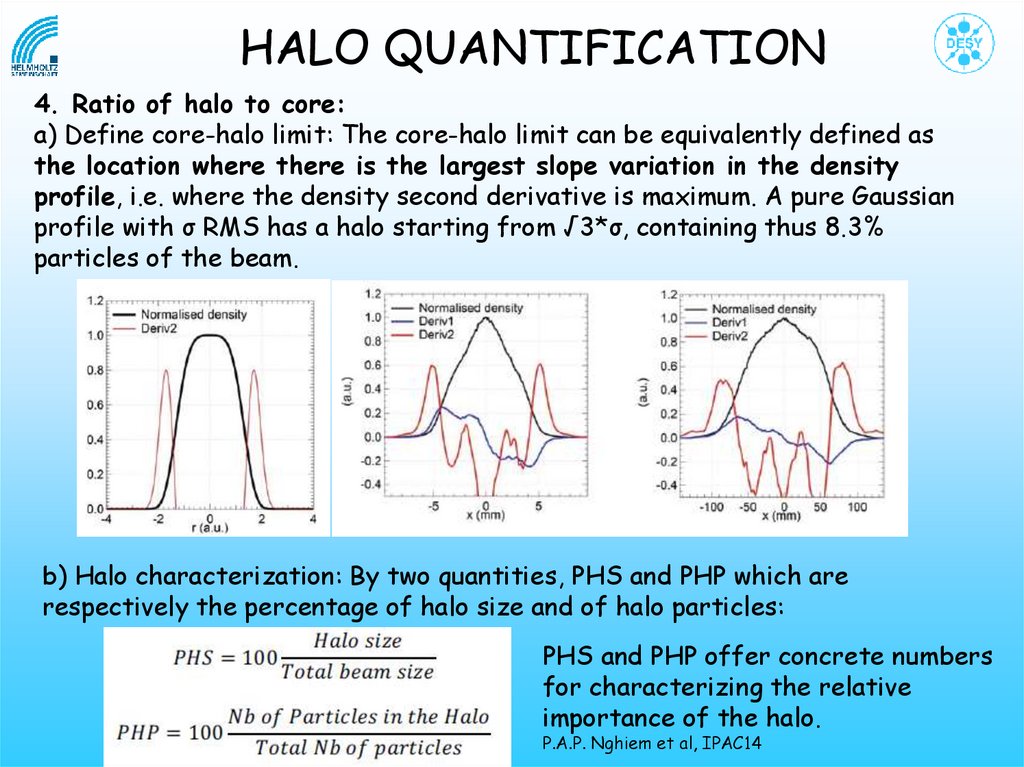
HALO QUANTIFICATION4. Ratio of halo to core:
a) Define core-halo limit: The core-halo limit can be equivalently defined as
the location where there is the largest slope variation in the density
profile, i.e. where the density second derivative is maximum. A pure Gaussian
profile with σ RMS has a halo starting from √3*σ, containing thus 8.3%
particles of the beam.
b) Halo characterization: By two quantities, PHS and PHP which are
respectively the percentage of halo size and of halo particles:
PHS and PHP offer concrete numbers
for characterizing the relative
importance of the halo.
P.A.P. Nghiem et al, IPAC14
15. Outline
• Halo diagnostic:– What is Halo?
– Halo Quantification
– Halo Measurements
• Some examples
16.
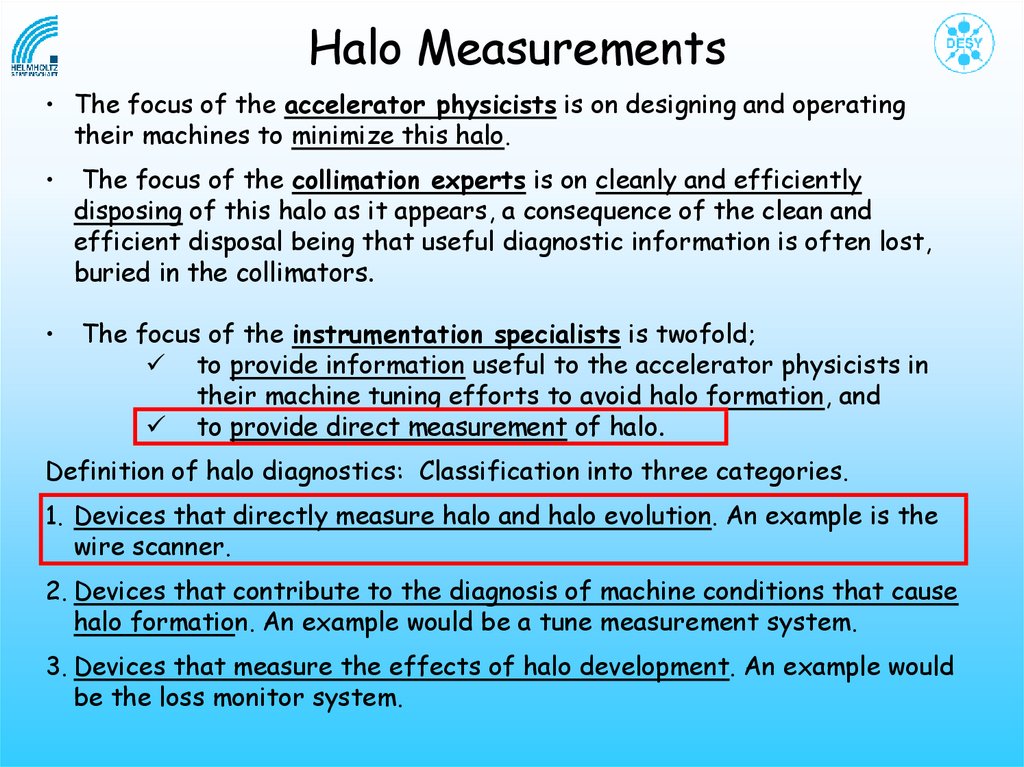
Halo Measurements• The focus of the accelerator physicists is on designing and operating
their machines to minimize this halo.
The focus of the collimation experts is on cleanly and efficiently
disposing of this halo as it appears, a consequence of the clean and
efficient disposal being that useful diagnostic information is often lost,
buried in the collimators.
The focus of the instrumentation specialists is twofold;
to provide information useful to the accelerator physicists in
their machine tuning efforts to avoid halo formation, and
to provide direct measurement of halo.
Definition of halo diagnostics: Classification into three categories.
1. Devices that directly measure halo and halo evolution. An example is the
wire scanner.
2. Devices that contribute to the diagnosis of machine conditions that cause
halo formation. An example would be a tune measurement system.
3. Devices that measure the effects of halo development. An example would
be the loss monitor system.
17.
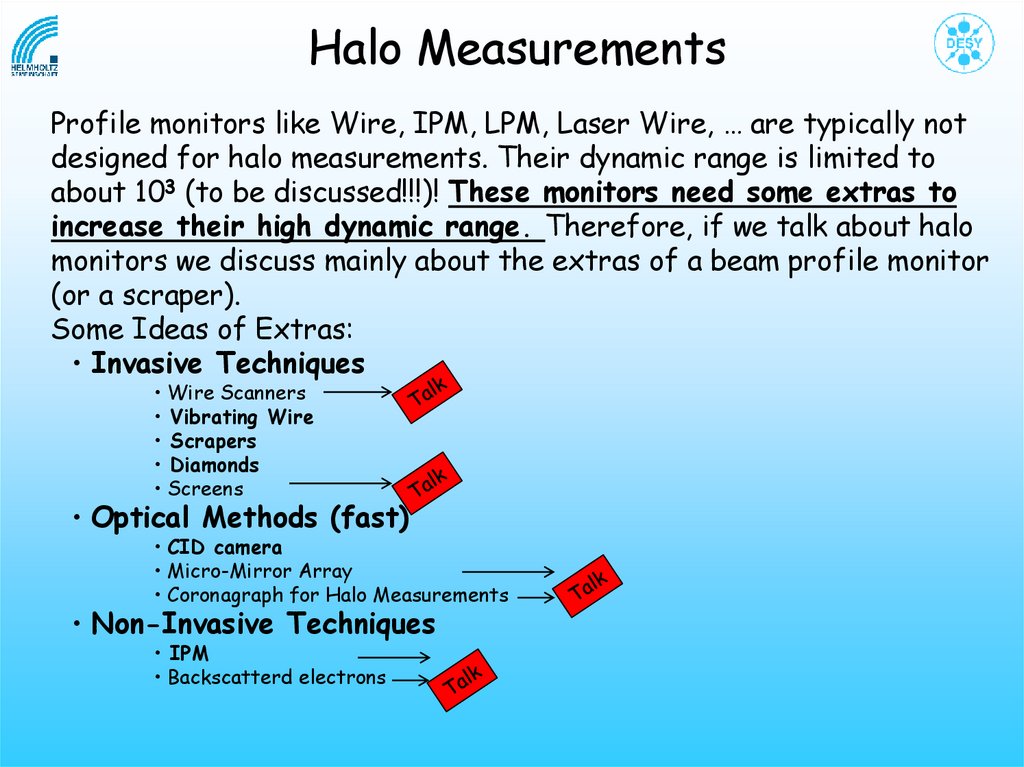
Halo MeasurementsProfile monitors like Wire, IPM, LPM, Laser Wire, … are typically not
designed for halo measurements. Their dynamic range is limited to
about 103 (to be discussed!!!)! These monitors need some extras to
increase their high dynamic range. Therefore, if we talk about halo
monitors we discuss mainly about the extras of a beam profile monitor
(or a scraper).
Some Ideas of Extras:
• Invasive Techniques
• Wire Scanners
• Vibrating Wire
• Scrapers
• Diamonds
• Screens
• Optical Methods (fast)
• CID camera
• Micro-Mirror Array
• Coronagraph for Halo Measurements
• Non-Invasive Techniques
• IPM
• Backscatterd electrons
18.
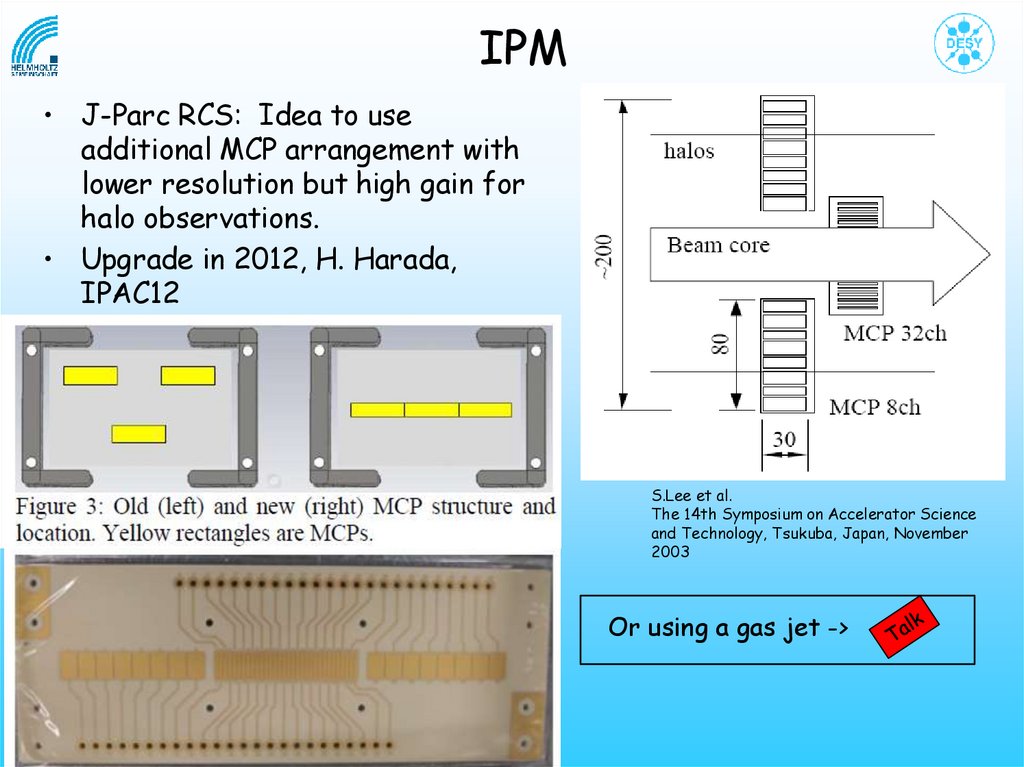
IPM• J-Parc RCS: Idea to use
additional MCP arrangement with
lower resolution but high gain for
halo observations.
• Upgrade in 2012, H. Harada,
IPAC12
S.Lee et al.
The 14th Symposium on Accelerator Science
and Technology, Tsukuba, Japan, November
2003
Or using a gas jet ->
19.
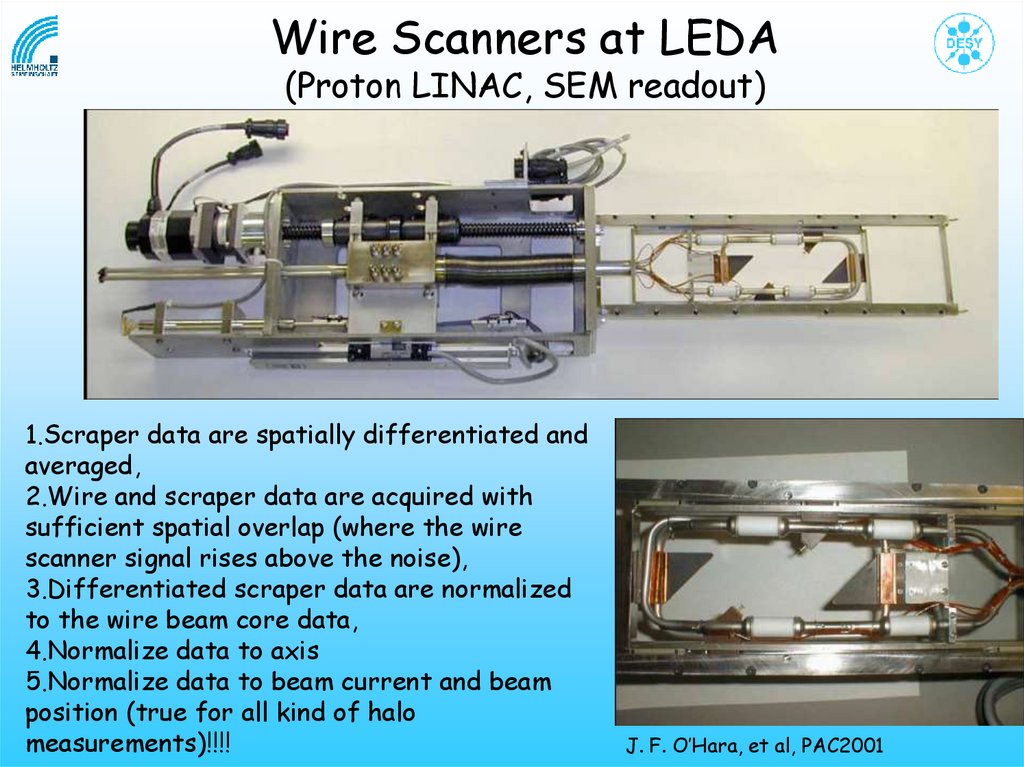
Wire Scanners at LEDA(Proton LINAC, SEM readout)
1.Scraper data are spatially differentiated and
averaged,
2.Wire and scraper data are acquired with
sufficient spatial overlap (where the wire
scanner signal rises above the noise),
3.Differentiated scraper data are normalized
to the wire beam core data,
4.Normalize data to axis
5.Normalize data to beam current and beam
position (true for all kind of halo
measurements)!!!!
J. F. O’Hara, et al, PAC2001
20.
Wire Scanners at LEDAY-axis wire scan
Combined distribution in y.
=>
+
+
-Y and + Y scrape signal and derivative. The derivative has been multiplied by ten.
21.
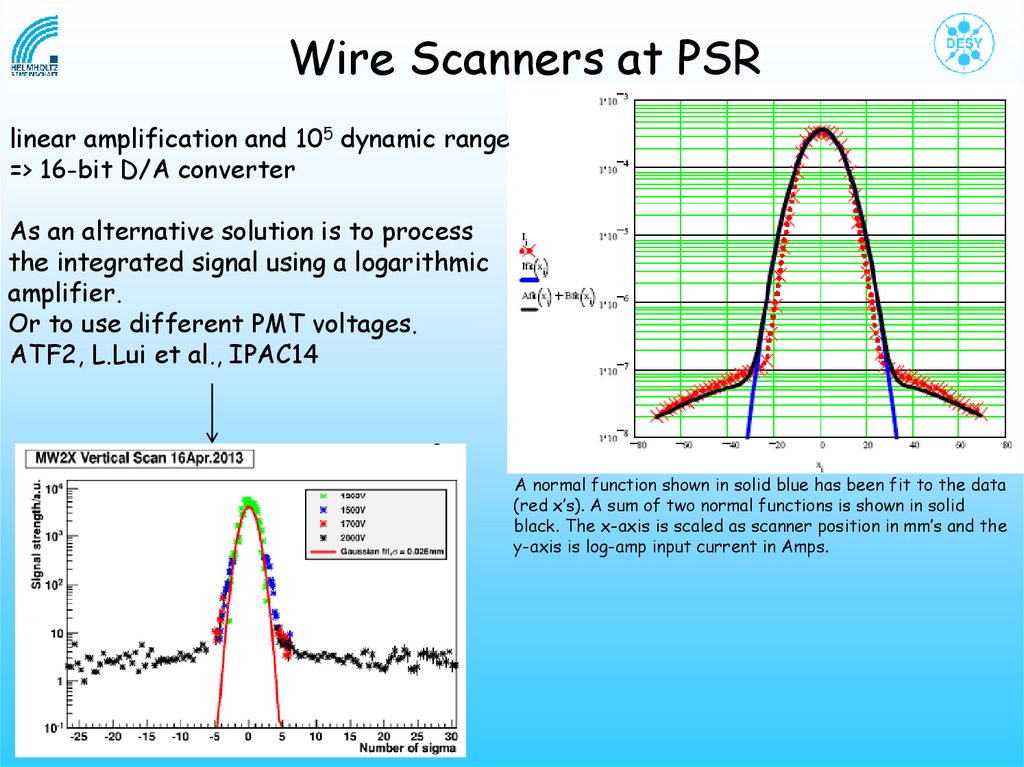
Wire Scanners at PSRlinear amplification and 105 dynamic range
=> 16-bit D/A converter
As an alternative solution is to process
the integrated signal using a logarithmic
amplifier.
Or to use different PMT voltages.
ATF2, L.Lui et al., IPAC14
A normal function shown in solid blue has been fit to the data
(red x’s). A sum of two normal functions is shown in solid
black. The x-axis is scaled as scanner position in mm’s and the
y-axis is log-amp input current in Amps.
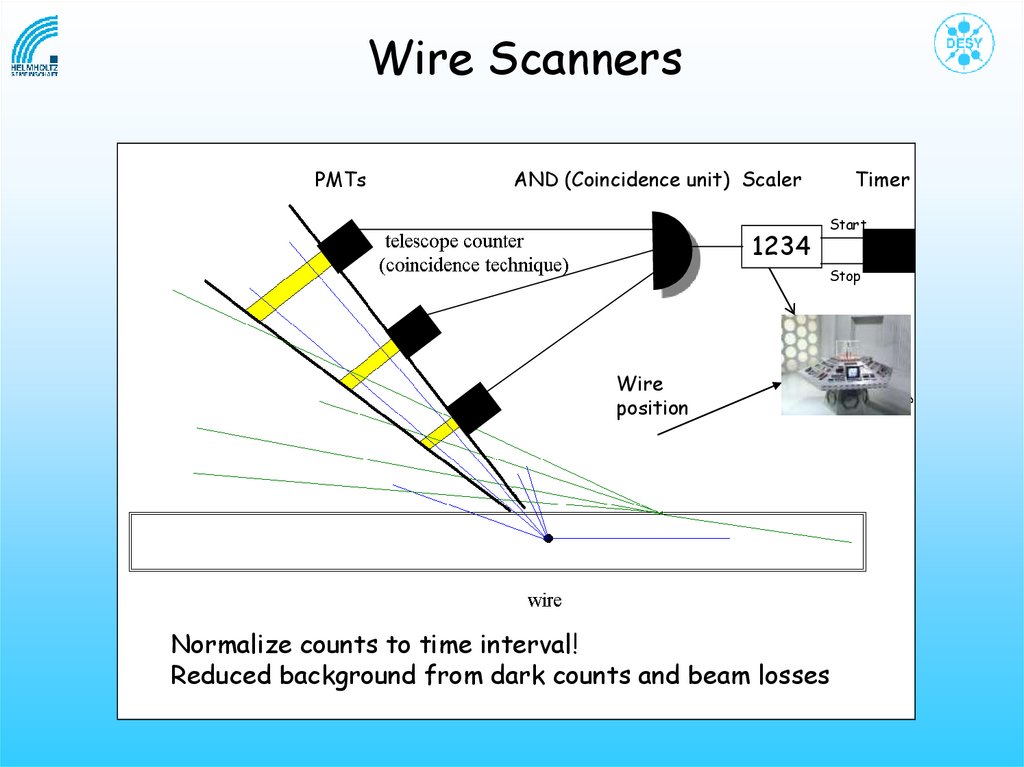
22.
Wire ScannersPMTs
AND (Coincidence unit) Scaler
1234
Timer
Start
Stop
Wire
position
Normalize counts to time interval!
Reduced background from dark counts and beam losses
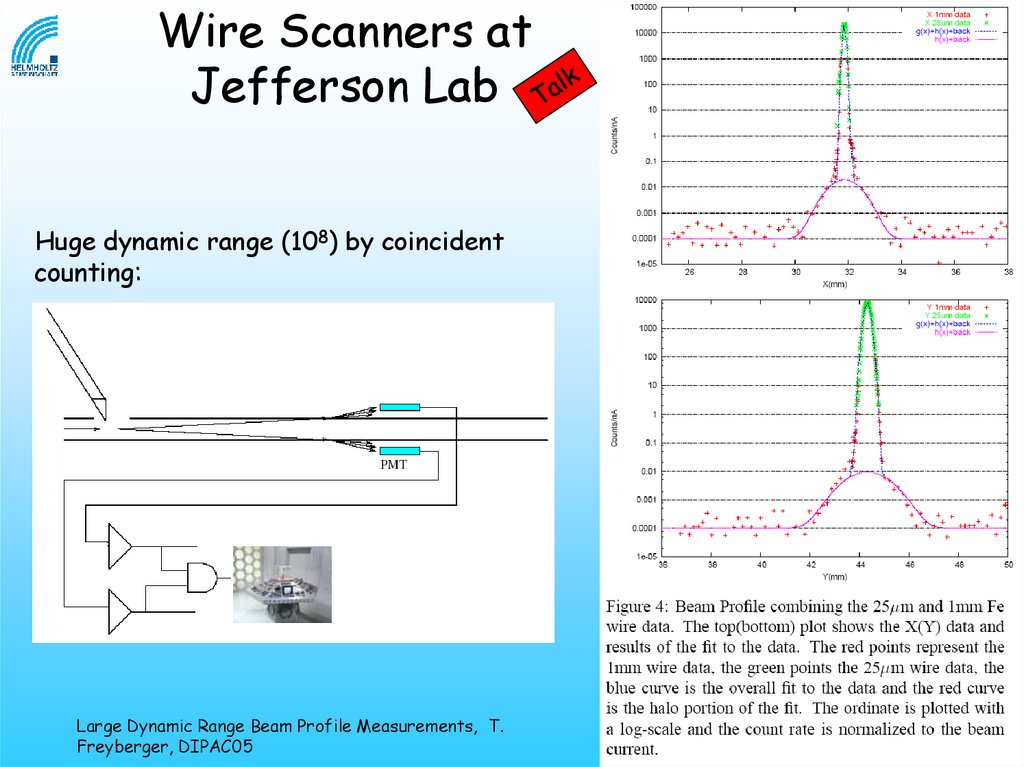
23.
Wire Scanners atJefferson Lab
Huge dynamic range (108) by coincident
counting:
Large Dynamic Range Beam Profile Measurements, T.
Freyberger, DIPAC05
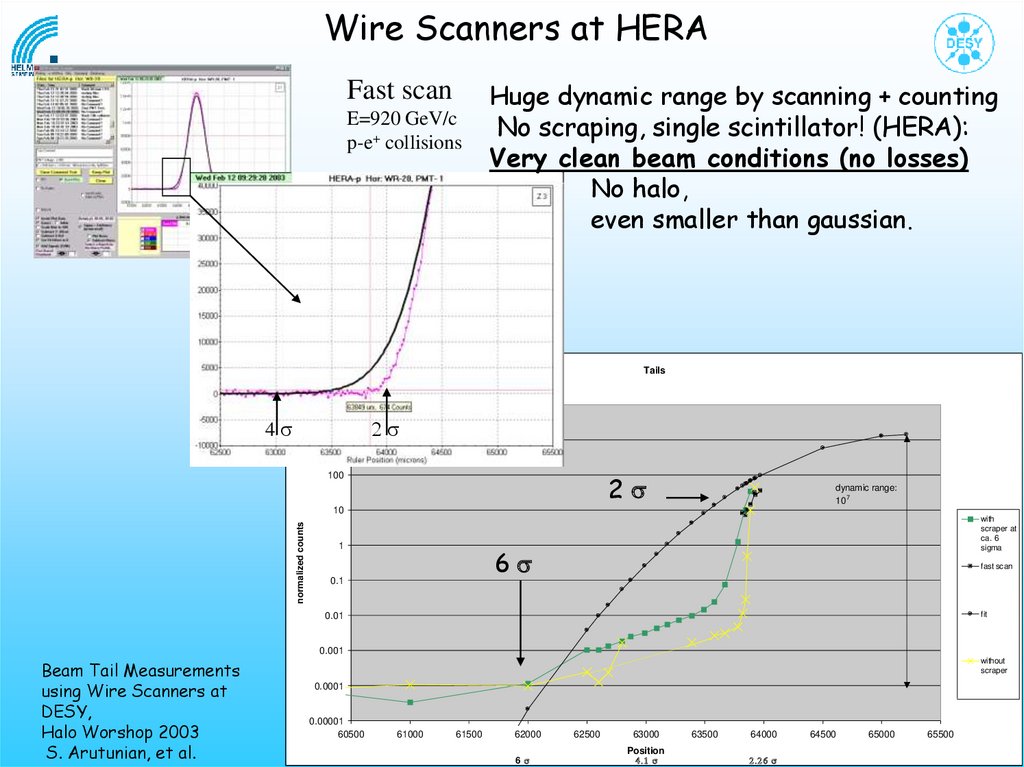
24.
Wire Scanners at HERAFast scan
E=920 GeV/c
p-e+ collisions
Huge dynamic range by scanning + counting
No scraping, single scintillator! (HERA):
Very clean beam conditions (no losses)
No halo,
even smaller than gaussian.
Tails
10000
4 s s
1000
2s
100
dynamic range:
107
normalized counts
10
1
with
scraper at
ca. 6
sigma
6s
0.1
fast scan
fit
0.01
0.001
Beam Tail Measurements
using Wire Scanners at
DESY,
Halo Worshop 2003
S. Arutunian, et al.
without
scraper
0.0001
0.00001
60500
61000
61500
62000
62500
63000
63500
64000
64500
65000
Position
6 s s s
65500
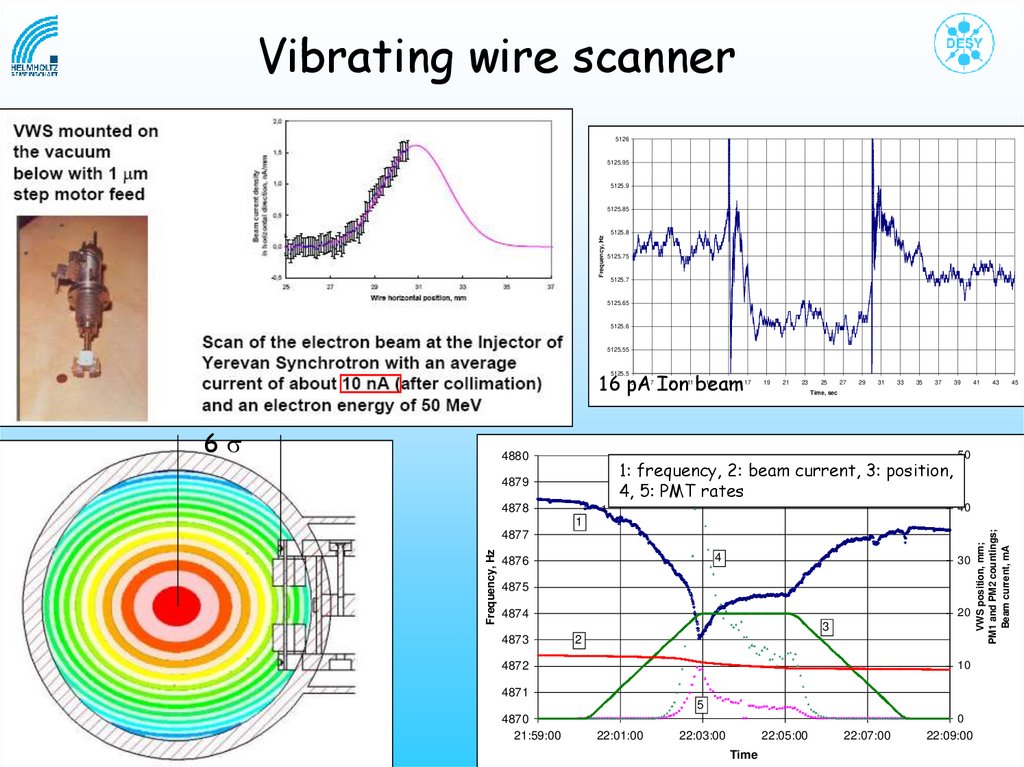
25.
Vibrating wire scanner5126
5125.95
5125.9
Frequency, Hz
5125.85
5125.8
5125.75
5125.7
5125.65
5125.6
5125.55
16 pA Ion beam
5125.5
5
6s
4880
7
9
11
13
15
17
19
21
23
25
27
29
31
33
35
37
1: frequency, 2: beam current, 3: position,
4, 5: PMT rates
4879
4878
39
41
43
Time, sec
50
40
1
Frequency, Hz
4877
4
4876
30
4875
20
4874
3
4873
2
10
4872
4871
5
4870
21:59:00
0
22:01:00
22:03:00
22:05:00
Time
22:07:00
22:09:00
VWS position, mm;
PM1 and PM2 countings;
Beam current, mA
1
45
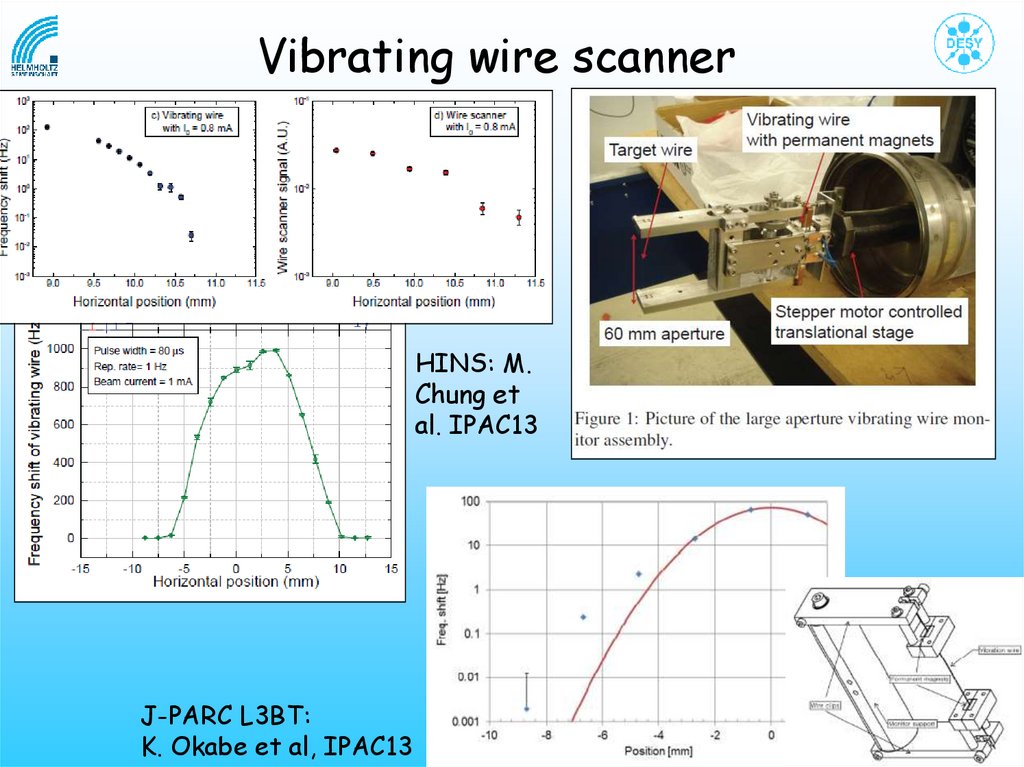
26.
Vibrating wire scannerHINS: M.
Chung et
al. IPAC13
J-PARC L3BT:
K. Okabe et al, IPAC13
27. Halo scraping by collimators
beam lossmonitors
CERN-SL-99-068 (OP)
TRANSVERSE
BEAM TAILS
DUE TO
INELASTIC
SCATTERING
H. Burkhardt, I.
Reichel, G. Roy,
CERN-SL-99068 (OP)
TRANSVERSE
H- BEAM HALO
SCRAPER
SYSTEM
IN THE JPARC L3BT
K. Okabe et al.,
IPAC14
x
In a synchrotron one jaw will
scrape both sides of the beam
distribution (b-oszillation)
=> meas. symmetric halo
Such a tail scan yields information
about particles which oscillate
with an amplitude larger than the
position of the collimator = Halo
Scraping
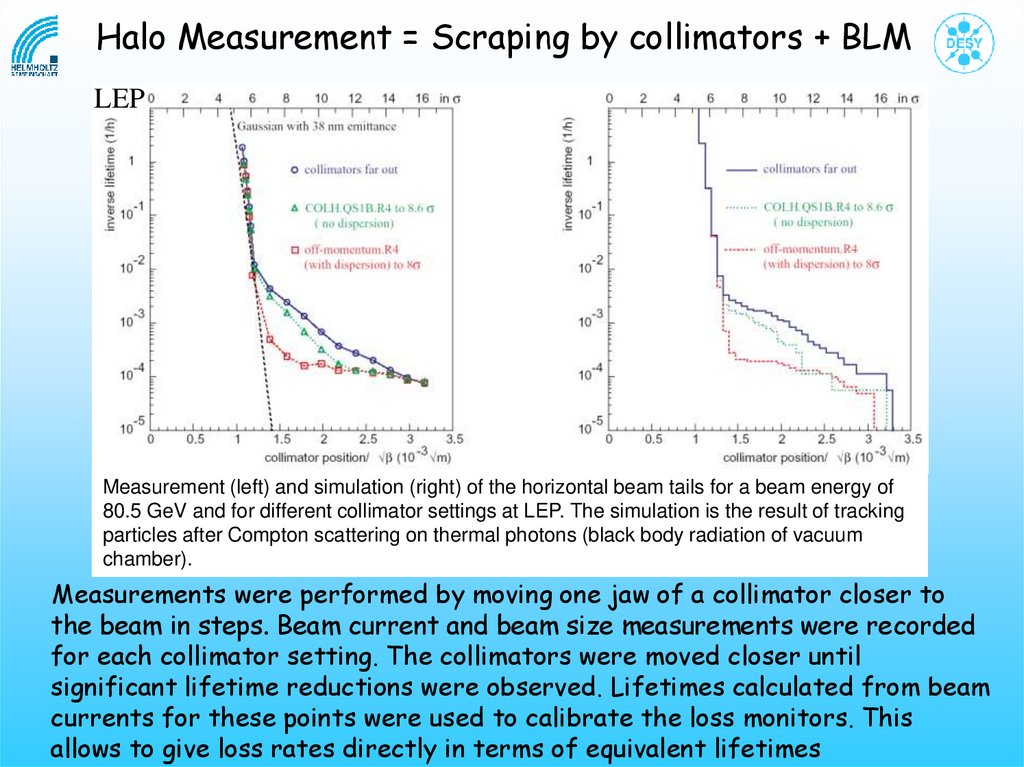
28.
Halo Measurement = Scraping by collimators + BLMLEP
Measurement (left) and simulation (right) of the horizontal beam tails for a beam energy of
80.5 GeV and for different collimator settings at LEP. The simulation is the result of tracking
particles after Compton scattering on thermal photons (black body radiation of vacuum
chamber).
Measurements were performed by moving one jaw of a collimator closer to
the beam in steps. Beam current and beam size measurements were recorded
for each collimator setting. The collimators were moved closer until
significant lifetime reductions were observed. Lifetimes calculated from beam
currents for these points were used to calibrate the loss monitors. This
allows to give loss rates directly in terms of equivalent lifetimes
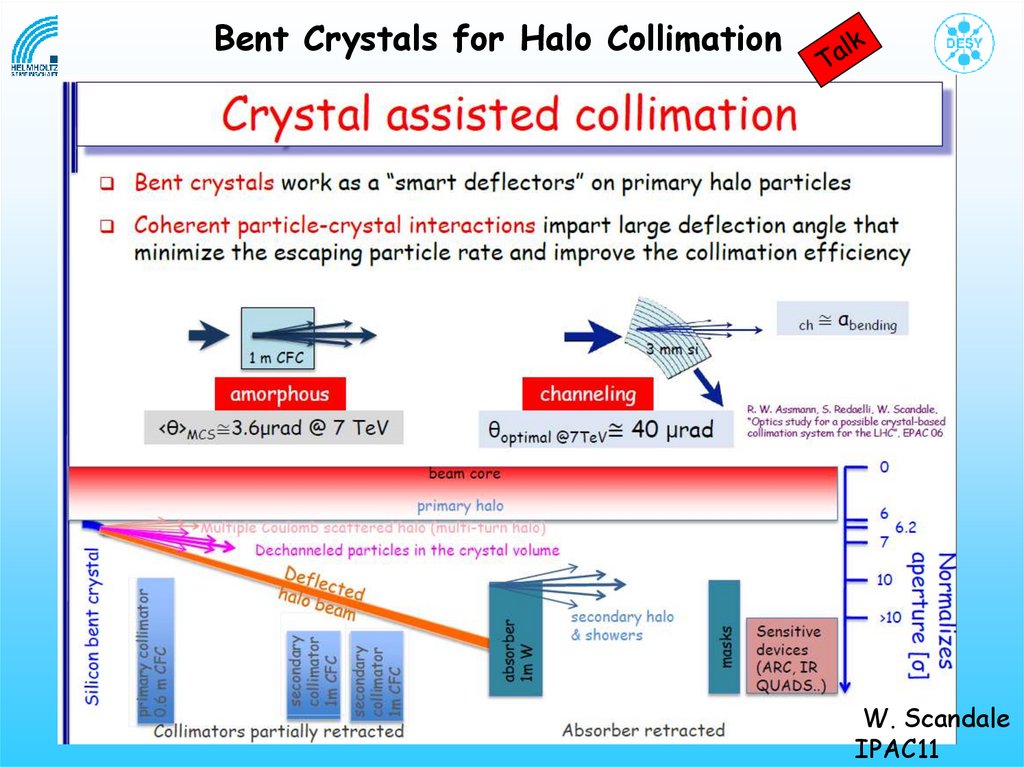
29.
Bent Crystals for Halo CollimationW. Scandale
IPAC11
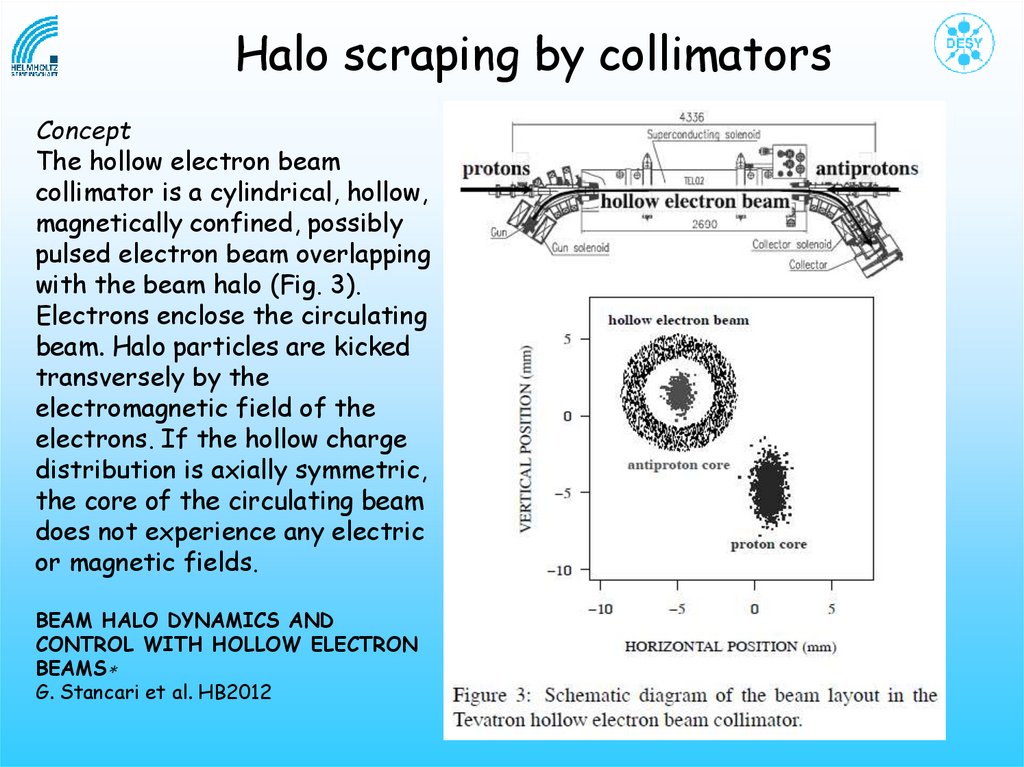
30.
Halo scraping by collimatorsConcept
The hollow electron beam
collimator is a cylindrical, hollow,
magnetically confined, possibly
pulsed electron beam overlapping
with the beam halo (Fig. 3).
Electrons enclose the circulating
beam. Halo particles are kicked
transversely by the
electromagnetic field of the
electrons. If the hollow charge
distribution is axially symmetric,
the core of the circulating beam
does not experience any electric
or magnetic fields.
BEAM HALO DYNAMICS AND
CONTROL WITH HOLLOW ELECTRON
BEAMS∗
G. Stancari et al. HB2012
31.
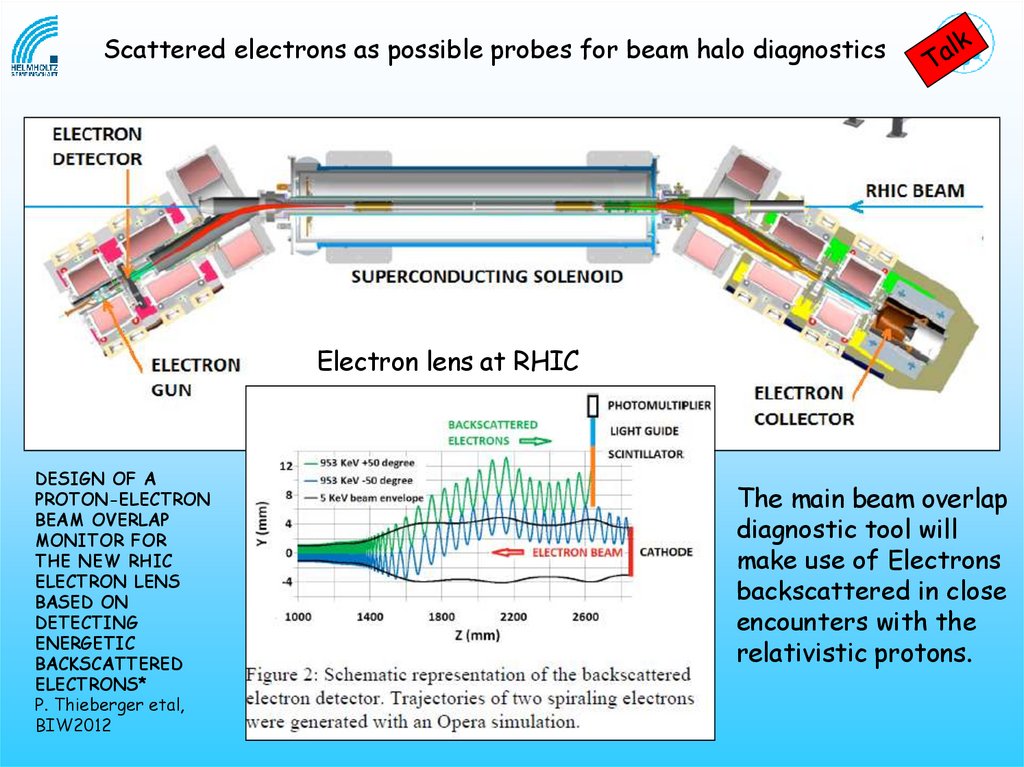
Scattered electrons as possible probes for beam halo diagnosticsElectron lens at RHIC
DESIGN OF A
PROTON-ELECTRON
BEAM OVERLAP
MONITOR FOR
THE NEW RHIC
ELECTRON LENS
BASED ON
DETECTING
ENERGETIC
BACKSCATTERED
ELECTRONS*
P. Thieberger etal,
BIW2012
The main beam overlap
diagnostic tool will
make use of Electrons
backscattered in close
encounters with the
relativistic protons.
32. Beam Gas Vertex monitor (BGV)
• Beam imaging with vertex reconstruction of beam gasinteractions
– Reconstruct the tracks coming from inelastic beam-gas interactions
– Determine the position of the interaction (vertex)
– Accumulate vertices to measure beam position, angle, width and
relative bunch populations
• Main requirements
– Sufficient beam-gas rate → controlled pressure bump
– Good vertex resolution → precise detectors and optimized geometry
33.
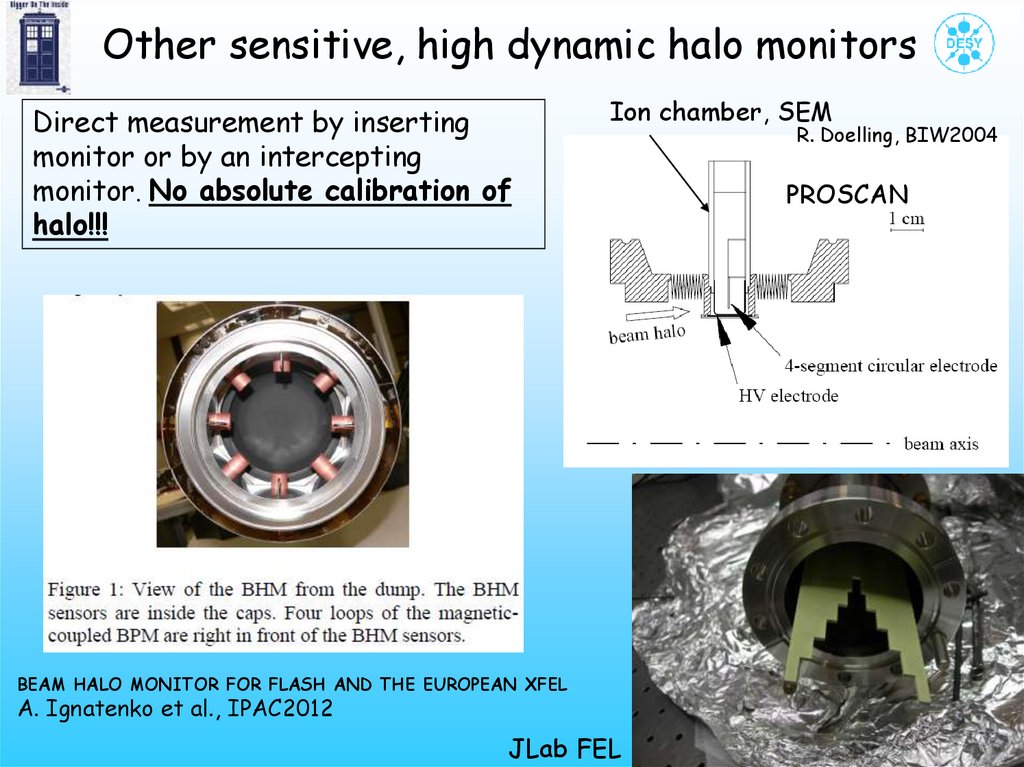
Other sensitive, high dynamic halo monitorsDirect measurement by inserting
monitor or by an intercepting
monitor. No absolute calibration of
halo!!!
Ion chamber, SEM
BEAM HALO MONITOR FOR FLASH AND THE EUROPEAN XFEL
A. Ignatenko et al., IPAC2012
JLab FEL
R. Doelling, BIW2004
PROSCAN
34.
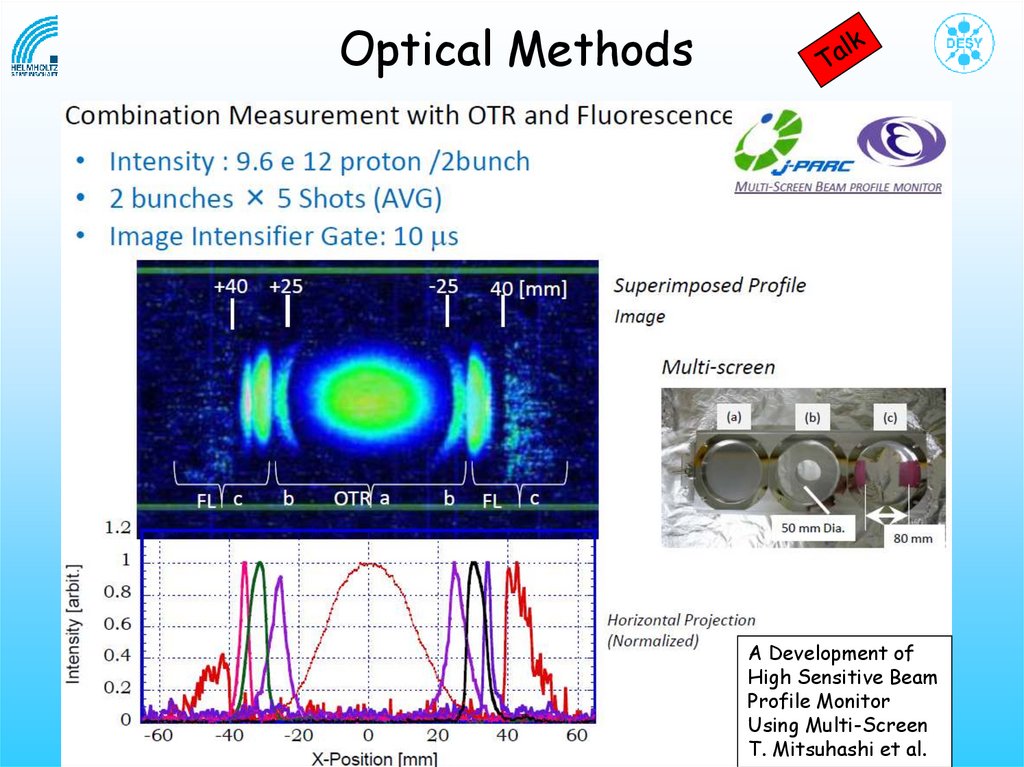
Optical Methods35.
Optical MethodsA Development of
High Sensitive Beam
Profile Monitor
Using Multi-Screen
T. Mitsuhashi et al.
36.
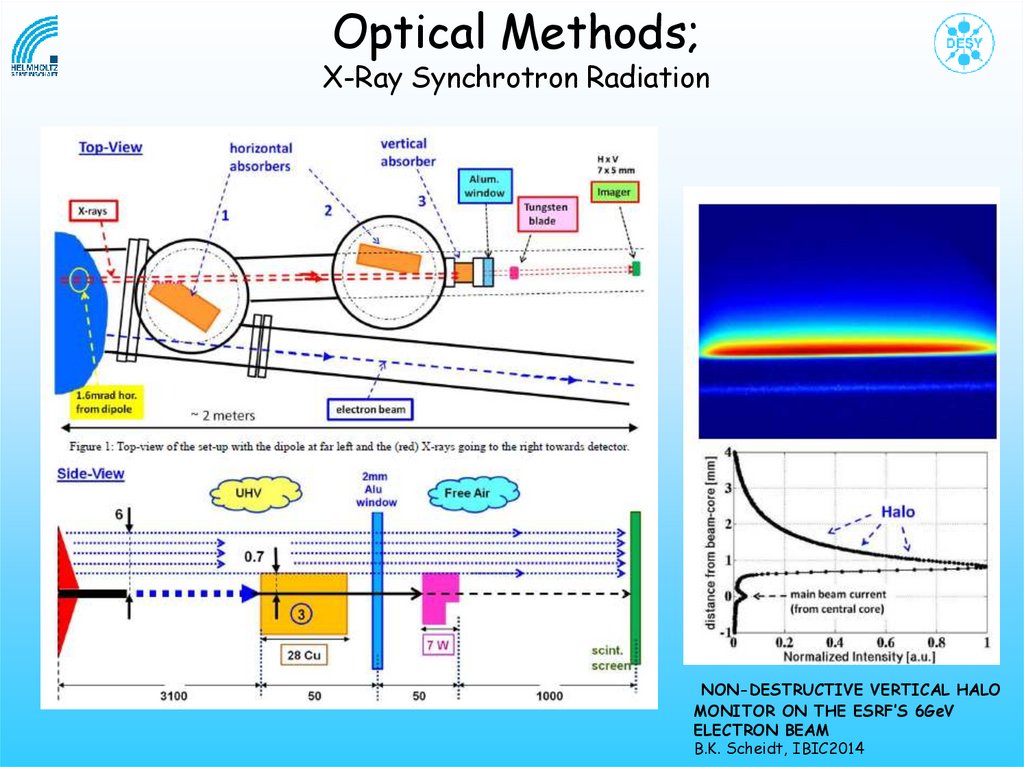
Optical Methods;X-Ray Synchrotron Radiation
NON-DESTRUCTIVE VERTICAL HALO
MONITOR ON THE ESRF’S 6GeV
ELECTRON BEAM
B.K. Scheidt, IBIC2014
37.
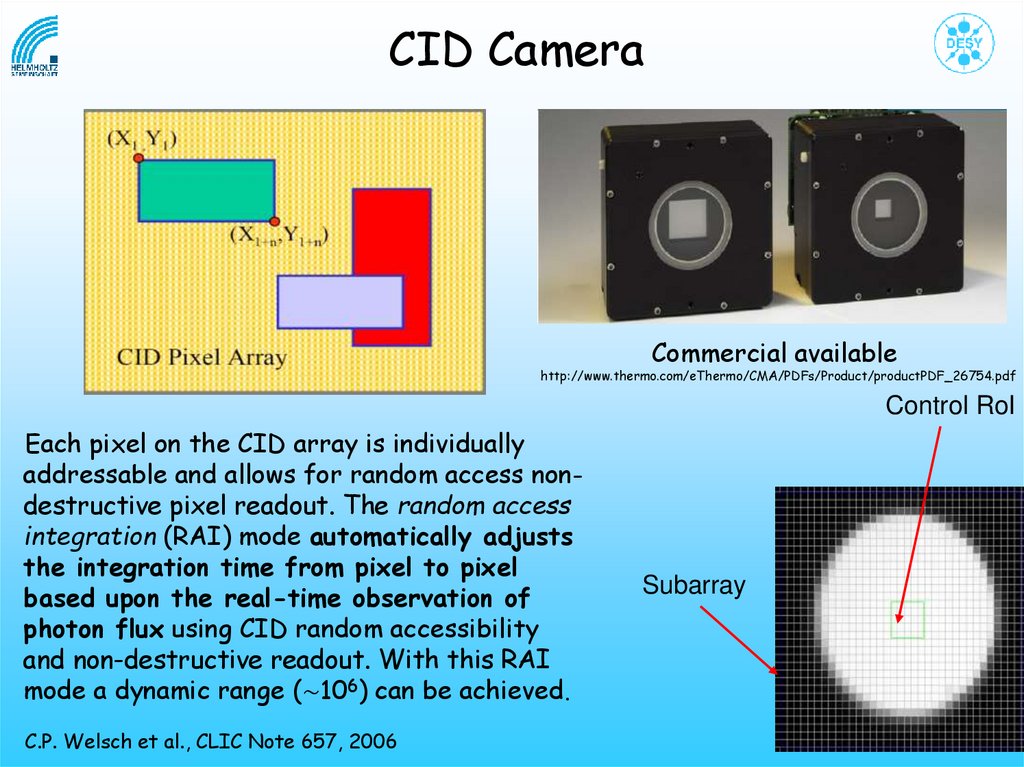
CID CameraCommercial available
http://www.thermo.com/eThermo/CMA/PDFs/Product/productPDF_26754.pdf
Control RoI
Each pixel on the CID array is individually
addressable and allows for random access nondestructive pixel readout. The random access
integration (RAI) mode automatically adjusts
the integration time from pixel to pixel
based upon the real-time observation of
photon flux using CID random accessibility
and non-destructive readout. With this RAI
mode a dynamic range (∼106) can be achieved.
C.P. Welsch et al., CLIC Note 657, 2006
Subarray
38.
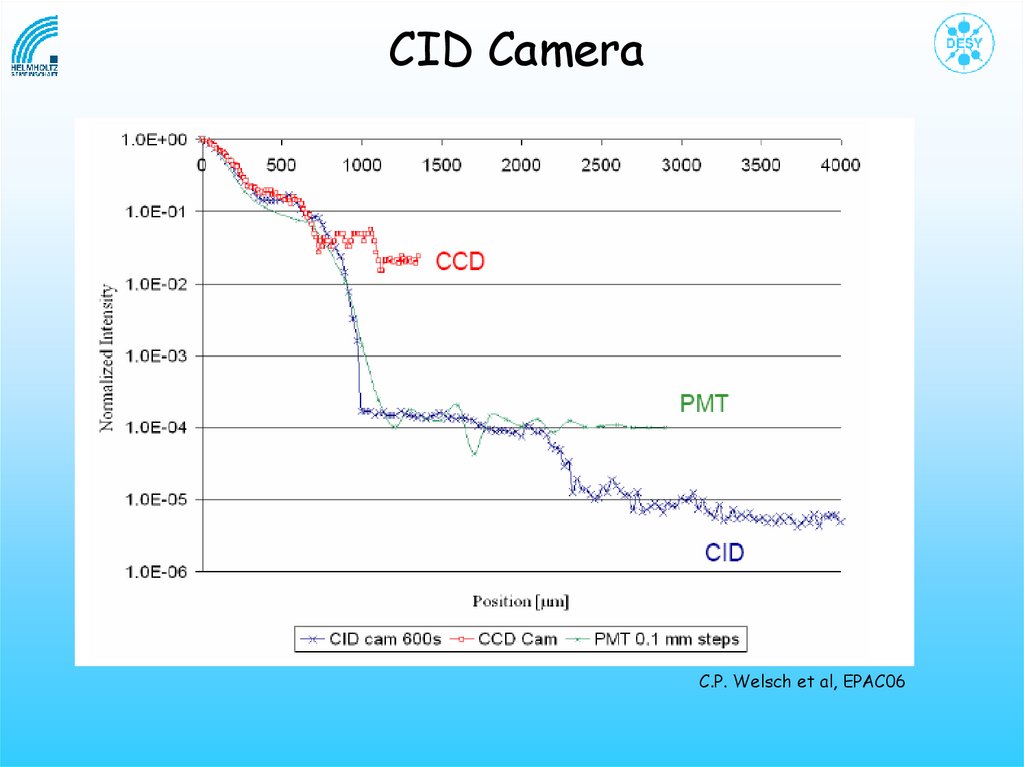
CID CameraC.P. Welsch et al, EPAC06
39.
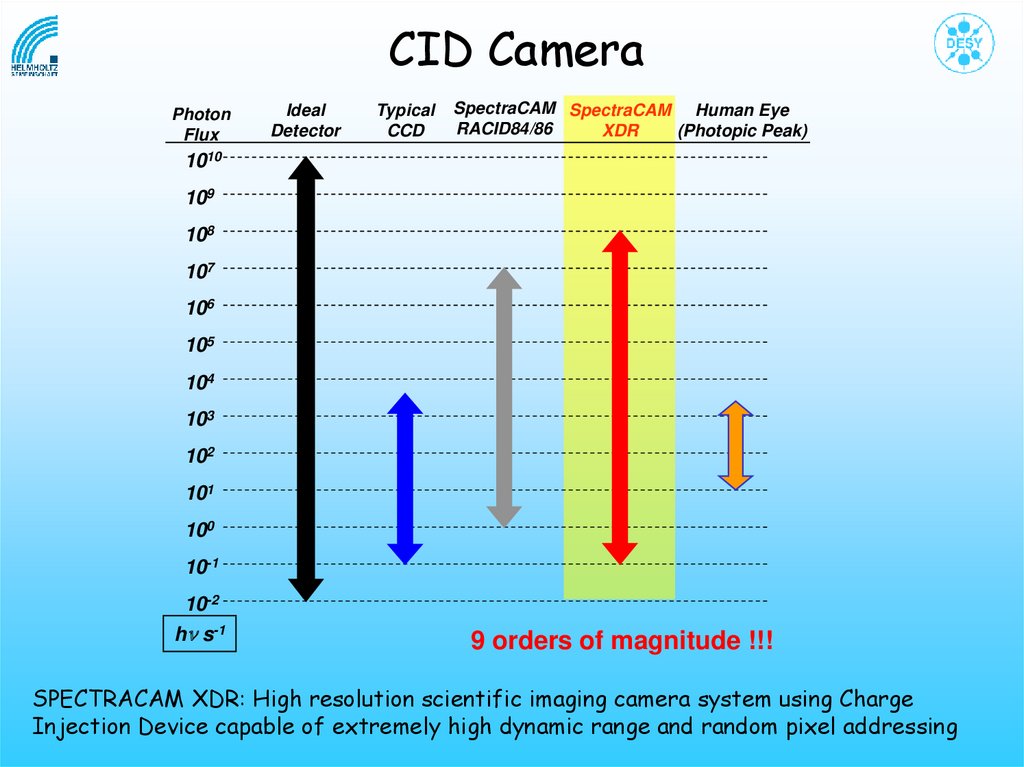
CID CameraPhoton
Flux
Ideal
Detector
Typical
CCD
SpectraCAM SpectraCAM Human Eye
RACID84/86
XDR
(Photopic Peak)
1010
109
108
107
106
105
104
103
102
101
100
10-1
10-2
h s-1
9 orders of magnitude !!!
SPECTRACAM XDR: High resolution scientific imaging camera system using Charge
Injection Device capable of extremely high dynamic range and random pixel addressing
40.
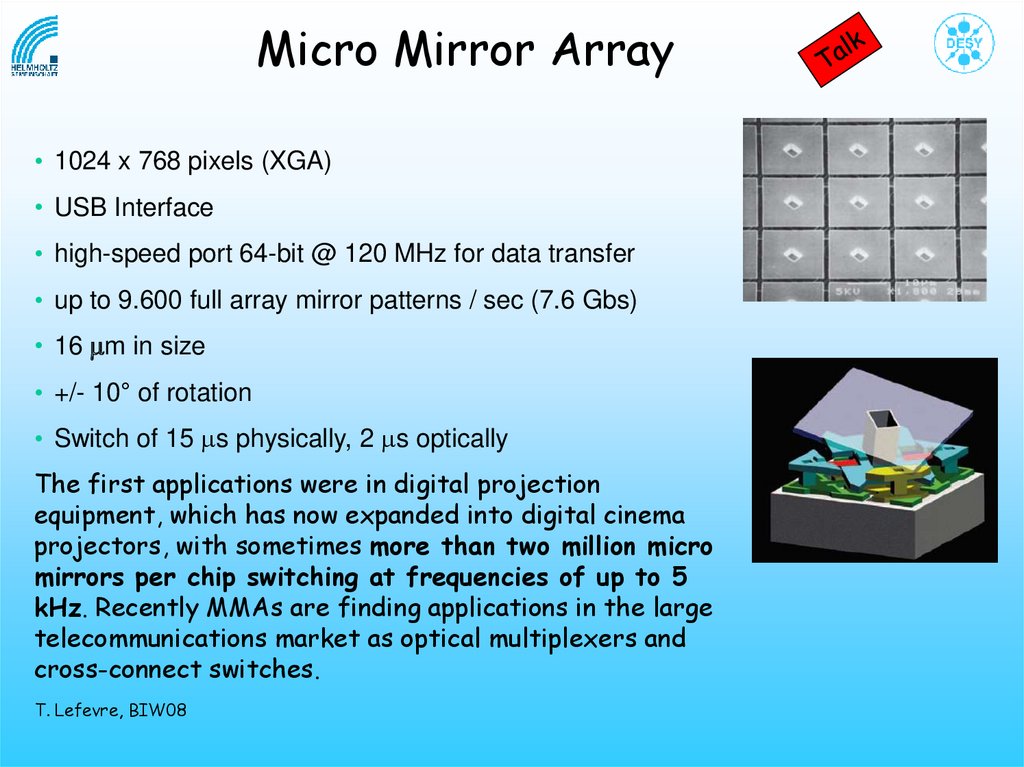
Micro Mirror Array• 1024 x 768 pixels (XGA)
• USB Interface
• high-speed port 64-bit @ 120 MHz for data transfer
• up to 9.600 full array mirror patterns / sec (7.6 Gbs)
• 16 mm in size
• +/- 10° of rotation
• Switch of 15 ms physically, 2 ms optically
The first applications were in digital projection
equipment, which has now expanded into digital cinema
projectors, with sometimes more than two million micro
mirrors per chip switching at frequencies of up to 5
kHz. Recently MMAs are finding applications in the large
telecommunications market as optical multiplexers and
cross-connect switches.
T. Lefevre, BIW08
41.
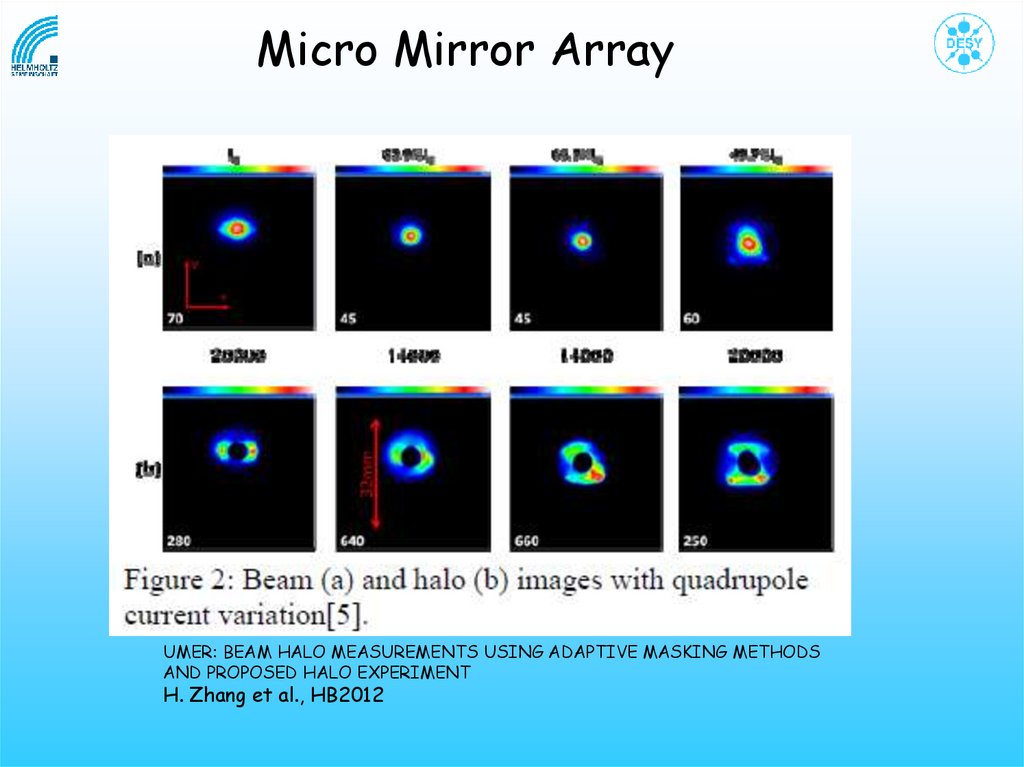
Micro Mirror ArrayUMER: BEAM HALO MEASUREMENTS USING ADAPTIVE MASKING METHODS
AND PROPOSED HALO EXPERIMENT
H. Zhang et al., HB2012
42.
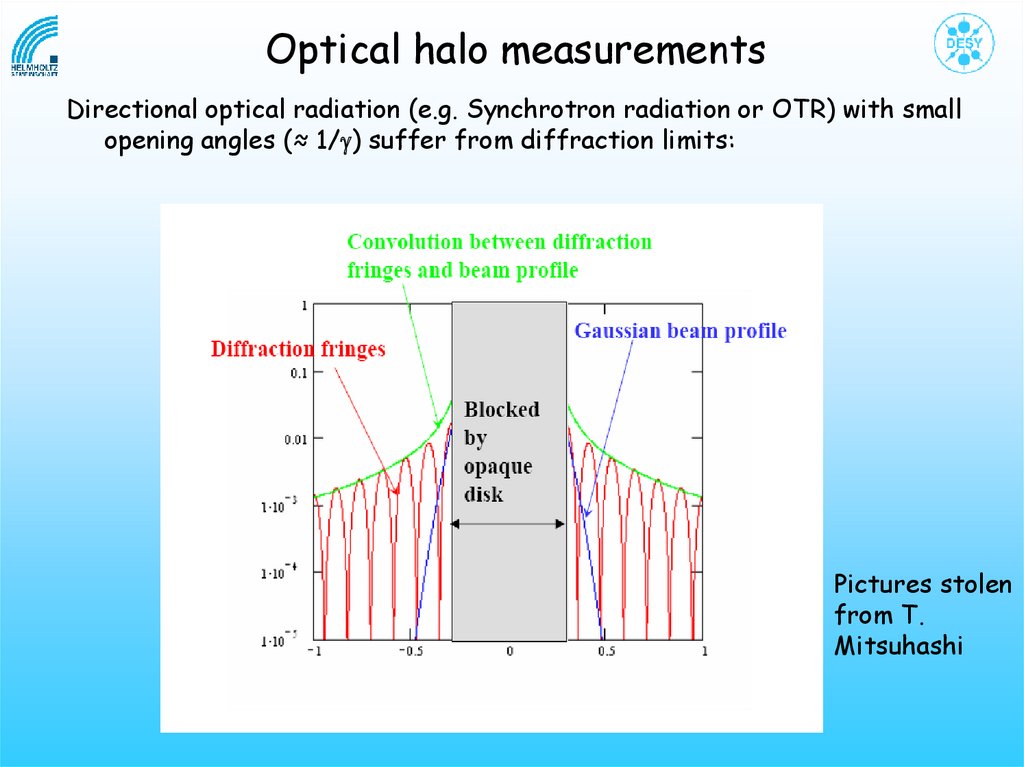
Optical halo measurementsDirectional optical radiation (e.g. Synchrotron radiation or OTR) with small
opening angles (≈ 1/g) suffer from diffraction limits:
Pictures stolen
from T.
Mitsuhashi
43.
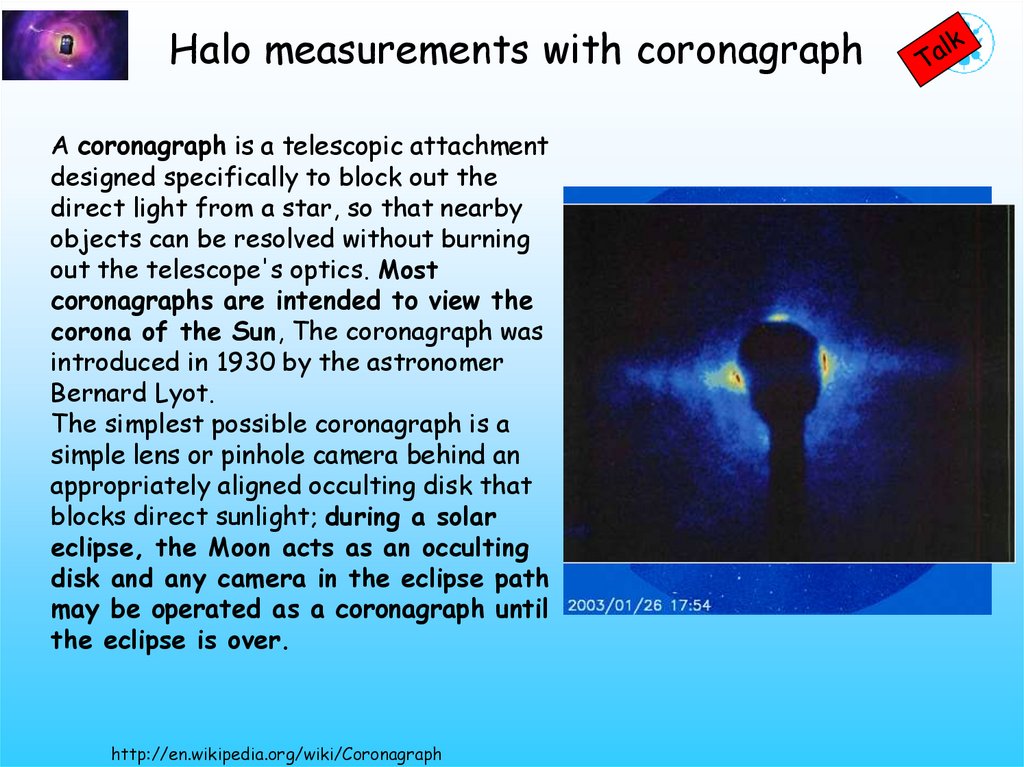
Halo measurements with coronagraphA coronagraph is a telescopic attachment
designed specifically to block out the
direct light from a star, so that nearby
objects can be resolved without burning
out the telescope's optics. Most
coronagraphs are intended to view the
corona of the Sun, The coronagraph was
introduced in 1930 by the astronomer
Bernard Lyot.
The simplest possible coronagraph is a
simple lens or pinhole camera behind an
appropriately aligned occulting disk that
blocks direct sunlight; during a solar
eclipse, the Moon acts as an occulting
disk and any camera in the eclipse path
may be operated as a coronagraph until
the eclipse is over.
http://en.wikipedia.org/wiki/Coronagraph
44.
The Endof the
Introduction
11/20/2018
“Exterminate”
44
45.
Halo MeasurementsTransversal Halo Measurements with:
• Invasive Techniques
• Pavel Evtushenko: Large-Dynamic-Range Beam Profile Measurements with Wire Scanners
• Uli Wienands: Bent Crystals for Halo Collimation
•Toshiyuki Mitsuhashi: A Combination of OTR and Fluorescent Screens for Halo
Measurements
• Optical Methods (fast)
•Jeff Corbett: Digital Micro-Mirror Array for Halo Diagnostics with Synchrotron
Radiation
•Toshiyuki Mitsuhashi: A Coronagraph for Halo Measurements
• Non-Invasive Techniques
• Adam Jeff: Ultra-Thin Gas Jet for Non-Invasive Beam Halo Measurement
• Rhodri Jones: Beam Gas Vertex Detector for Halo measurement in LHC
• Peter Thieberger: Scattered electrons as possible probes for beam halo diagnostics
• Pavel Evtushenko: An Amplitude Apodizer for Large-Dynamic-Range Beam Imaging
• NN: Astronomical Techniques with High Dynamic Range for Coronography and Exoplanet
Imaging