Similar presentations:
Financial Economy
1. Financial Economy
Alexander Didenkoalexander.didenko@gmail.com
en.linkedin.com/cocatebe
2. Course Logic
Stylized Facts &Random Walks
Theory
Birth of Modern
Portfolio Theory
CAPM, APT, SDF
Models for asset
returns
Behavioral
Finance, Rational
Bubbles and
Learning
Derivatives
Pricing
Financial
Economics
Market Efficiency
and Stock
Predictability
Equity Premium
Puzzle
Extreme Value
Theory
Models for
Returns and
Volatility
3. Buzzwords and concepts
Asset class
Super class
Business cycle
Investment style
Active/Passive
Long/Short
Value strategy
Growth strategy
Style box
Indexation
Stratified sampling
Full replication
Index optimization
Types of indices
Index weighting schemes
Equity premium puzzle
Equity premium approach
Gordon Growth
Grinold-Kroner
Beta, adjusted beta
Zinger-Terhaar
Pastor-Stambaugh model
4. The Plan
• What is asset class• Should we add new asset class to existing asset
mix?
• Business Cycle and Asset Classes Returns
• Equities: Modeling Returns and Strategies
• Debts: Strategies
• Labs:
• Asset returns exploratory analysis (at home, 60 min)
• Factor models for asset classes and assets returns
5. Asset classes: examples
Cash and money market instruments
Equities
Debts
Alternatives
– Real Estate
– Commodities
– Gold
– Hedge Funds
– Private Equity
6. Super Asset Classes
• capital assets: claim on the future cash flows of an enterprise– provide a source of ongoing value: quoted/private equity/debts
– may be valued based on the net present value of their expected returns
– alternatives: hedge funds, private equity funds, credit derivatives, and
corporate governance funds
• assets that are used as inputs to creating economic value
– can be consumed as part of the production cycle and converted into another
asset.
– physical commodities: grains, metals, energy products, and livestock
– cannot be valued using a net present value analysis
– important diversification potential
• assets that are a store of value
–
–
–
–
art, wine, antiquities, books - assets that store value
no DCF, no transformation
Its value can be realized only through its sale and transfer of possession
no rational way to gauge whether the price of art will increase or decrease
7. Bonds and Equities
• Bonds and equities are dominating asinvestment assets
• Equities account for biggest part of world
tradable securities portfolio
• That’s why we’ll focus on primarily on
equities, and only then on debts
• We won’t cover alternatives: lack of time
8. Inclusion of new Asset class
Part II.1INCLUSION OF NEW ASSET CLASS
9. Expression for deciding whether to include new asset class in asset mix
If this equation holds, the investor can combine the new investment withhis or her prior holdings to achieve a superior efficient frontier of risky
assets (one in which the tangency portfolio has a higher Sharpe ratio)
10. Tangency portfolio
Notice that the tangency portfolio T is optimal in the sense that it has thehighest possible reward-to-risk ratio, defined as [E(RT) – RF]/σT
11. Asset classes and business cycle
Part II.2ASSET CLASSES AND BUSINESS
CYCLE
12. Attractive Investment Opportunities in Various Business Cycle Stages
13. Key variables to watch cycle
Confidence: business, consumer
GDP
Inflation
Unemployment
Output gap
Treasuries spread
Central bank policy
14. Equities: intro
Part II.3EQUITIES: INTRO
15. Equities generate superior returns in the long run
Wealth multipliers for US Assets and Inflation, Dec’1925-Dec’2005Source: Ibbotson Associates, Stocks, Bonds, Bills, and Inflation, 2006 Year
Book
16. Equities provide astonishing results in the very long run
Wealth multipliers for US Assets and Inflation, Dec’1802-Dec’2005Source: Ibbotson Associates, Stocks, Bonds, Bills, and Inflation, 2006 Year
Book, Jeremy Siegel, Stocks for the long run (New York 2002), Bloomberg
17. Exponential growth of $1 Invested in U.S. Stocks and Bonds on Dec. 31, 1870
Sources: Stocks: Cowles Foundation at Yale University, 1871 19'25; Morningstar (2011) 19262010. Stocks are all NYSE issues (1871-1925), S&P 90 (1926—February 1957), S&P 500 March1957-Treasuly bonds, 1871-99; corporate bonds, 1900-25; Morningstar (2011) long-term
Treasuly bonds, 1926-2010. For 1871-1925, yields reported in Homer (1977) were converted
to total returns assuming a 20-year maturity.
18. Equity premium puzzle
Lack of an explanation generally accepted by economists forthe following situation:
•Much higher returns are achieved by stocks, but investments
are still made in government bonds
•Term coined in Mehra, Prescott, 1985: in order to reconcile
the much higher returns of stocks compared to
government bonds in the United States, individuals must have
implausibly high risk aversion according to standard
economics models
•ERP implied by stock market valuations and forecasts of
earnings in relation to current market value has been
estimated at 3.8%
•In US = 7% per annum over last century; no premium in 19792009
19. US Equity premium using different data sets
Source: Equity premium in retrospect, Mehra, Prescott, 200320. Evolution of the Required Equity Premium (REP) used or recommended in 150 finance and valuation textbooks
Source: Fernández, 201221. Moving average (last 5 years) of the REP used or recommended in 150 finance and valuation textbooks
Source: Fernández, 201222. The term EP is used to designate 4 different concepts
• Historical equity premium (HEP): historical differentialreturn of the stock market over treasuries.
• Expected equity premium (EEP): expected differential
return of the stock market over treasuries.
• Required equity premium (REP): incremental return of
a diversified portfolio (the market) over the risk-free
rate required by an investor. It is used for calculating
the required return to equity.
• Implied equity premium (IEP): the required equity
premium that arises from assuming that the market
price is correct.
23. Market Risk Premium for the USA used in 2011
Source: Fernández, 201224. Are equities really profitable?
Survivorship bias: did you know in advance that UK and US wouldsucceed?
25. Share of equities in market capitalization of investment universe consisting 7 major asset classes
Source: Mikaelyan (2012)Even in spite of many controversies, equities were – and are – one of 2
major investment asset classes in the world
26. Equity Allocations for Institutional Investors
Source: Greenwich Associates, 2003.For many investors hierarchy of questions when managing portfolio looks as follows
how many of the portfolio to invest in equities
how to distribute equities part of the portfolio
27. Equities as instrument in PM
- inflation hedge — an asset is IH if its returnsare able to reserve purchaising power during
periods of inflation
- earnings tend to positively correlate with inflation
- companies high historical LT real rates of return
- diversification benefits
- one of the most widespread and capitalized
assets in the world
28. Approaches to Equity Inv.
• passive management: after costs the return on theaverage actively managed dollar should be less than
on passive managed
– Indexing
– dropped/added from/to index, SPO, buyback
• active management (historically — the principal way)
— market offer opportunities to beat the benchmark
• semiactive management/enhanced indexing —
markets offer opportunities to achieve a positive
information ratio with limited risk relative to
benchmark
29. Definitions
• active return — portfolio's return in excess ofthe benchmark portfolio
• active risk — risk relative to the portfolio
benchmark
• tracking risk — measure of active risk,
annualized StdDev of active returns
• information rate — efficiency with which
portfolio is managed;
MeanActiveR/TrackingRisk
30. Returns
• succesfull active manager will have expectedactive return of 2+%, but tracking error is
likely to be 4+%; IR is 0,5 or lower;
• opposite side of spectrum is index fund: 0%
active return, IR 0%.
• enhanced indexing: IR 0,5 to 2,0
31. Example
The table below shows the active return of anequity portfolio. Calculate the portfolio’s
tracking risk for the six-period time frame.
32. Solution
33. Passive Equity Investing
• simple indexing– types of indices: price weighted, value weighted,
equal weighted
– major indices
– problem of correct benchmark
passive investing vehicles
–
–
–
–
indexed portfolios
ETF
equity index futures
equity total return swap
34. What makes a good index?
• It must provide some useful informationabout the market that is not already available
from existing indices.
• It must use logical stock selection criteria and
an intuitive weighting scheme such that the
index level has some significance.
• If the goal of the index is to promote trading in
related products it must be replicable.
35. Why make an index?
• considerable research needed, what’s the benefit?• some sell-side institutions develop indices as a part of
their research product, and are compensated through
commission revenue from clients in related derivatives
• Investment companies that wish to offer funds tracking
the index or broker-dealers that want to use the index
as the basis for derivative products must pay a
licensing fee to the index provider for permission to
reference the name of the index in their products
36. Weighting shemes
Price-weighted
Volume-weighted
Cap-weighted / modified cap (MICEX)
Free-float weighted
Equal (dollar) – weighted / modified
Other (ex. - share of earnings coming from
China)
37. Types of indices
• Broad market– Total market
– Cap range
Sector indices
Geographic
Markets: advanced/emerging/frontier
Exchange
Concept based
–
–
–
–
Style: value/growth/core
Economic sensitivity: cyclical/defensive
Fundamental factors: Div. yield/PE ratio/etc.
Thematic: “green”/Shariah/etc.
38. Implementing an indexing strategy
• Indexed separate or pooled accounts– Low cost
• index mutual funds
– widely accessible alternative with a considerable range of cost
structures
• exchange-traded funds
– structural advantages compared with mutual funds
– permit short positions
• equity index futures
– relatively low-cost vehicles for obtaining equity market exposure that
require a rollover to maintain longer term
• equity total return swaps
– relatively low-cost way to obtain long-term exposure to an equity
market that may offer tax advantages
39. 3 methods of indexation
• full replication– Every index security is held with approximately the
same weight as in benchmark index
• stratified sampling
– samples from the index from the index securities
organised into representative cells
• optimization
– Choosing a portfolio that minimizes expected
tracking risk to index based on multifactor model of
index risk exposures
40. Active Equity Investing
• equity styles– Value vs. Growth vs. Market oriented
– Style index
41. Main types of active strategies
• Value,– value investors are more concerned about buying a stock that is deemed
relatively cheap in terms of the purchase price of earnings or assets than
about the company’s future growth prospects.
• low price-to-earnings ratio (P/E),
• contrarian, and
• high yield.
• Growth,
– growth investors are more concerned with earnings growth.
• consistent growth and
• earnings momentum
Market-oriented
Socially responsible investing
Long/short investing
Sell disciplines/trading
42. Value investing
• buying a stock that is deemed relativelycheap in terms of the purchase price of
earnings or assets than about the company's
future growth prospects
• substyles: low P/E, contrarian, high yield
• misinterpretation the stock's cheapness
43. P/E ratios as a predictor of twenty-year returns
Source: Robert Shiller, Irrational ExhuberanceThe horizontal axis shows inflation adjusted price divided by the prior
ten-year mean of inflation-adjusted earnings. The vertical axis shows the
geometric average real annual return on investing in the S&P Composite
Stock Price Index, reinvesting dividends, and selling twenty years later.
44. Growth investing
• value investors are focusing on price; growthinvestors are focusing on earnings growth
rate
• substyles: consistent growth, earnings
momentum
• major risk: fwdEPS fails to materialize
45. Morningstar Equity Style Box
46. Risk/return of Morningstar style indices 2003-2010
Risk/return of Morningstar style indices 20032010Source: Morningstar
What’s the sense in Large Core and Value?
47. Flaws of indexation
• Several researchers criticize fundamentalindexation on both theoretical and empirical
grounds
• Collared weighting (Arya, Kaplan 2008) –
hybrid weighting technique: most of the
portfolio is weighted by market value; only
stocks with outlying valuation ratios (high and
low) subject to fundamental weighting
48. Risks of value/growth
• The main risk for a value investor is the potential formisinterpreting a stock’s cheapness;
– it may be cheap for a very good economic reason that the
investor does not fully appreciate.
• The major risk for growth investors is that the
forecasted earnings per share (EPS) growth fails to
materialize as expected.
– In that event, P/E multiples may contract at the same time
as EPS, amplifying the investor’s losses.
49. Long/short strategies
• long-only strategy can capture one overall alpha.• in long–short strategy the value added can be equal
to two alphas, one from the long position and one
from the short position.
• A market-neutral strategy is constructed to have an
overall zero beta.
• Long–short strategies may benefit from pricing
inefficiencies on the short side (a greater supply of
overvalued than undervalued securities).
50. Equities: return models
Part II.4EQUITIES: RETURN MODELS
51. Models of equity return
Historical Estimates
premium approach,
DCF,
Gordon growth,
Grinold-Kroner,
Singer-Terhaar,
Pastor-Stambaugh
Barra model
52. Historical estimates: geometric mean
• focus of MVO (Markowiyz, 1952): tradeoff between StdDevand expected return
• many investors are unfamiliar with the concept of expected
return as used by Markowitz and confuse it with geometric
mean
• in Markowitz's investment model, the expected return is
the relevant measure of investors reward
• for long-term investors, however, what matters is the longterm rate of portfolio growth, or the geometric mean
• that concepts are not related: difference between expected
return and geometric mean increases with return volatility
• for bonds geometric mean is a good approximation of
return volatility, for emerging equity - not
53. Geometric mean and StdDev
54. Example
DCF• You all know it very well, don’t you?
55. DCF
Historical Premium Approach56. Historical Premium Approach
Supply-side premium57. Supply-side premium
Gordon Model58. Gordon Model
Growth rate• Expected Real GDP + expected inflation
• Sometimes: + excess corporate growth (some
sectors)
59. Growth rate
Grinold-Kroner Model• In the United States and other major markets,
share repurchases have become an important
means for companies to distribute cash to
shareholders.
60. Grinold-Kroner Model
Example61. Example
CaseAn Australian investor currently holds an A$240 million equity portfolio. He is considering rebalancing
the portfolio based on an assessment of the risk and return prospects facing the Australian economy.
Information pertaining to the Australian investment markets and the economy has been collected in the
following table:
•Historical equity risk premium is (use bond yield-equity premium approach)
A. 0,44% B: 0,7% C. 11,3% D.13,9%
•Expected return using Grinold-Kroner model (assume no change in shares outstanding):
A.5,80% B.6,42% C. 6,55% D. 6,75%
•Using answer from previous question, expected equity risk premium is
A.0,95% B.0,96% C. 1,15% D.0,2%
62. Case
Answer63. Answer
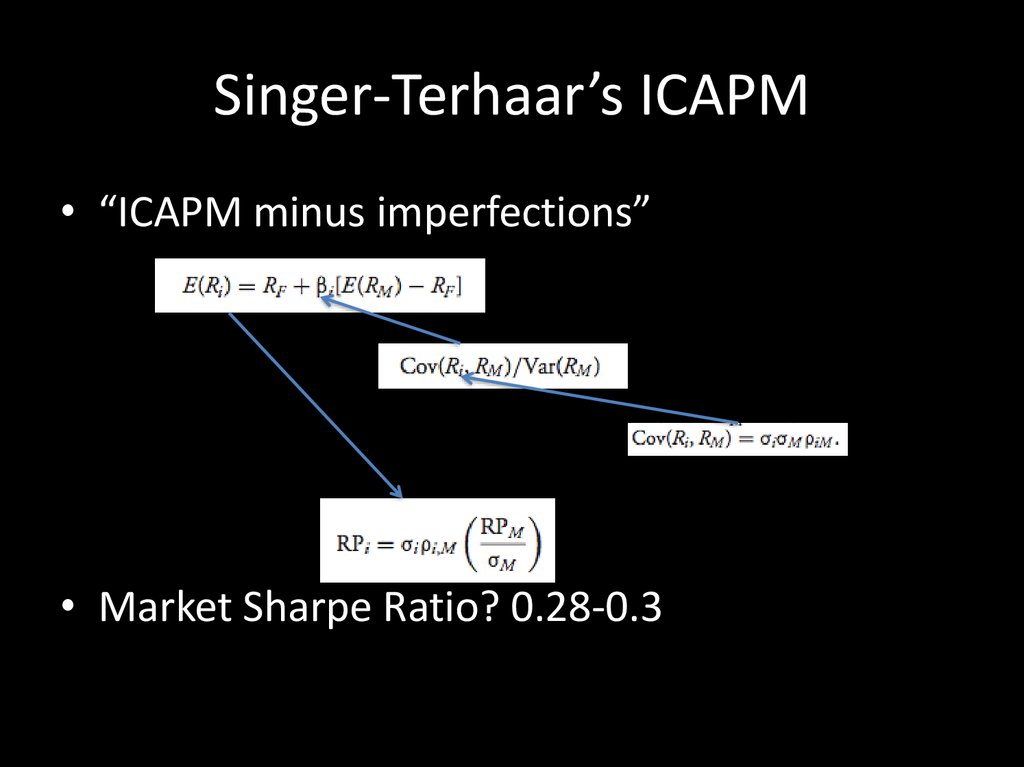
Singer-Terhaar’s ICAPM• “ICAPM minus imperfections”
• Market Sharpe Ratio? 0.28-0.3
64. Singer-Terhaar’s ICAPM
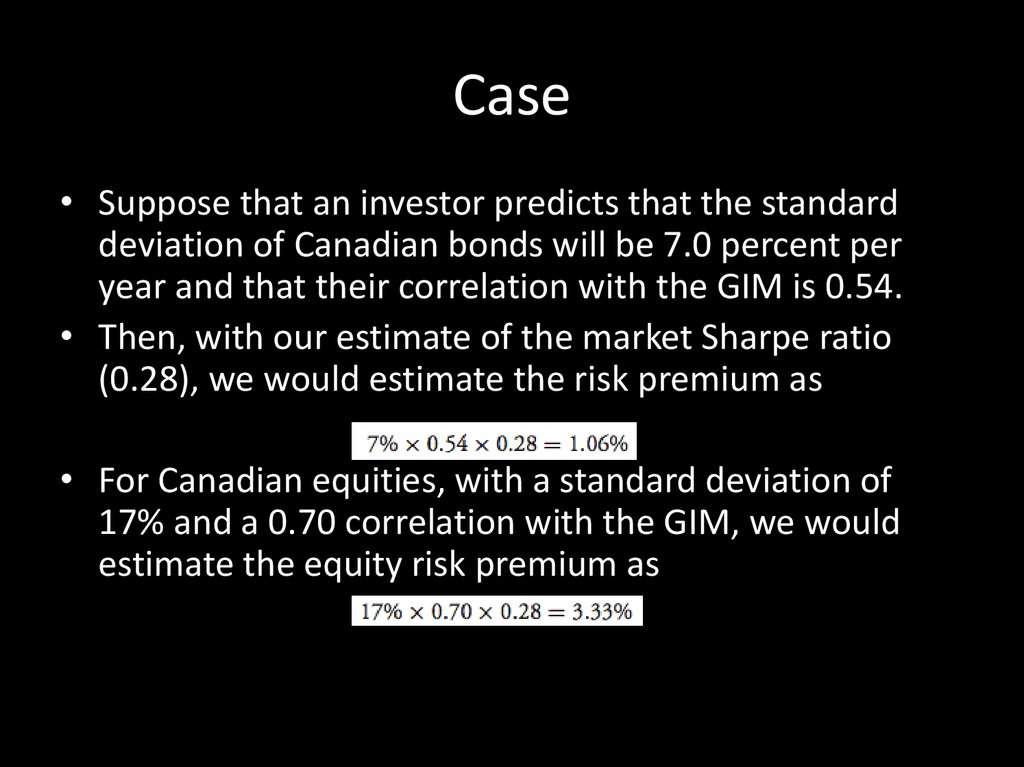
Case• Suppose that an investor predicts that the standard
deviation of Canadian bonds will be 7.0 percent per
year and that their correlation with the GIM is 0.54.
• Then, with our estimate of the market Sharpe ratio
(0.28), we would estimate the risk premium as
• For Canadian equities, with a standard deviation of
17% and a 0.70 correlation with the GIM, we would
estimate the equity risk premium as
65. Case
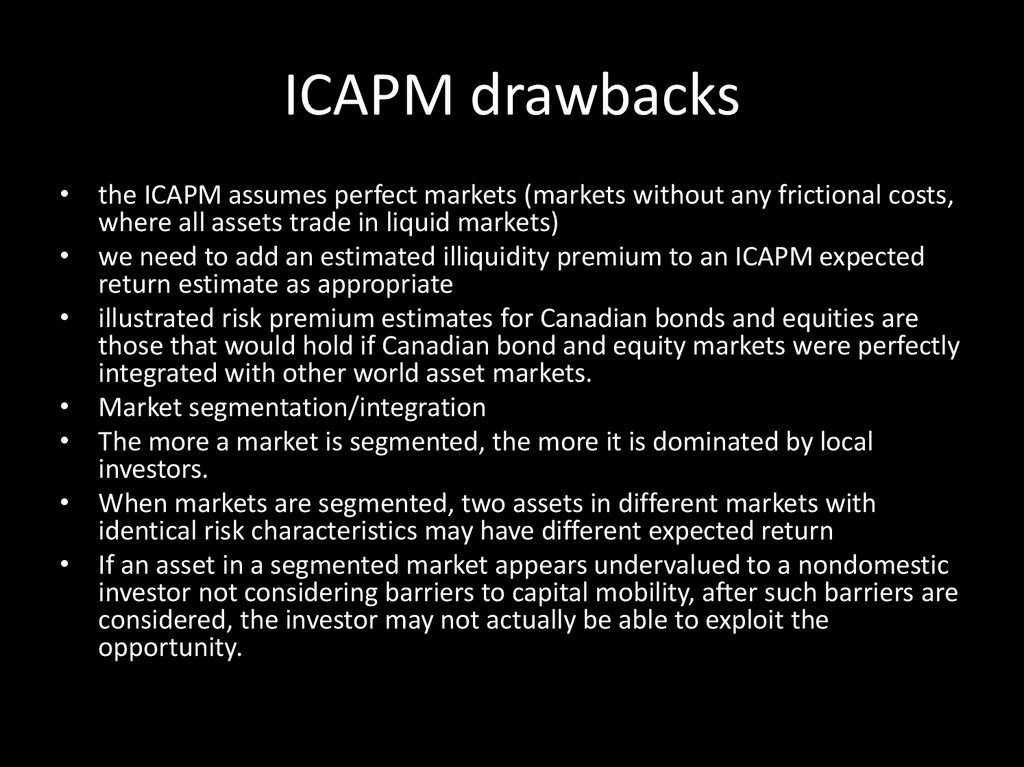
ICAPM drawbacks• the ICAPM assumes perfect markets (markets without any frictional costs,
where all assets trade in liquid markets)
• we need to add an estimated illiquidity premium to an ICAPM expected
return estimate as appropriate
• illustrated risk premium estimates for Canadian bonds and equities are
those that would hold if Canadian bond and equity markets were perfectly
integrated with other world asset markets.
• Market segmentation/integration
• The more a market is segmented, the more it is dominated by local
investors.
• When markets are segmented, two assets in different markets with
identical risk characteristics may have different expected return
• If an asset in a segmented market appears undervalued to a nondomestic
investor not considering barriers to capital mobility, after such barriers are
considered, the investor may not actually be able to exploit the
opportunity.
66. ICAPM drawbacks
Adjustments to ICAPM• Most markets lie between the extremes of perfect market
integration and complete market segmentation.
• We need first to develop an estimate of the risk premium
for the case of complete market segmentation.
• With such an estimate in hand, the estimate of the risk
premium for the common case of partial segmentation is
just a weighted average of the risk premium assuming
perfect market integration and the risk premium assuming
complete segmentation, where the weights reflect the
analyst’s view of the degree of integration of the given
asset market.
• We already have premiums for complete integration case,
1,06% and 3,33%
67. Adjustments to ICAPM
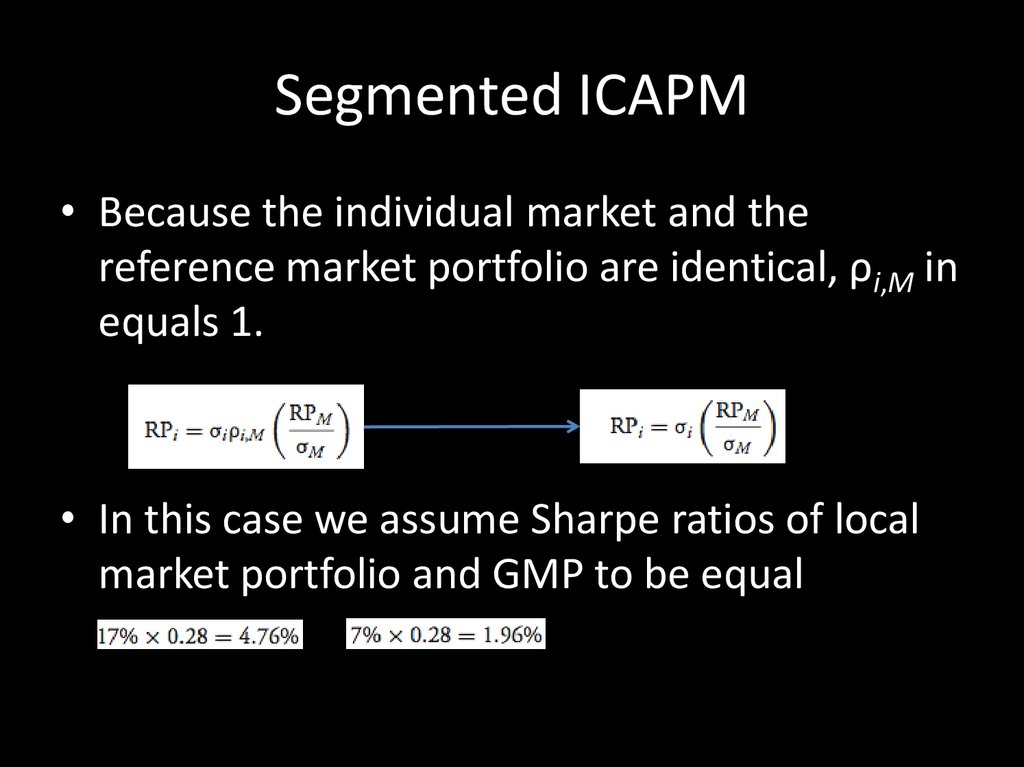
Segmented ICAPM• Because the individual market and the
reference market portfolio are identical, ρi,M in
equals 1.
• In this case we assume Sharpe ratios of local
market portfolio and GMP to be equal
68. Segmented ICAPM
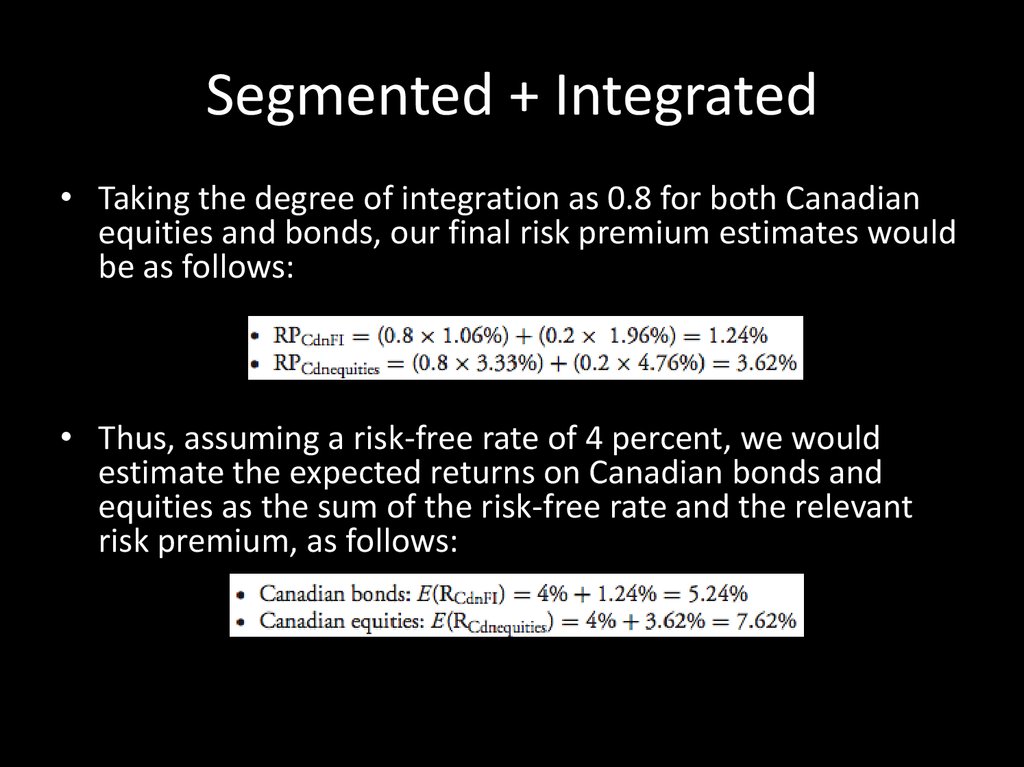
Segmented + Integrated• Taking the degree of integration as 0.8 for both Canadian
equities and bonds, our final risk premium estimates would
be as follows:
• Thus, assuming a risk-free rate of 4 percent, we would
estimate the expected returns on Canadian bonds and
equities as the sum of the risk-free rate and the relevant
risk premium, as follows:
69. Segmented + Integrated
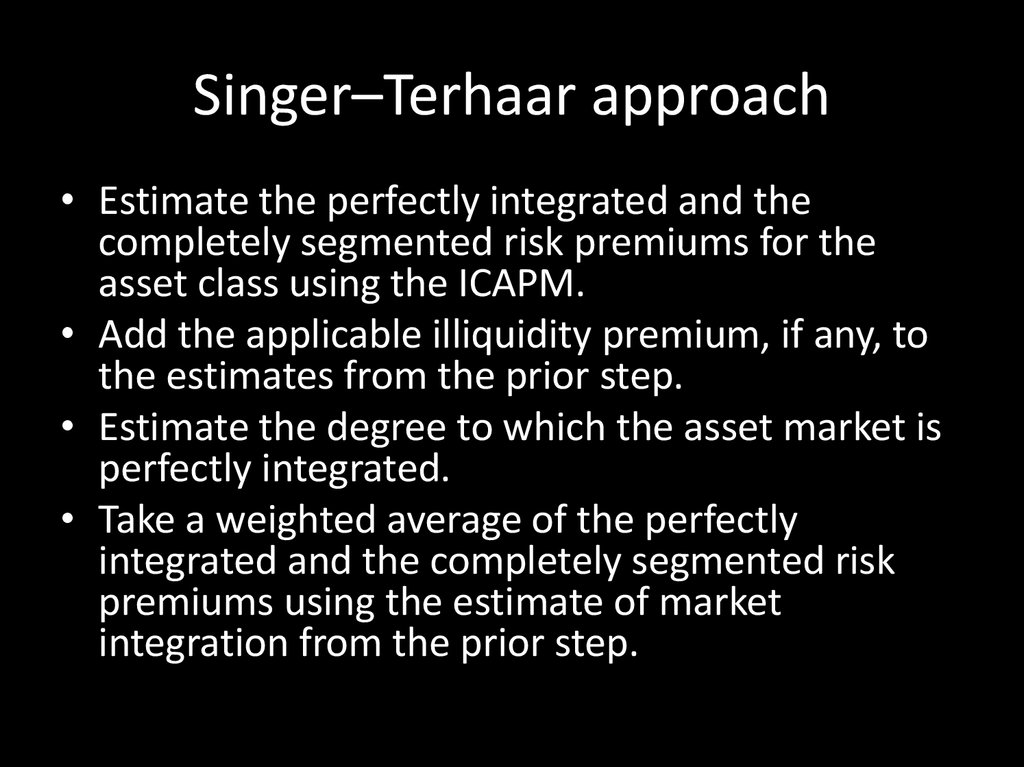
Singer–Terhaar approach• Estimate the perfectly integrated and the
completely segmented risk premiums for the
asset class using the ICAPM.
• Add the applicable illiquidity premium, if any, to
the estimates from the prior step.
• Estimate the degree to which the asset market is
perfectly integrated.
• Take a weighted average of the perfectly
integrated and the completely segmented risk
premiums using the estimate of market
integration from the prior step.
70. Singer–Terhaar approach
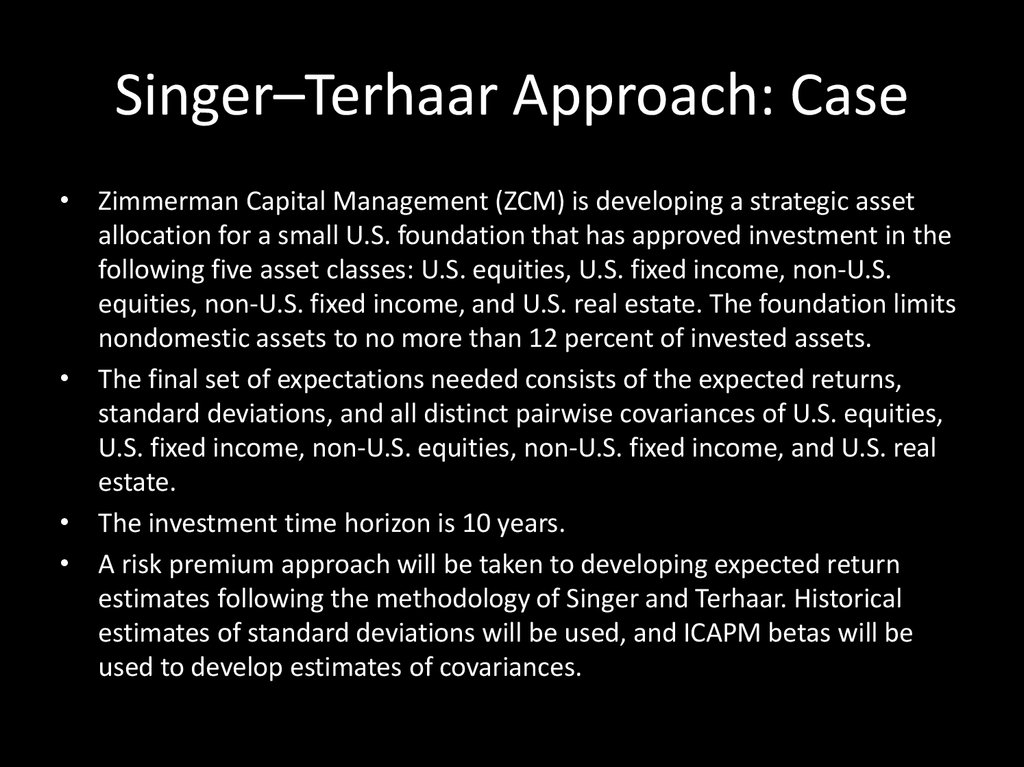
Singer–Terhaar Approach: Case• Zimmerman Capital Management (ZCM) is developing a strategic asset
allocation for a small U.S. foundation that has approved investment in the
following five asset classes: U.S. equities, U.S. fixed income, non-U.S.
equities, non-U.S. fixed income, and U.S. real estate. The foundation limits
nondomestic assets to no more than 12 percent of invested assets.
• The final set of expectations needed consists of the expected returns,
standard deviations, and all distinct pairwise covariances of U.S. equities,
U.S. fixed income, non-U.S. equities, non-U.S. fixed income, and U.S. real
estate.
• The investment time horizon is 10 years.
• A risk premium approach will be taken to developing expected return
estimates following the methodology of Singer and Terhaar. Historical
estimates of standard deviations will be used, and ICAPM betas will be
used to develop estimates of covariances.
71. Singer–Terhaar Approach: Case
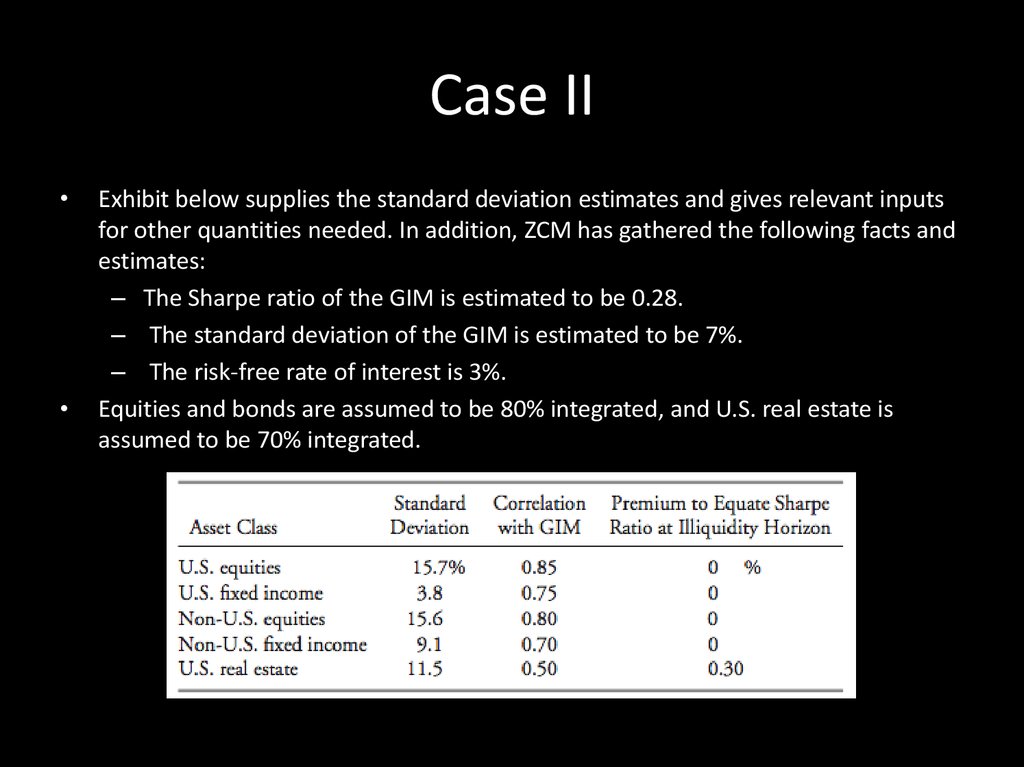
Case IIExhibit below supplies the standard deviation estimates and gives relevant inputs
for other quantities needed. In addition, ZCM has gathered the following facts and
estimates:
– The Sharpe ratio of the GIM is estimated to be 0.28.
– The standard deviation of the GIM is estimated to be 7%.
– The risk-free rate of interest is 3%.
Equities and bonds are assumed to be 80% integrated, and U.S. real estate is
assumed to be 70% integrated.
72. Case II
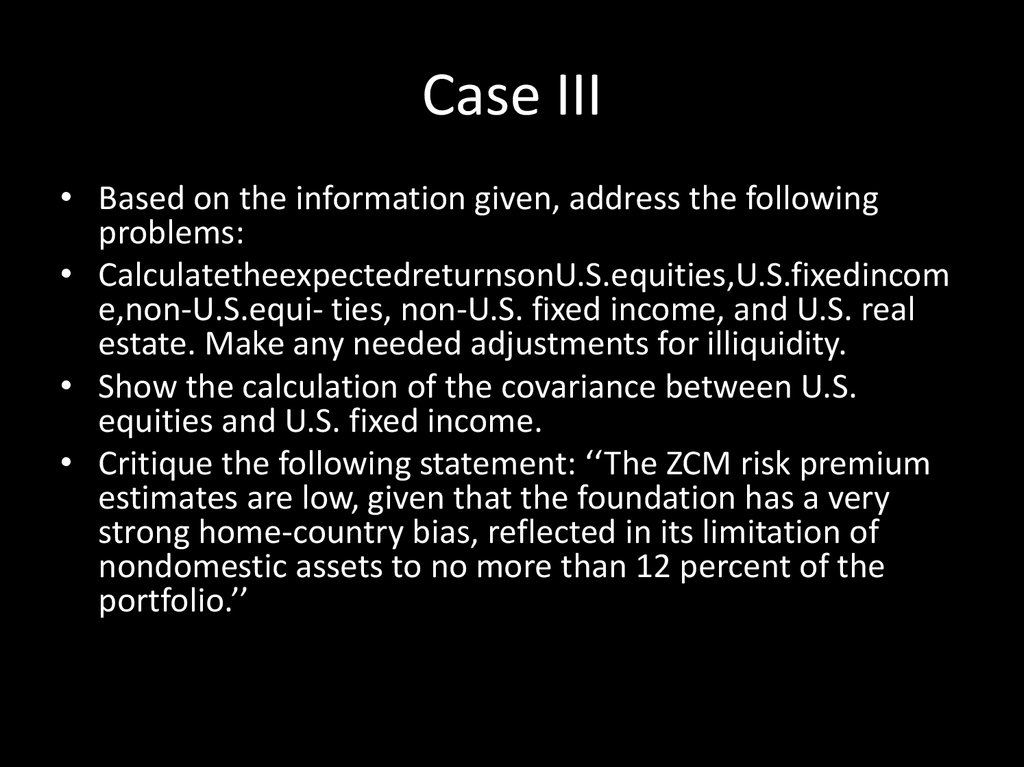
Case III• Based on the information given, address the following
problems:
• CalculatetheexpectedreturnsonU.S.equities,U.S.fixedincom
e,non-U.S.equi- ties, non-U.S. fixed income, and U.S. real
estate. Make any needed adjustments for illiquidity.
• Show the calculation of the covariance between U.S.
equities and U.S. fixed income.
• Critique the following statement: ‘‘The ZCM risk premium
estimates are low, given that the foundation has a very
strong home-country bias, reflected in its limitation of
nondomestic assets to no more than 12 percent of the
portfolio.’’
73. Case III
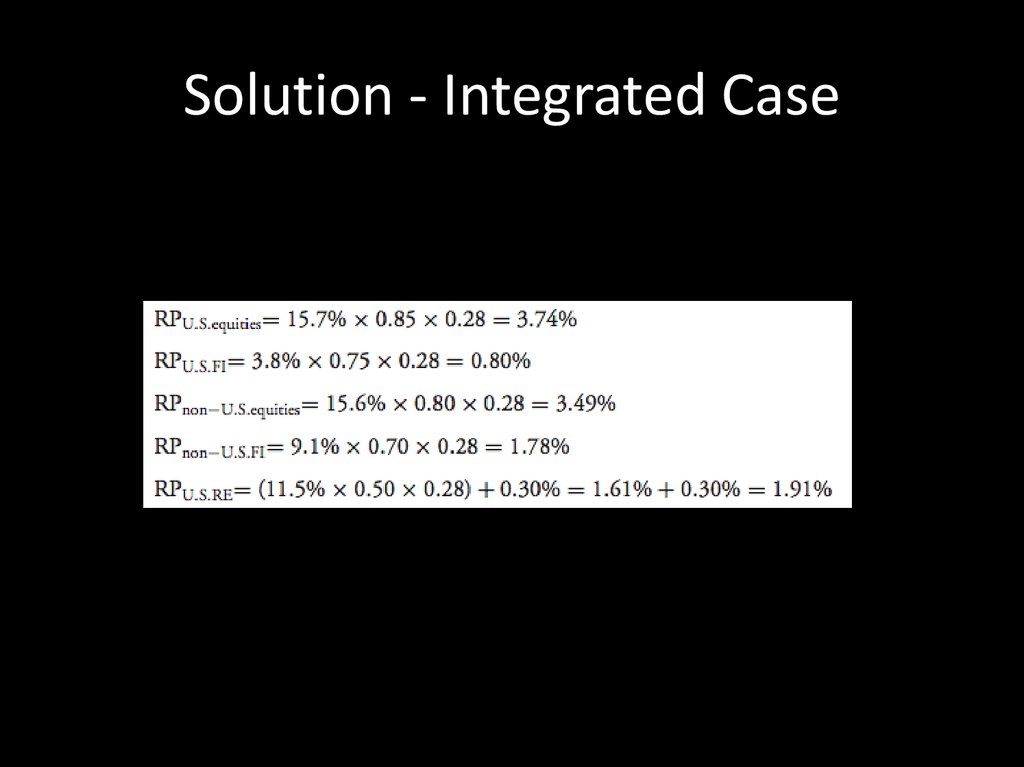
Solution - Integrated Case74. Solution - Integrated Case
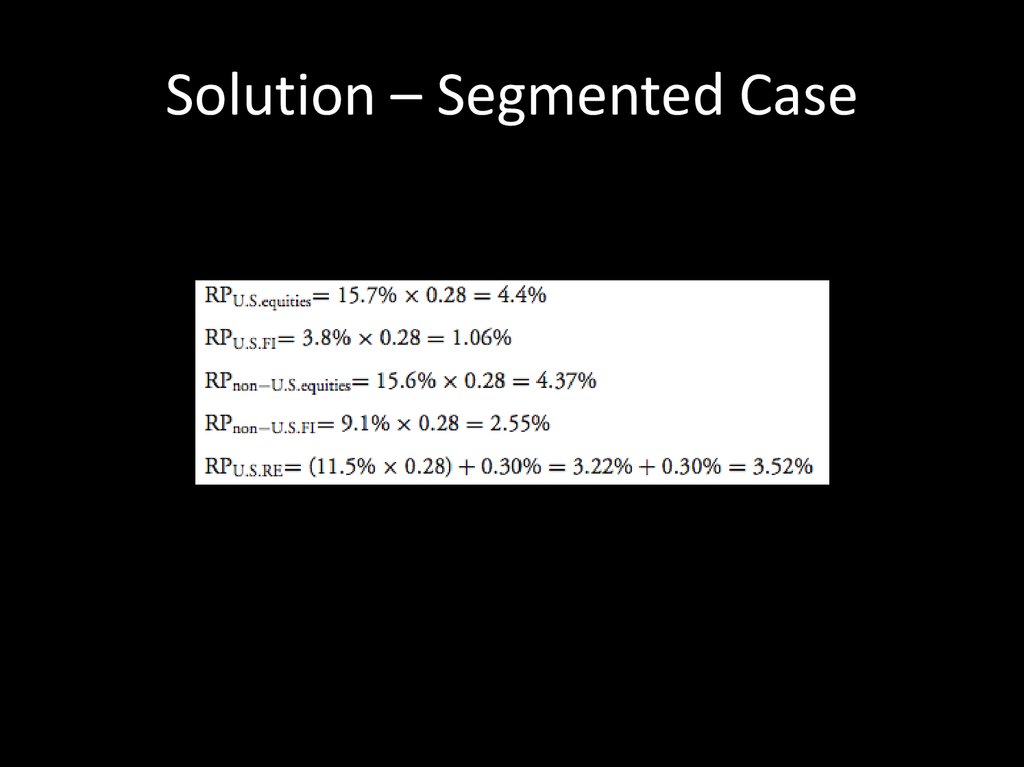
Solution – Segmented Case75. Solution – Segmented Case
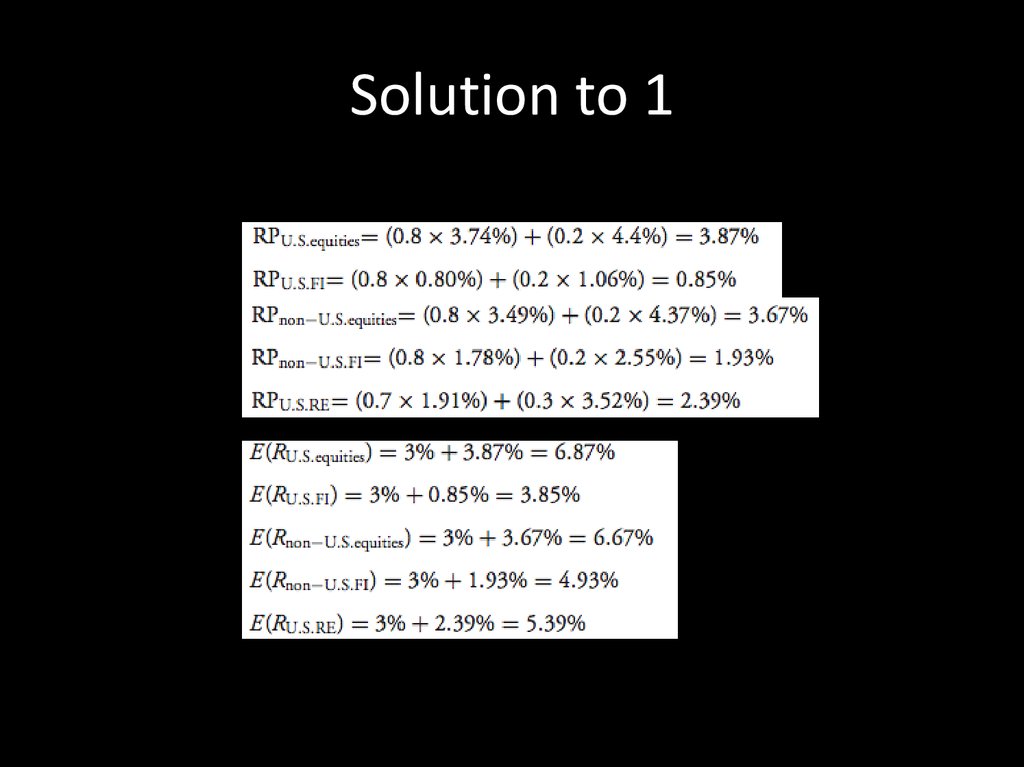
Solution to 176. Solution to 1
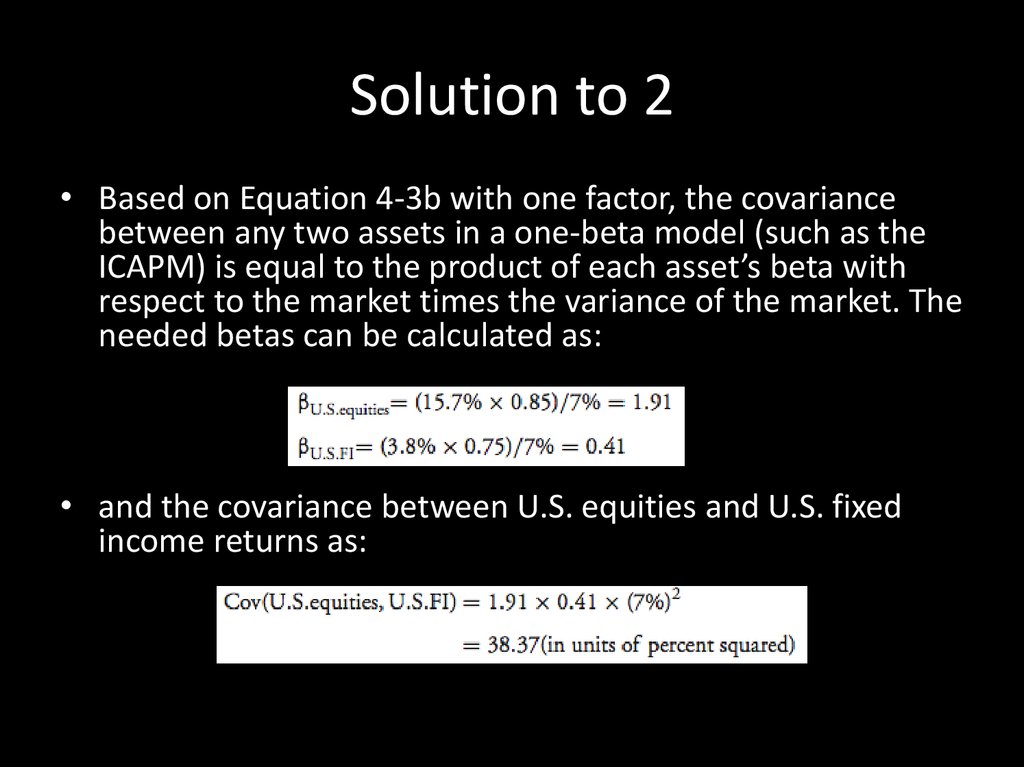
Solution to 2• Based on Equation 4-3b with one factor, the covariance
between any two assets in a one-beta model (such as the
ICAPM) is equal to the product of each asset’s beta with
respect to the market times the variance of the market. The
needed betas can be calculated as:
• and the covariance between U.S. equities and U.S. fixed
income returns as:
77. Solution to 2
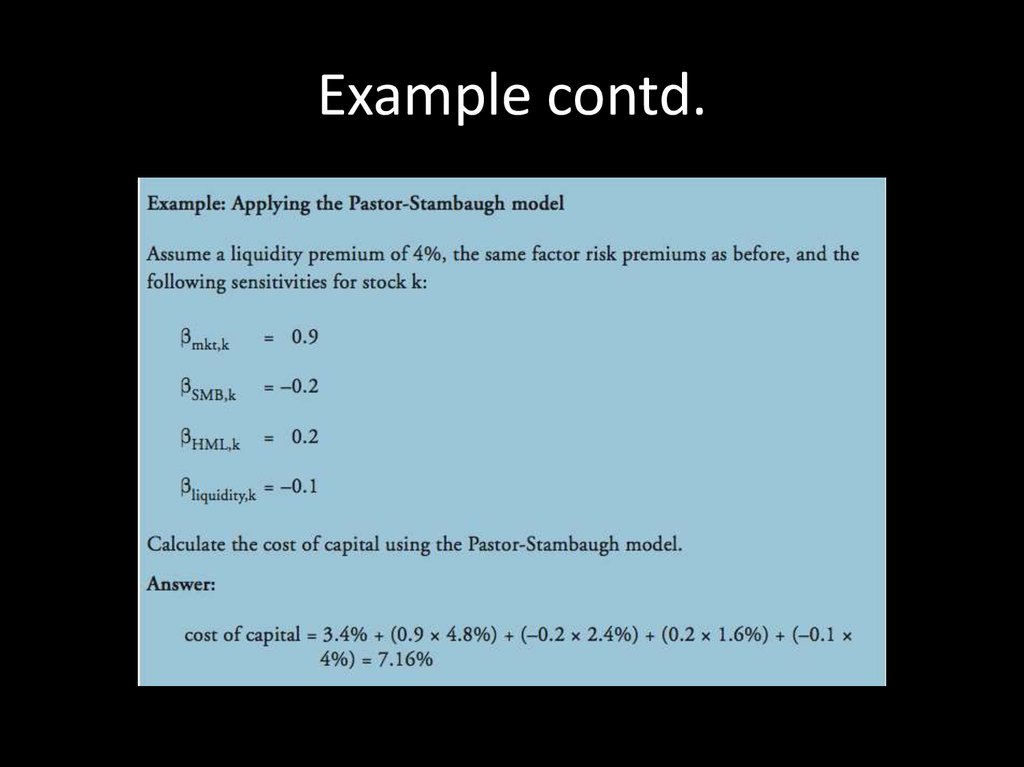
Pastor-Stambaugh• the Pastor-Stambaugh model adds a liquidity
factor to the Fama-French model.
• the baseline value for the liquidity factor beta
is zero.
• Less liquid assets should have a positive beta,
while more liquid assets should have a
negative beta.
78. Pastor-Stambaugh
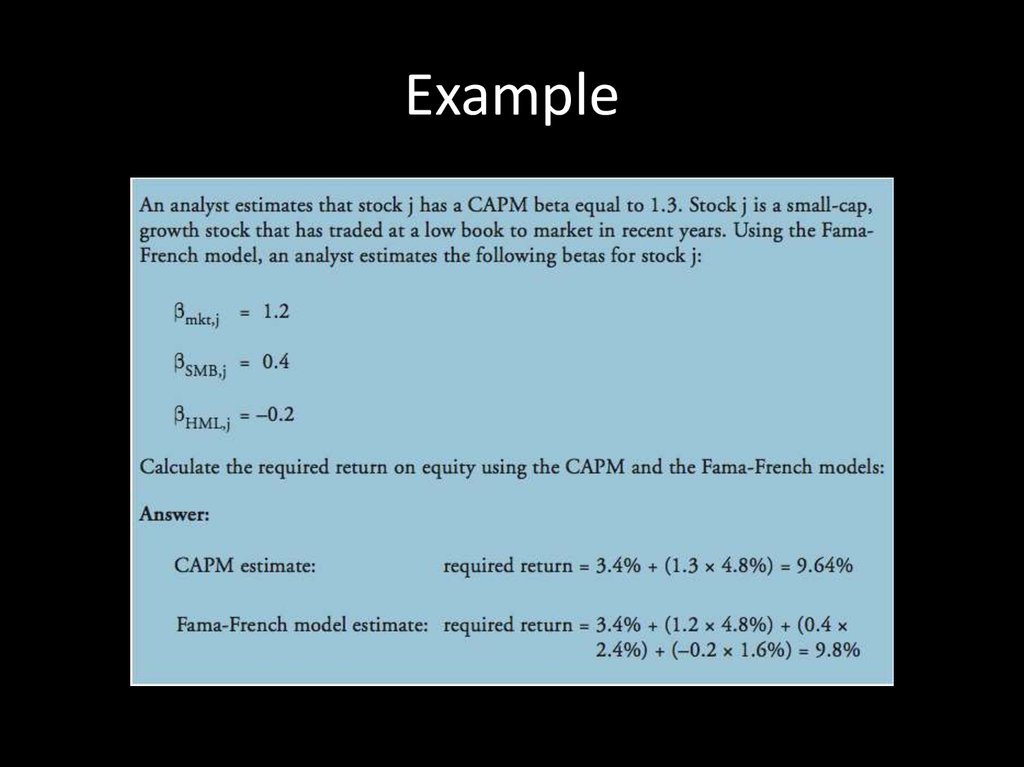
Example79. Example
contd.80. Example contd.
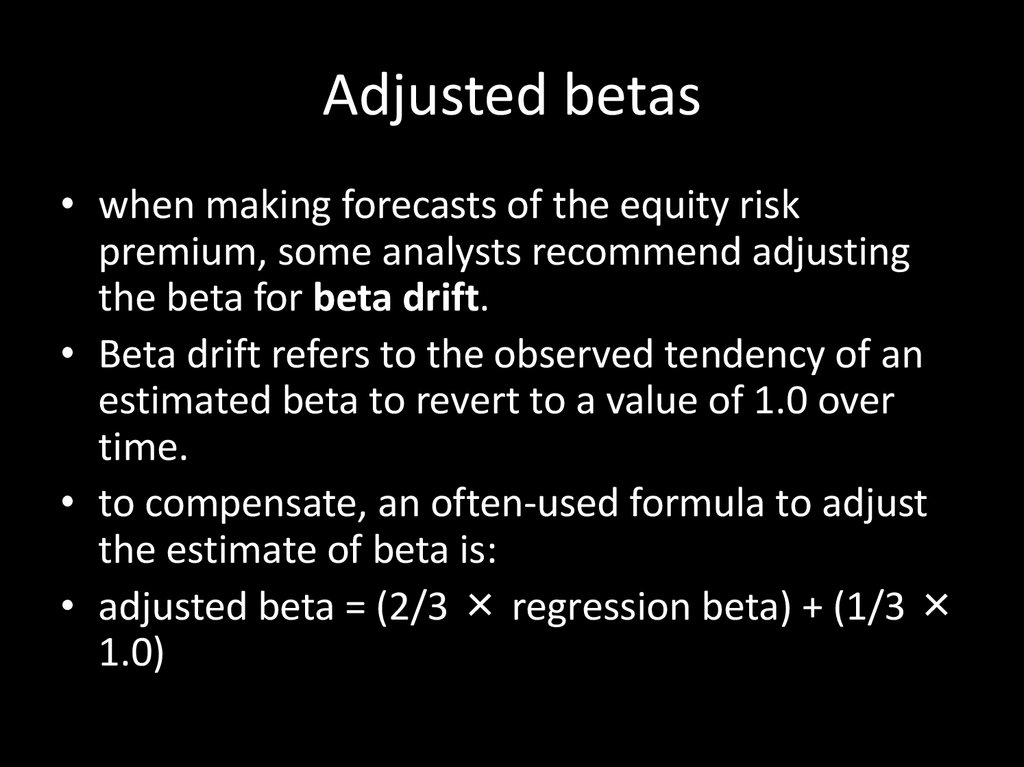
Adjusted betas• when making forecasts of the equity risk
premium, some analysts recommend adjusting
the beta for beta drift.
• Beta drift refers to the observed tendency of an
estimated beta to revert to a value of 1.0 over
time.
• to compensate, an often-used formula to adjust
the estimate of beta is:
• adjusted beta = (2/3 × regression beta) + (1/3 ×
1.0)
81. Adjusted betas
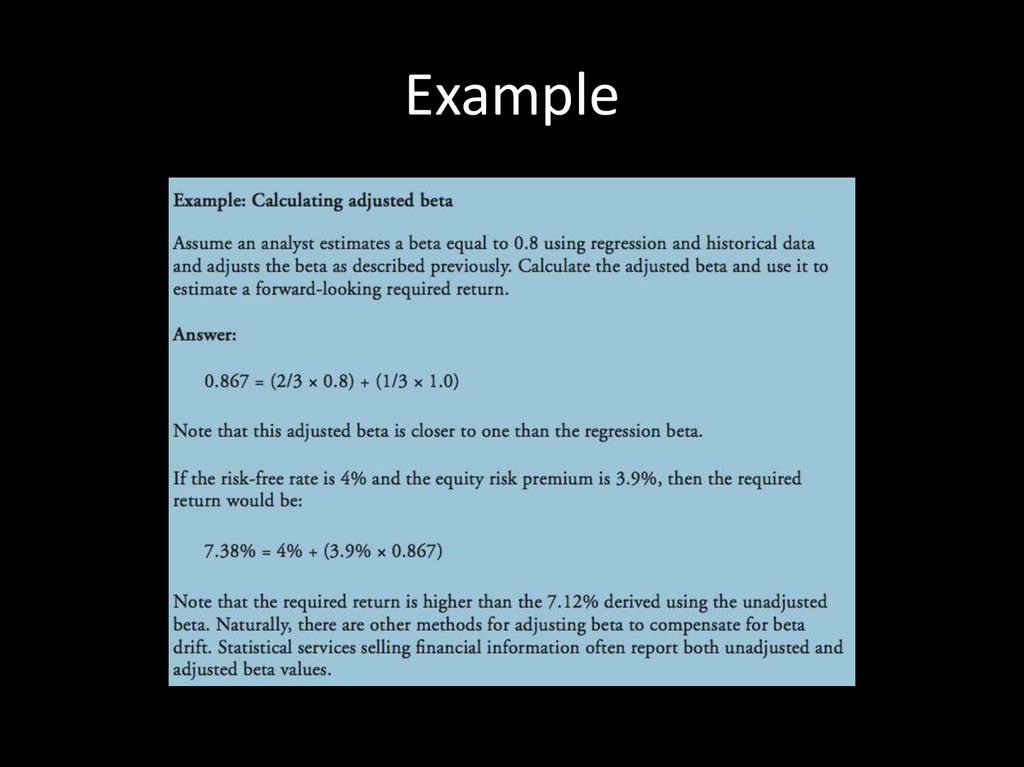
Example82. Example
Part II.5DEBTS: INTRO AND STRATEGIES
83. debts: intro and strategies
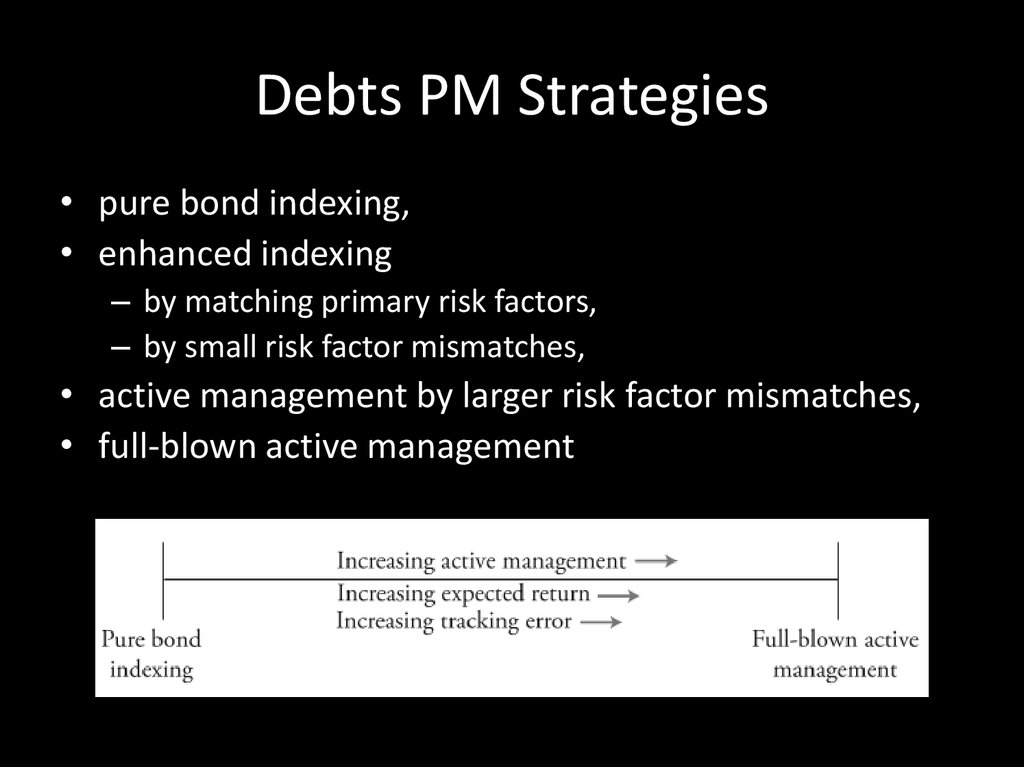
Debts PM Strategies• pure bond indexing,
• enhanced indexing
– by matching primary risk factors,
– by small risk factor mismatches,
• active management by larger risk factor mismatches,
• full-blown active management
84. Debts PM Strategies
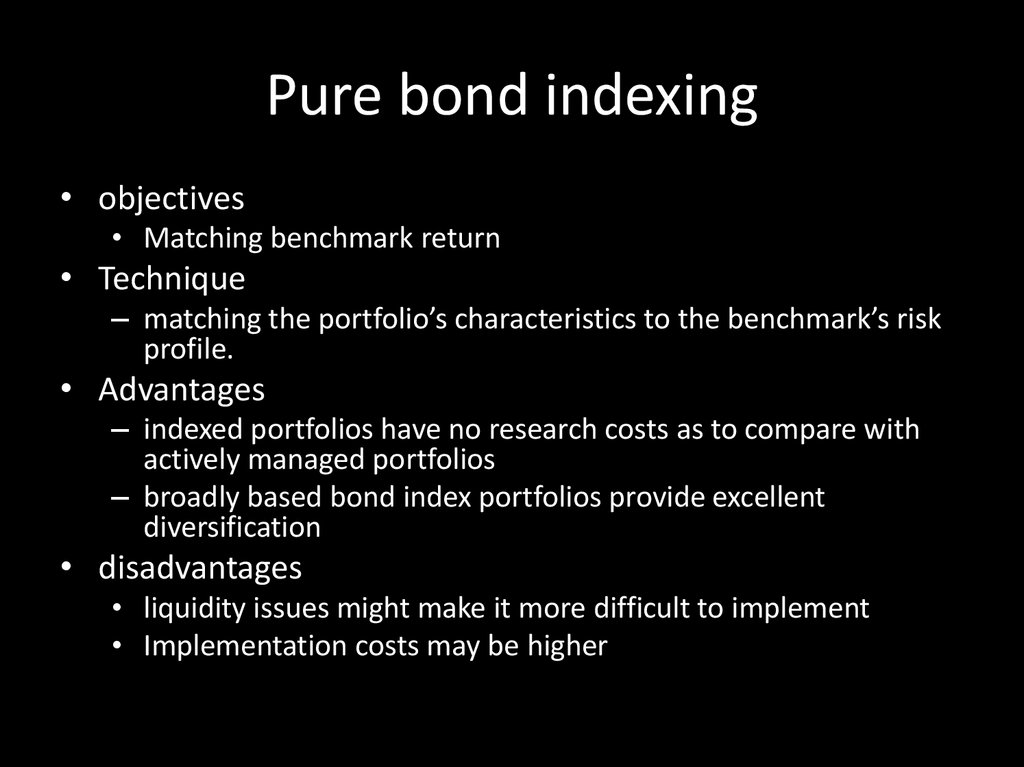
Pure bond indexing• objectives
• Matching benchmark return
• Technique
– matching the portfolio’s characteristics to the benchmark’s risk
profile.
• Advantages
– indexed portfolios have no research costs as to compare with
actively managed portfolios
– broadly based bond index portfolios provide excellent
diversification
• disadvantages
• liquidity issues might make it more difficult to implement
• Implementation costs may be higher
85. Pure bond indexing
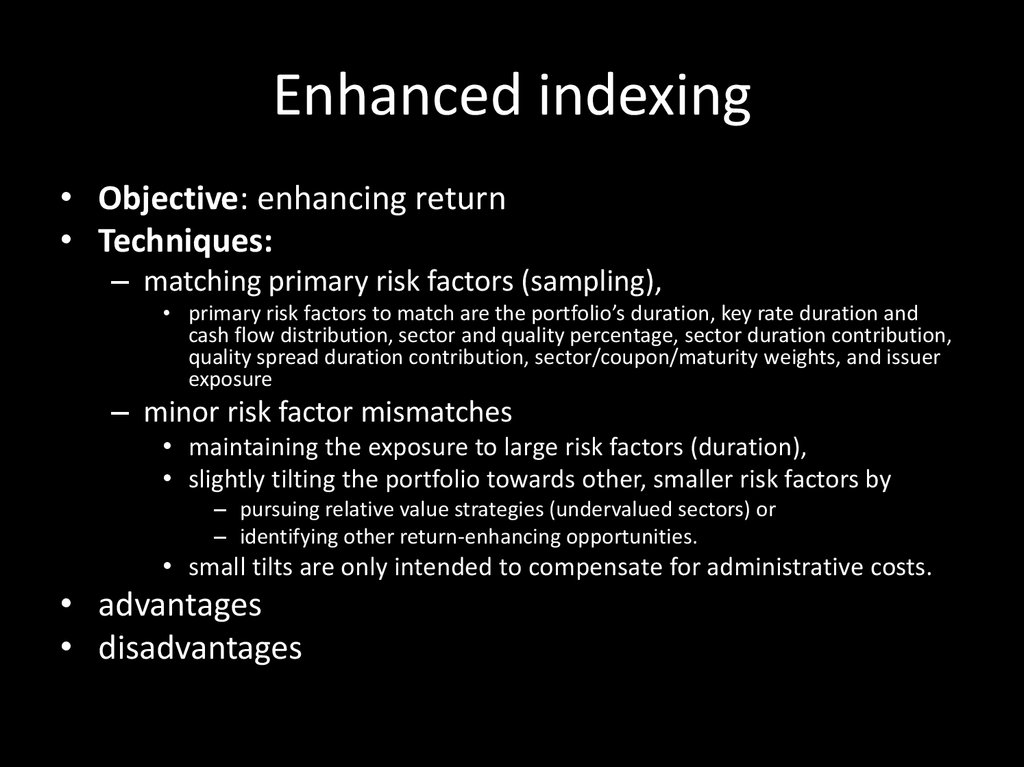
Enhanced indexing• Objective: enhancing return
• Techniques:
– matching primary risk factors (sampling),
• primary risk factors to match are the portfolio’s duration, key rate duration and
cash flow distribution, sector and quality percentage, sector duration contribution,
quality spread duration contribution, sector/coupon/maturity weights, and issuer
exposure
– minor risk factor mismatches
• maintaining the exposure to large risk factors (duration),
• slightly tilting the portfolio towards other, smaller risk factors by
– pursuing relative value strategies (undervalued sectors) or
– identifying other return-enhancing opportunities.
• small tilts are only intended to compensate for administrative costs.
• advantages
• disadvantages
86. Enhanced indexing
Other techniquesAs even perfectly indexed portfolio will still
underperform the benchmark by the amount of
transactions costs a manager can further enhance
return by
• lowering managerial and transactions costs,
• issue selection,
• yield curve positioning,
• sector and quality positioning,
• call exposure positioning
87. Other techniques
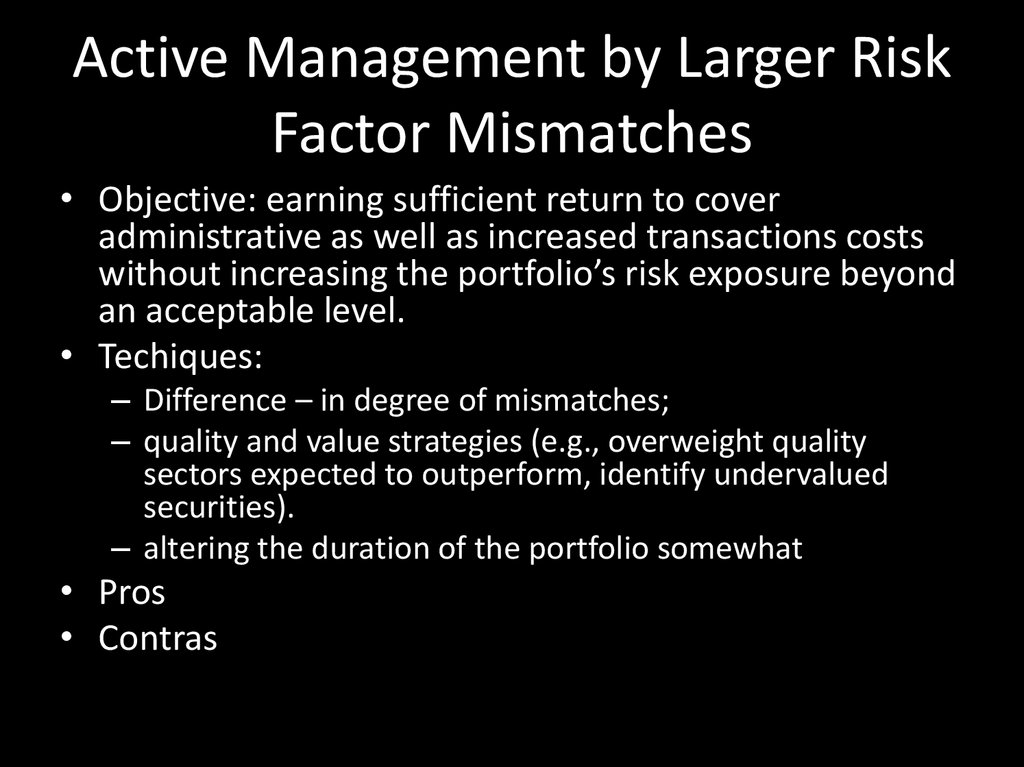
Active Management by Larger RiskFactor Mismatches
• Objective: earning sufficient return to cover
administrative as well as increased transactions costs
without increasing the portfolio’s risk exposure beyond
an acceptable level.
• Techiques:
– Difference – in degree of mismatches;
– quality and value strategies (e.g., overweight quality
sectors expected to outperform, identify undervalued
securities).
– altering the duration of the portfolio somewhat
• Pros
• Contras
88. Active Management by Larger Risk Factor Mismatches
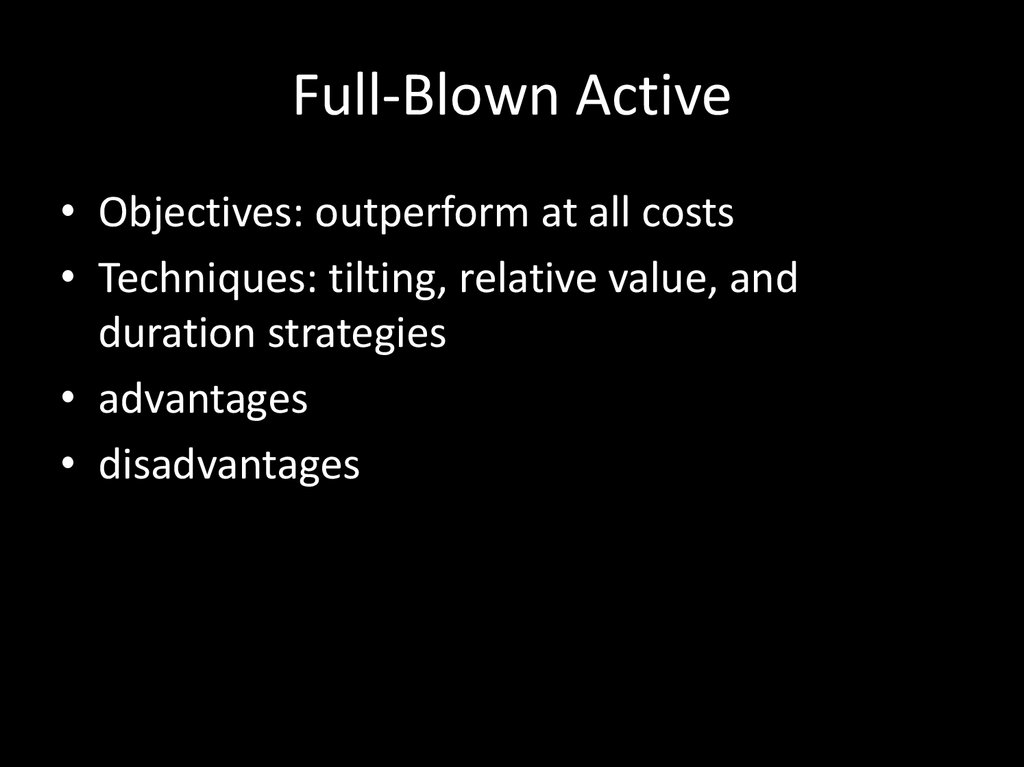
Full-Blown Active• Objectives: outperform at all costs
• Techniques: tilting, relative value, and
duration strategies
• advantages
• disadvantages
89. Full-Blown Active
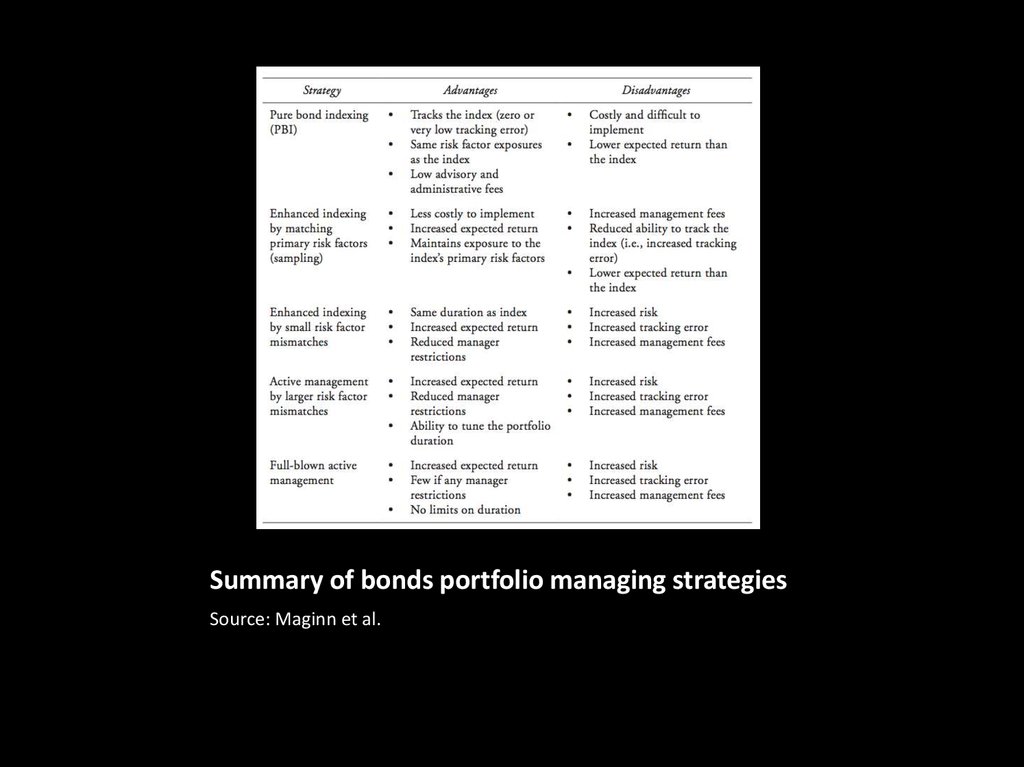
Summary of bonds portfolio managing strategiesSource: Maginn et al.
90. Summary of bonds portfolio managing strategies
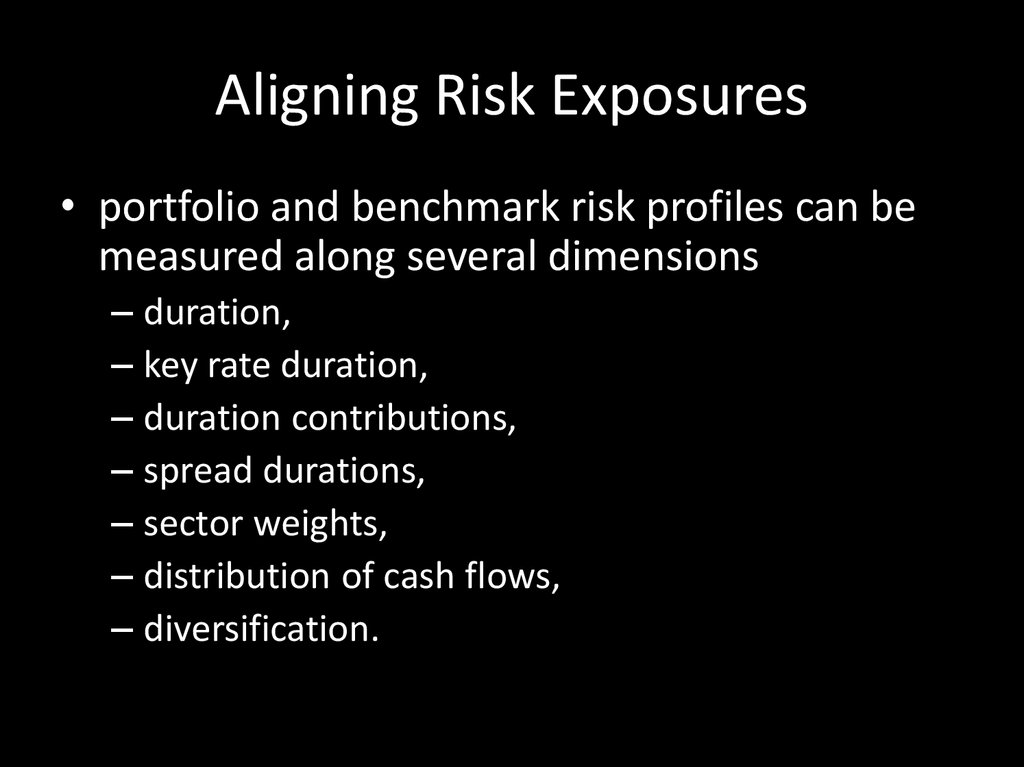
Aligning Risk Exposures• portfolio and benchmark risk profiles can be
measured along several dimensions
– duration,
– key rate duration,
– duration contributions,
– spread durations,
– sector weights,
– distribution of cash flows,
– diversification.
91. Aligning Risk Exposures
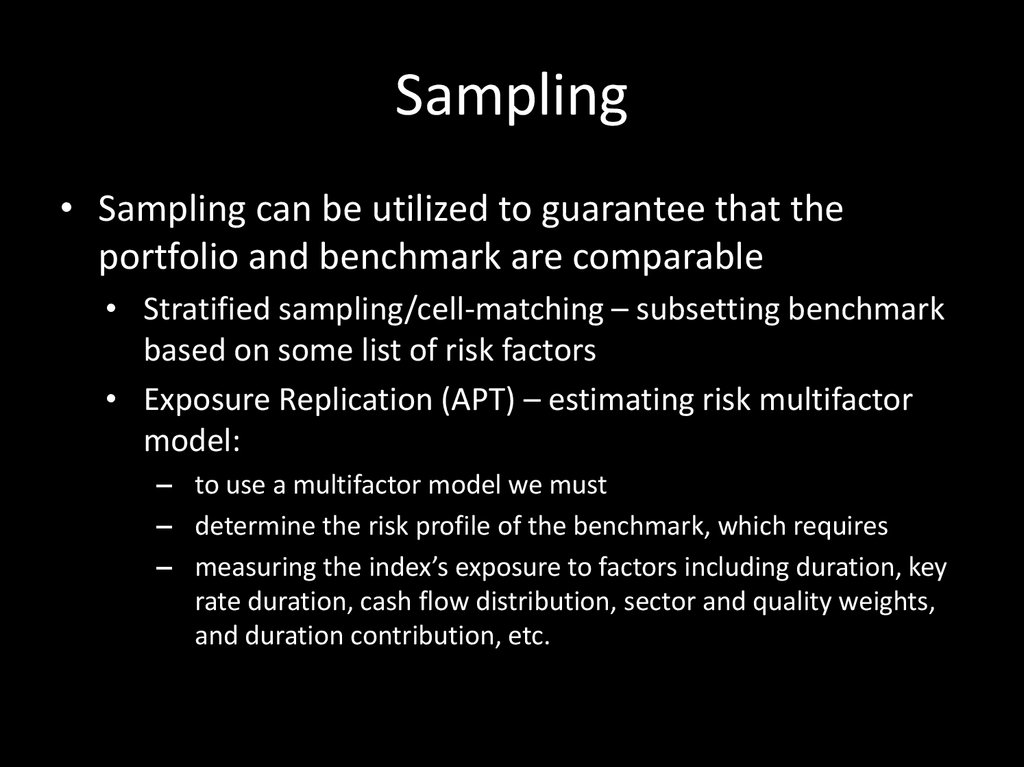
Sampling• Sampling can be utilized to guarantee that the
portfolio and benchmark are comparable
• Stratified sampling/cell-matching – subsetting benchmark
based on some list of risk factors
• Exposure Replication (APT) – estimating risk multifactor
model:
– to use a multifactor model we must
– determine the risk profile of the benchmark, which requires
– measuring the index’s exposure to factors including duration, key
rate duration, cash flow distribution, sector and quality weights,
and duration contribution, etc.




 economics


