


 geography
Similar presentations:


Stable Water Isotopes in Glaciology and Paleogeography
1. Stable Water Isotopes in Glaciology and Paleogeography
Saint Petersburg State University, Institute of Earth SciencesStable Water Isotopes in Glaciology and
Paleogeography
Alexey Ekaykin
Arctic and Antarctic Research Institute
ekaykin@aari.ru
2.
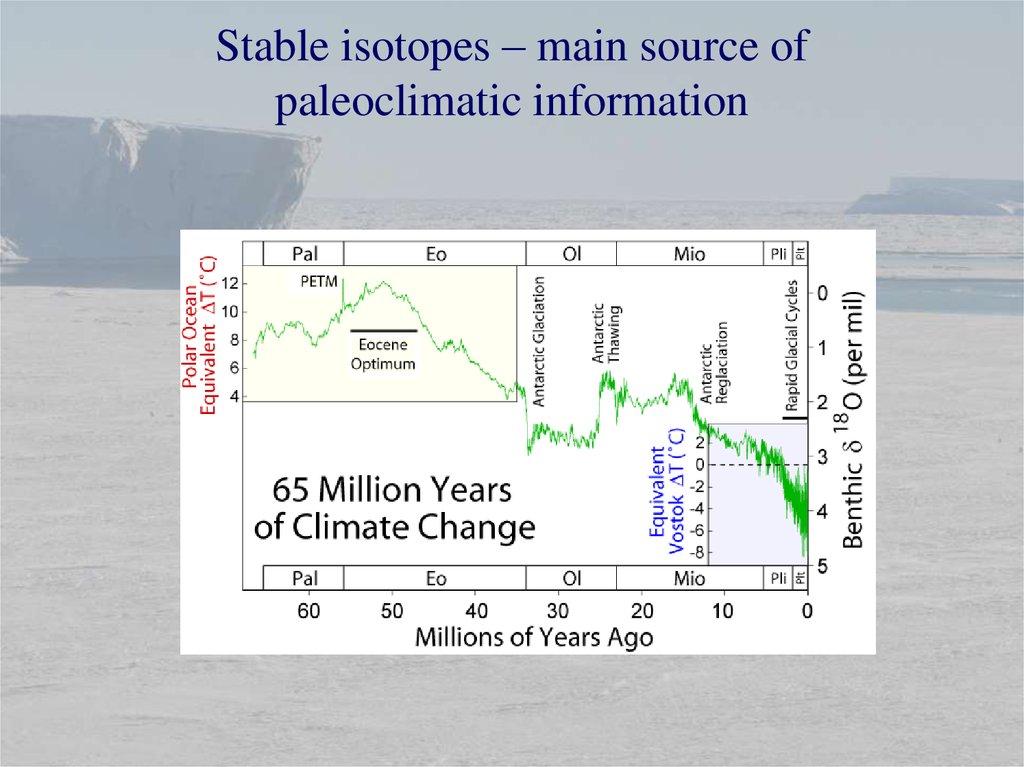
Stable isotopes – main source ofpaleoclimatic information
3.
Application of stable isotopes:Science:
Paleoclimatology
• ice cores
• marine sediments
• corals
• speleothems (cave deposits)
• dendrochronology
•…
Hydrology
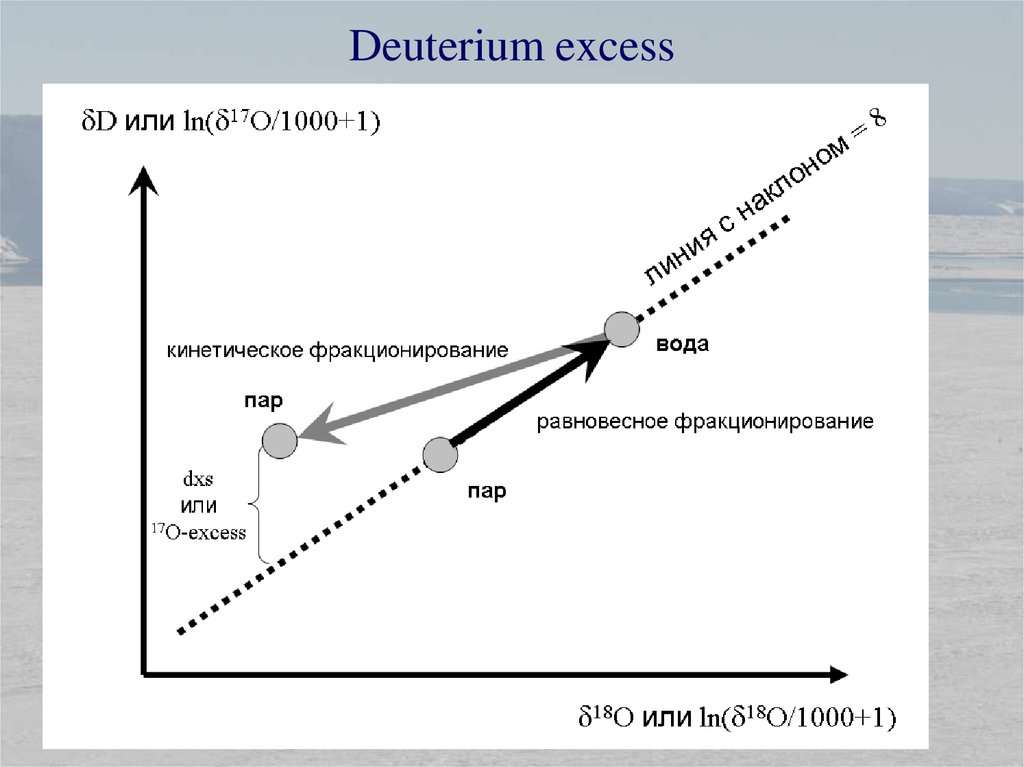
Glaciology
etc.
(but not only in science)
4.
Isotopes (ισος — “equal”, “same” and τόπος — “place”) – elementsthat occupy the same cell in the Periodic table of elements
Frederick Soddy
5.
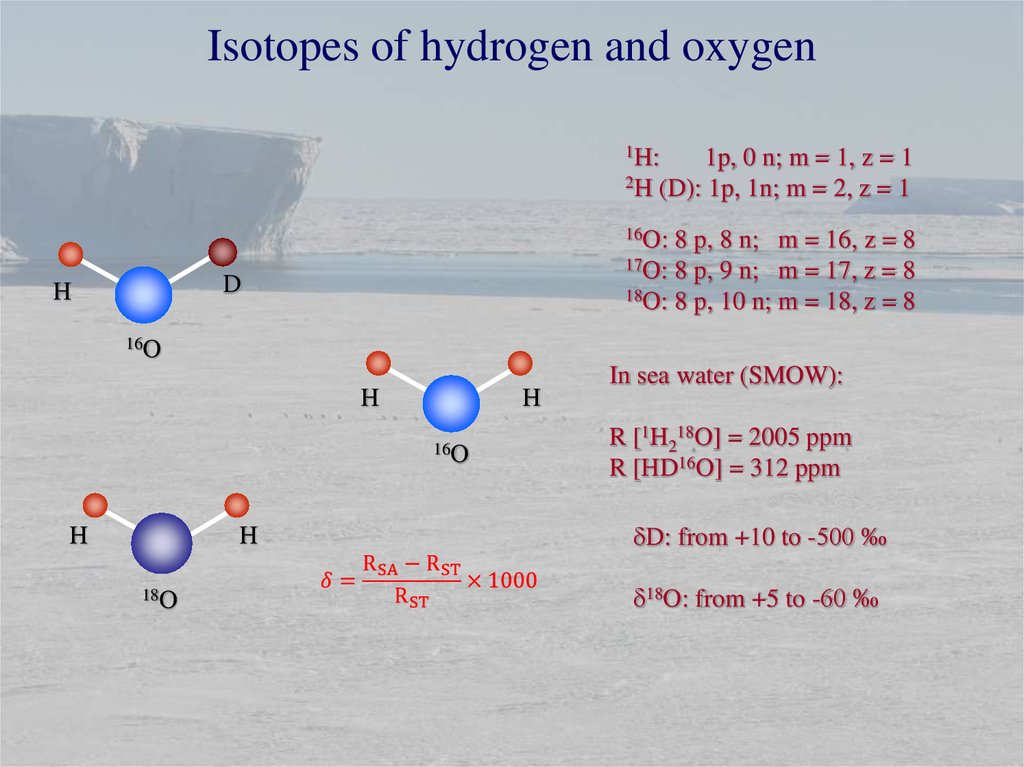
Isotopes of hydrogen and oxygen1H:
1p, 0 n; m = 1, z = 1
2H (D): 1p, 1n; m = 2, z = 1
16O:
8 p, 8 n; m = 16, z = 8
17O: 8 p, 9 n; m = 17, z = 8
18O: 8 p, 10 n; m = 18, z = 8
D
H
16O
H
H
16O
H
H
18O
In sea water (SMOW):
R [1H218O] = 2005 ppm
R [HD16O] = 312 ppm
dD: from +10 to -500 ‰
d18O: from +5 to -60 ‰
6.
Isotopes of hydrogen and oxygenSlightly different physical
properties:
- saturation vapor pressure
- diffusion coefficients
D
H
16O
H
H
16O
H
H
18O
7.
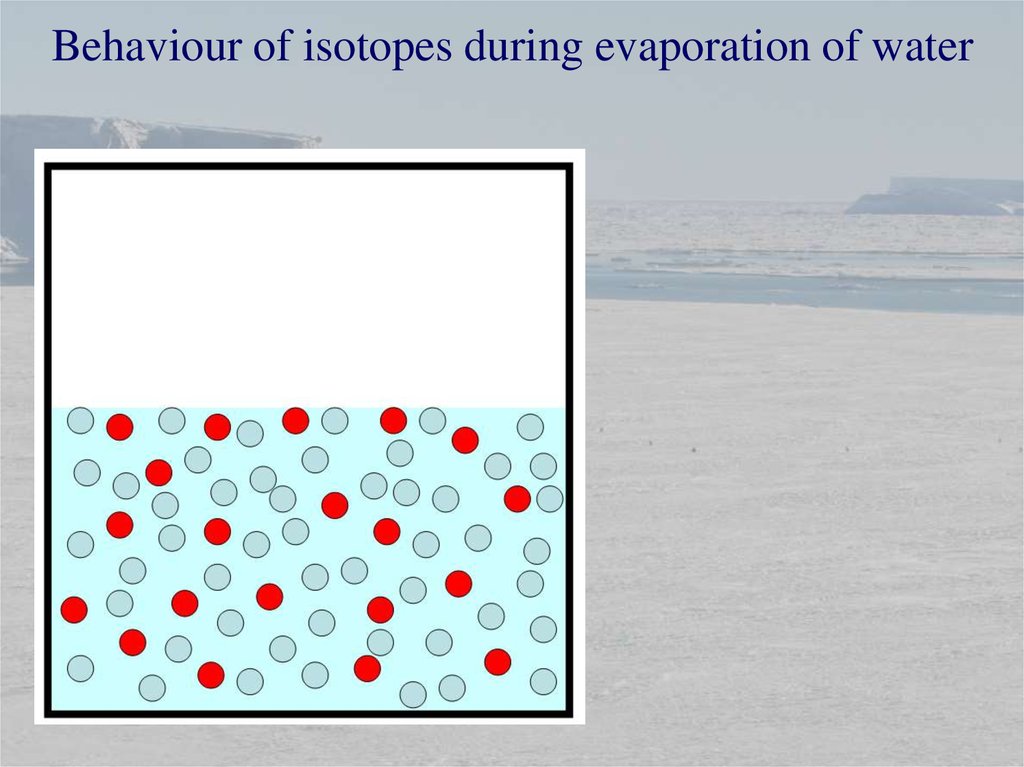
Behaviour of isotopes during evaporation of water8.
Behaviour of isotopes during evaporation of waterFirst portion of water
vapor is enriched in light
isotopes
9.
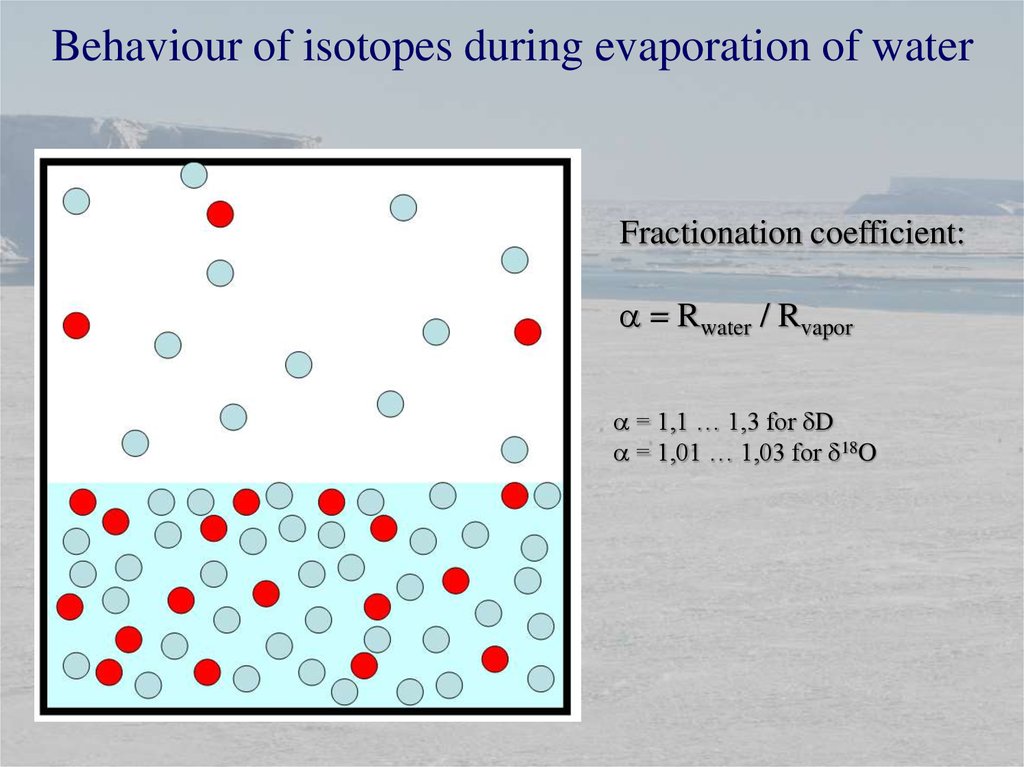
Behaviour of isotopes during evaporation of waterSystem comes to
equilibrium:
water vapor is saturated
Saturation vapor pressure
is less for heavy
molecules than for light
molecules
Concentration of heavy
isotopes in vapor is less
than in water
10.
Behaviour of isotopes during evaporation of waterFractionation coefficient:
a = Rwater / Rvapor
a = 1,1 … 1,3 for dD
a = 1,01 … 1,03 for d18O
11.
Isotopic fractionationtakes place in any phase
transition:
vapor – water
vapor – ice
water – ice
12.
Equilibrium fractionation coefficients for vapourwater and vapour-ice13.
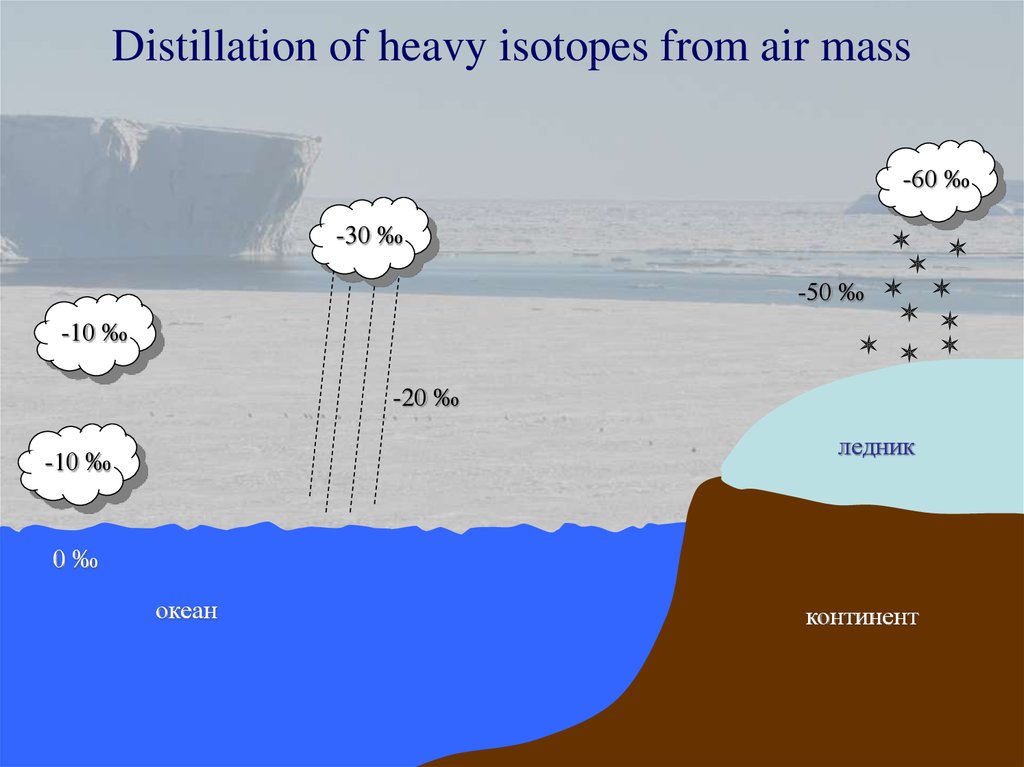
Distillation of heavy isotopes from air mass-60 ‰
-30 ‰
-50 ‰
-10 ‰
-20 ‰
ледник
-10 ‰
0‰
океан
континент
14.
Distillation of heavy isotopes from air massTo squeeze water out from the
air mass, we need to cool it:
-30 ‰
-10 ‰
So isotopic content of
precipitation is a function of
temperature drop between
moisture source and
condensation!
-60 ‰
-50 ‰
-20 ‰
ледник
-10 ‰
0‰
океан
континент
15.
Isotopic content of precipitation is a function oftemperature!
Willi Dansgaard
Dansgaard, 1964
16.
Isotopic content of precipitation is a function oftemperature!
Latitudinal effect
Altitudinal effect
Seasonal effect
17.
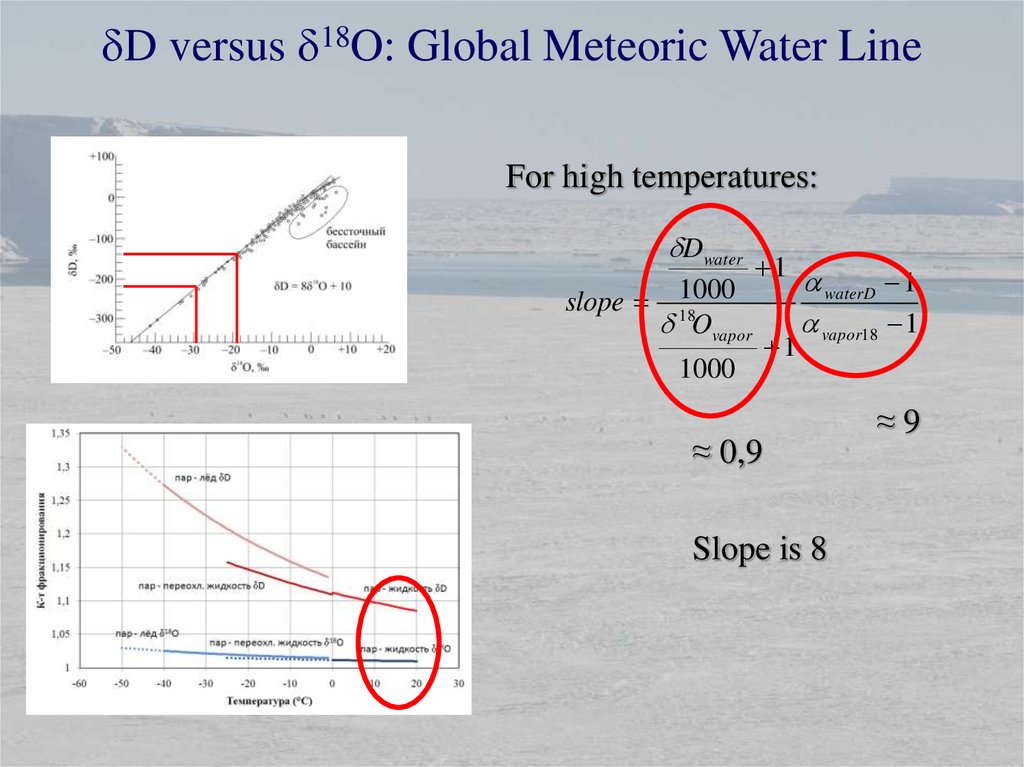
dD versus d18O: Global Meteoric Water LineCraig, 1961
18.
dD versus d18O: Global Meteoric Water LineWhy the slope between deuterium
and oxygen-18 is 8?
Ratio between isotopic composition
of vapor and water:
Rwater = a Rvapor
Let’s write it in “d” notation:
d vapor
1 a
1
1000
1000
d water
The slope between dD and d18O is:
slope
dDwater dDvapor
d 18Owater d 18Ovapor
dDwater
1
a D 1
1000
slope 18
a 18 1
d Owater
1
1000
19.
dD versus d18O: Global Meteoric Water LineFor high temperatures:
dDwater
slope
1000
d 18Ovapor
1
1000
1
a waterD 1
a vapor18 1
≈ 0,9
Slope is 8
≈9
20.
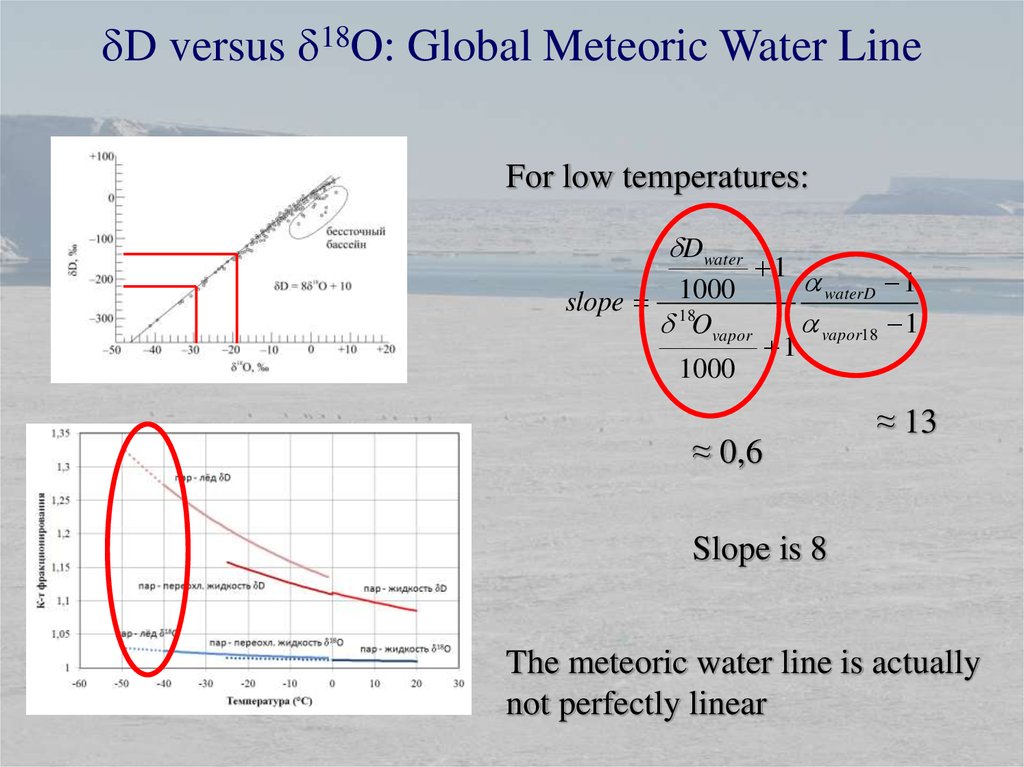
dD versus d18O: Global Meteoric Water LineFor low temperatures:
dDwater
slope
1000
d 18Ovapor
1
1000
1
a waterD 1
a vapor18 1
≈ 0,6
≈ 13
Slope is 8
The meteoric water line is actually
not perfectly linear
21.
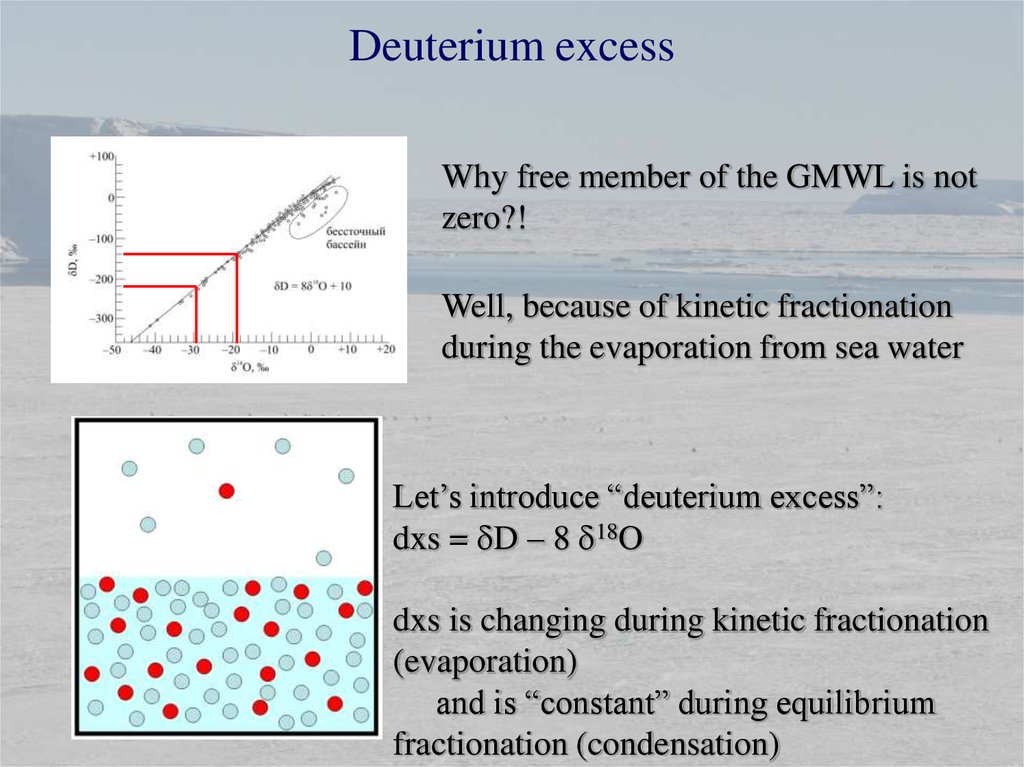
Deuterium excessWhy free member of the GMWL is not
zero?!
Well, because of kinetic fractionation
during the evaporation from sea water
Let’s introduce “deuterium excess”:
dxs = dD – 8 d18O
dxs is changing during kinetic fractionation
(evaporation)
and is “constant” during equilibrium
fractionation (condensation)
22.
Deuterium excess23.
Deuterium excess as a characteristic of moisturesource conditions
Landais et al., 2009
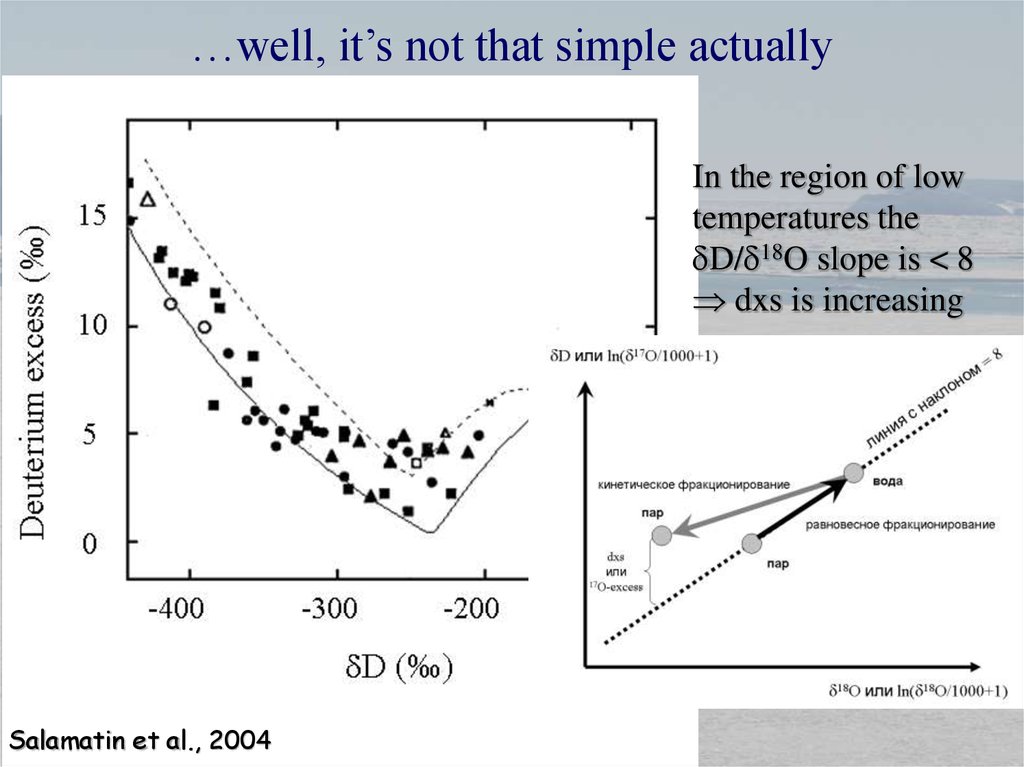
24.
…well, it’s not that simple actuallyIn the region of low
temperatures the
dD/d18O slope is < 8
dxs is increasing
Salamatin et al., 2004
25.
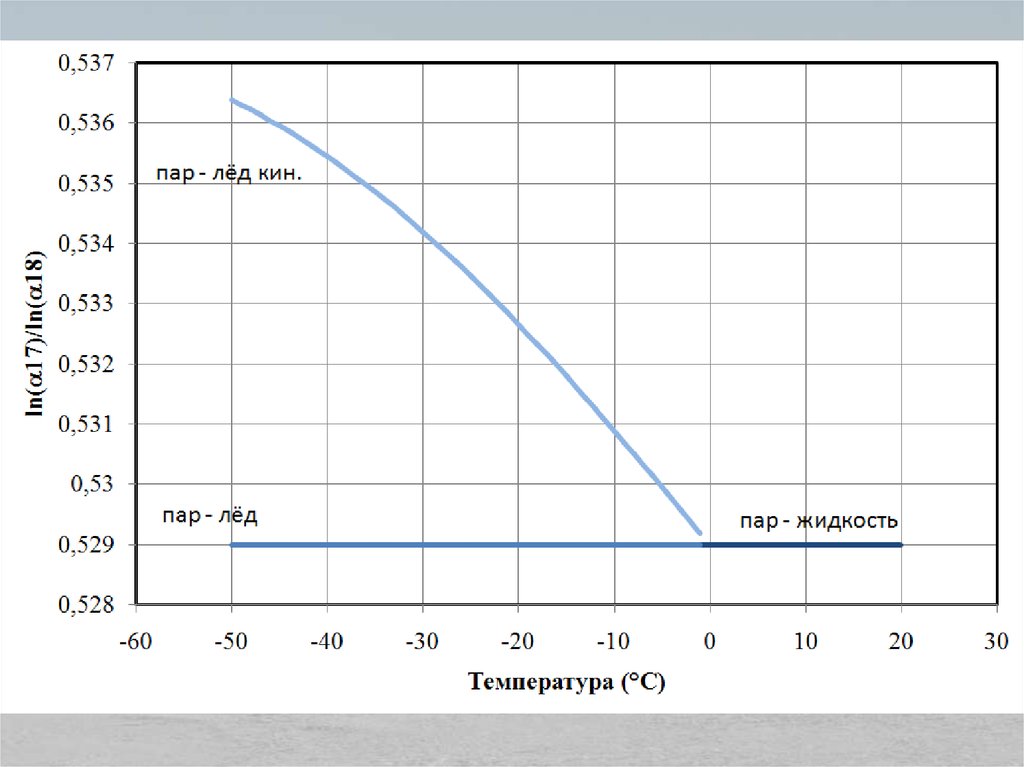
Oxygen-17 versus oxygen-18In logarithmic scale it
is perfectly linear!
Landais et al., 2009
26.
Oxygen-17 versus oxygen-1817O-excess
Landais et al., 2009
= [ln(d17O/1000+1) – 0,528 ln(d18O/1000+1)] × 106
27.
17O-excess28.
17O-excessLandais et al., 2009
does not depend on moisture source
temperature!
29.
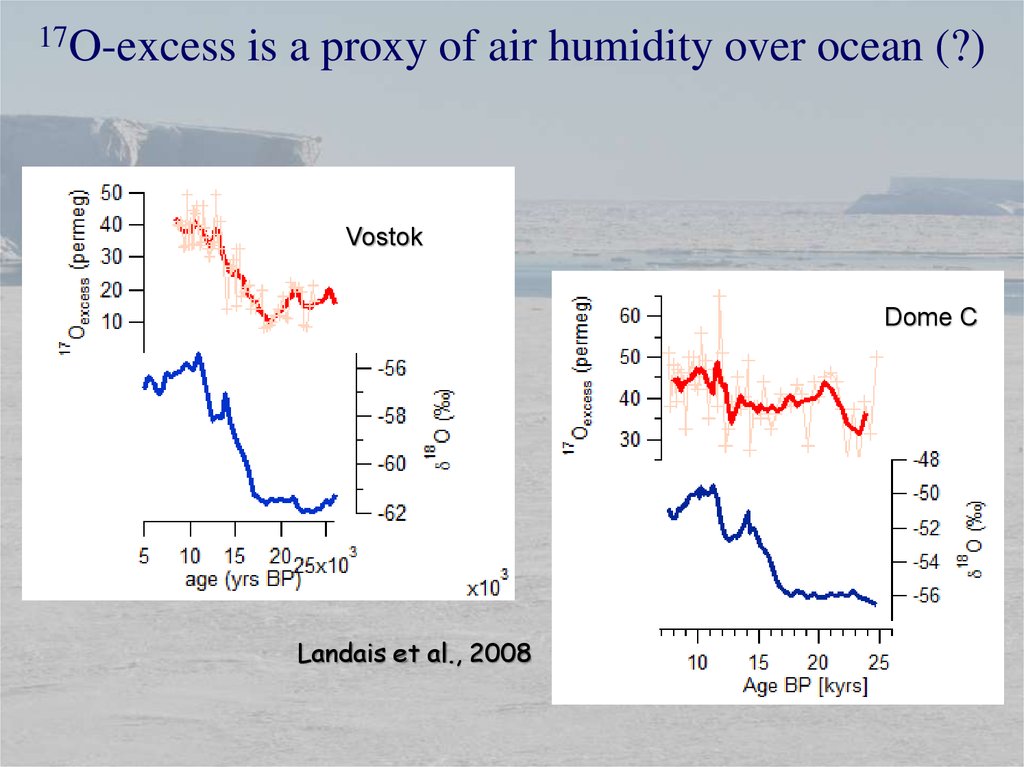
17O-excessis a proxy of air humidity over ocean (?)
Vostok
Dome C
Landais et al., 2008
30.
17O-excessis changing during kinetic fractionation in
ice clouds
Landais et al., 2012
31.
Factors controlling dxs and 17O-excessFactor:
dxs
17O-excess
Sea surface temperature
yes
no
Air humidity during
evaporation
yes
yes
Equilibrium fractionation
during liquid precipitation
no yes
no
Kinetic fractionation in ice
clouds
yes
yes
32.
Use of stable water isotopes in Paleoclimatology33.
Deep ice drilling projects in Antarctica and GreenlandKohnen(
Kohnen(EPICAEPICA-2)
2774 m / 150 kyr
Dome Fuji (Japan)
Japan)
NEEM
3029 m / 700 kyr
Прогресс
П
IPIC
S1
,50
0
р
о
г
р
е
kyr
Vostok (Russia)
(Russia)
3769
3666 m
m / 440 kyr
Dome C (EPICAEPICA-1)
3270 m / 850 kyr
с
с
34.
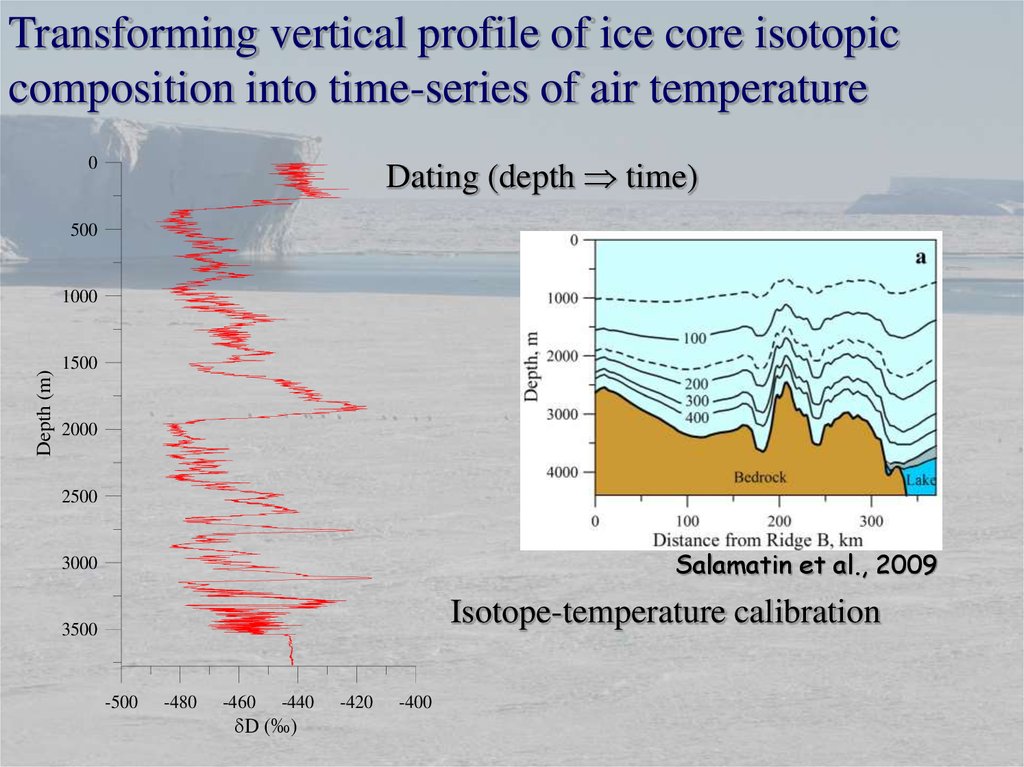
Transforming vertical profile of ice core isotopiccomposition into time-series of air temperature
Dating (depth time)
0
500
Depth (m)
1000
1500
2000
2500
Salamatin et al., 2009
3000
Isotope-temperature calibration
3500
-500
-480
-460
-440
dD (‰)
-420
-400
35.
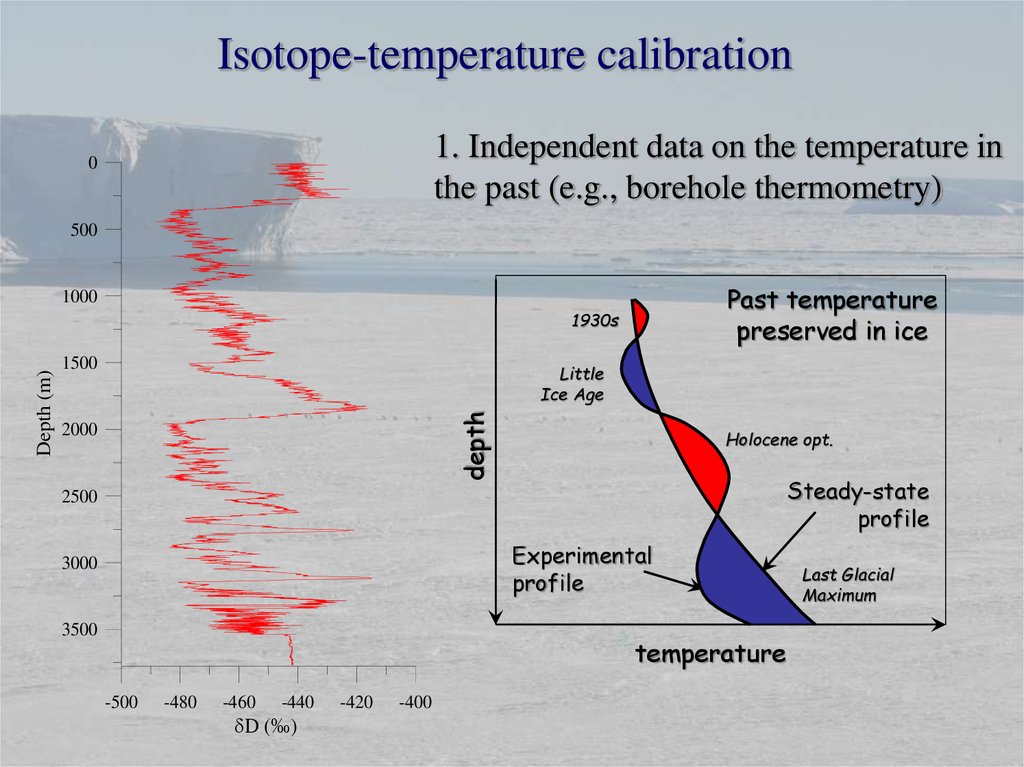
Isotope-temperature calibration1. Independent data on the temperature in
the past (e.g., borehole thermometry)
0
500
Past temperature
preserved in ice
1000
1500
Little
Ice Age
depth
Depth (m)
1930s
2000
Holocene opt.
Steady-state
profile
2500
Experimental
profile
3000
3500
temperature
-500
-480
-460
-440
dD (‰)
-420
-400
Last Glacial
Maximum
36.
Isotope-temperature calibration2. Present-day geographical relationship
between stable isotopic composition of
snow and mean annual air temperature
0
500
Depth (m)
1000
dD, ‰
0
1500
dDice C m d 18Om
Ti
Ci
T OC= 10 C
-100
T OC= 20 C
2000
-200
2500
-300
-400
3000
Mirny-Komsomolskaya
Patriot Hills - South Pole - Vostok
Dumont-d'Urville - Dome C
-500
3500
-60 -50 -40 -30 -20 -10 0
Temperature, C
-500
-480
-460
-440
dD (‰)
-420
-400
10
20
37.
Isotope-temperature calibration3. Regression between temporal
variability of snow isotopic composition
and instrumentally obtained air
temperature
(only for the past few thousand years)
0
500
1500
-34
-425
2000
-35
-435
2500
3000
-440
-36
-445
3500
-450
-37
-455
-500
-480
-460
-440
dD (‰)
-420
-400
1950
1960
1970
1980
Years AD
1990
2000
2010
Temperature (°C)
-430
dD (‰)
Depth (m)
1000
38.
Isotope-temperature calibration0
Atmospheric dust
0.5
1
0
1.5
-5
-10
280
CO2
-15
200
1500
Ice thickness (m) CH4 (p.p.b.v.)
Depth (m)
240
2000
2500
700
CH4
500
400
50
0
-50
-100
-150
-200
3500
-500
-480
-460
-440
dD (‰)
-420
-400
0
Sea level
-50
11
9
7
5
-100
Ice sheet thickness
400
300
200
Age (kyr BP)
3000
160
600
100
0
Petit et al., 1999
Sea level (m)
1000
Temperature
5
CO2 (p.p.m.v.)
Temperature (°C)
500
Dust (p.p.m.)
0
39.
Sources of uncertainties in the isotope-temperature method:40.
Sources of uncertainties in the isotope-temperature method:Temperature changes in the moisture source
41.
Sources of uncertainties in the isotope-temperature method:Precipitation intermittency and seasonality
Snow and ice deposits only record the
isotopic composition of the days when
precipitation occurred!
This may cause biases
(Days with precipitations are usually
warmer than days without)
42.
Sources of uncertainties in the isotope-temperature method:Precipitation intermittency and seasonality
Seasonality:
Mean annual isotopic composition is biased towards wetter season
Changing seasonality of precipitation may cause to wrong
interpretation of ice cores data
Past:
precip amount
JFMAMJJASOND
JFMAMJJASOND
depth
Now:
precip amount
Isotopic composition
43.
Sources of uncertainties in the isotope-temperature method:Post-depositional processes
As a result, the snow isotopic content shifts
towards heavier values
and the amplitude of the isotopic variability
decreases
-480
0
200
400
600
800
1000
1200
-460
-440
-420
-400
pore diffusion
firn
Isotopic composition of precipitation may
change in the snow thickness after deposition
due to mass- and isotopic exchange with
atmosphere
snow
Mass exchange
-38
44.
Sources of uncertainties in the isotope-temperature method:Other factors
1. Relationship between near-surface air temperature and
condensation temperature
2. Non-climatic changes of temperature in the past (altitude of
glacier)
3. Snow removal by wind
4. “Stratigraphic noise”
45.
Climate of late Pleistocene based on stable isotopiccomposition of ice cores
Jouzel et al., 2007
46.
Climate of late Pleistocene based on stable isotopiccomposition of ice cores and marine sediments
Marine benthic stack (Lisiecki and Raymo, 2005)
3
4
-360
4.5
-380
Mid-Pleistocene Transition
5
-400
5.5
EPICA DC (Jouzel et al., 2007)
-420
320
280
-400
CO2 composite record
(Luthi et al., 2008)
dD, ‰
-420
-440
240
200
CO2 (ppmv)
-440
160
Vostok (Petit et al., 1999)
-460
-480
-500
0
400
800
1200
Age, ka BP
1600
2000
-460
dD, ‰
d18O, ‰
3.5
47.
Стабильные изотопы воды в гидрологии48.
Стабильные изотопы воды в гидрологиирегиональная линия
метеорных вод
dD
атмосферные
осадки
лето
исчпорченный
образец?
зима
d18O
49.
Стабильные изотопы воды в гидрологии1
• изотопный состав льда также может
зависеть от его возраста
• снег и лёд могут иметь разный изотопный
состав
региональная линия
метеорных вод
dD
Ледник и речка с
ледниковым
питанием
1
d18O
50.
Стабильные изотопы воды в гидрологии• изотопный состав воды в реке зависит от
сезона года и от времени оборота воды
1
2
региональная линия
метеорных вод
dD
речка с
атмосферным
питанием
2
1
d18O
51.
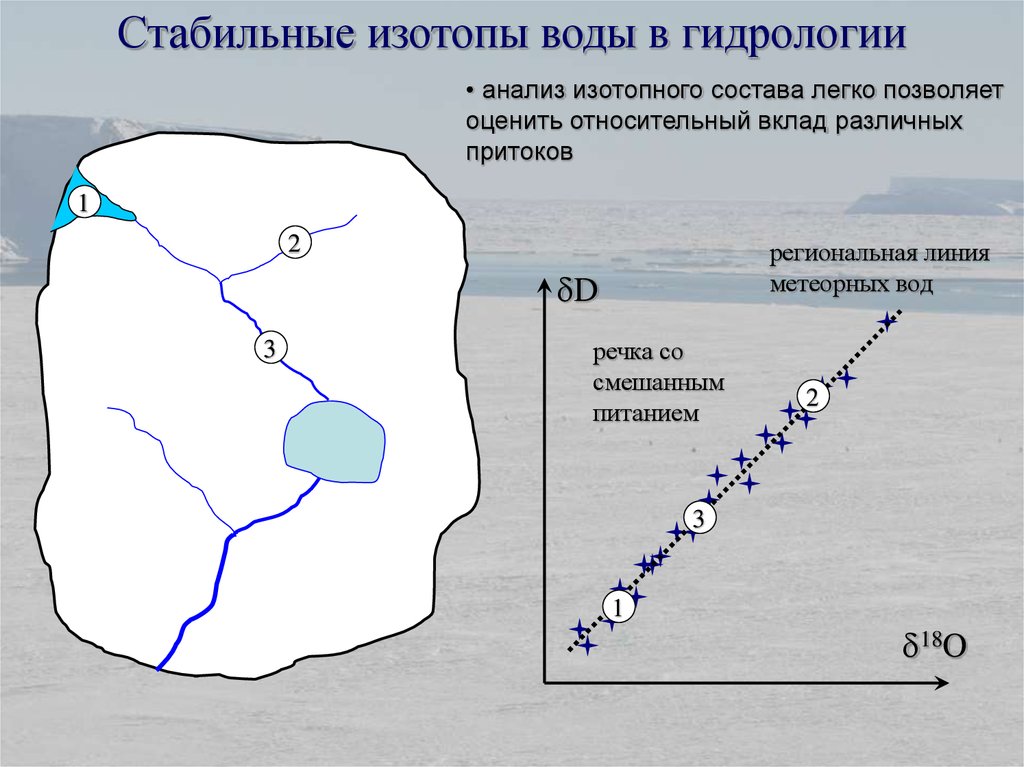
Стабильные изотопы воды в гидрологии• анализ изотопного состава легко позволяет
оценить относительный вклад различных
притоков
1
2
региональная линия
метеорных вод
dD
3
речка со
смешанным
питанием
2
3
1
d18O
52.
Стабильные изотопы воды в гидрологии• изотопное смещение будет зависеть от
интенсивности испарения (=f(tº, R)) и от
времени оборота воды в озере
• подобное смещение также м.б.
обусловлено влиянием грунтовых вод (см.
дальше)
региональная линия
1
2
dD
метеорных вод
озеро
3
2
4
4
3
1
d18O
53.
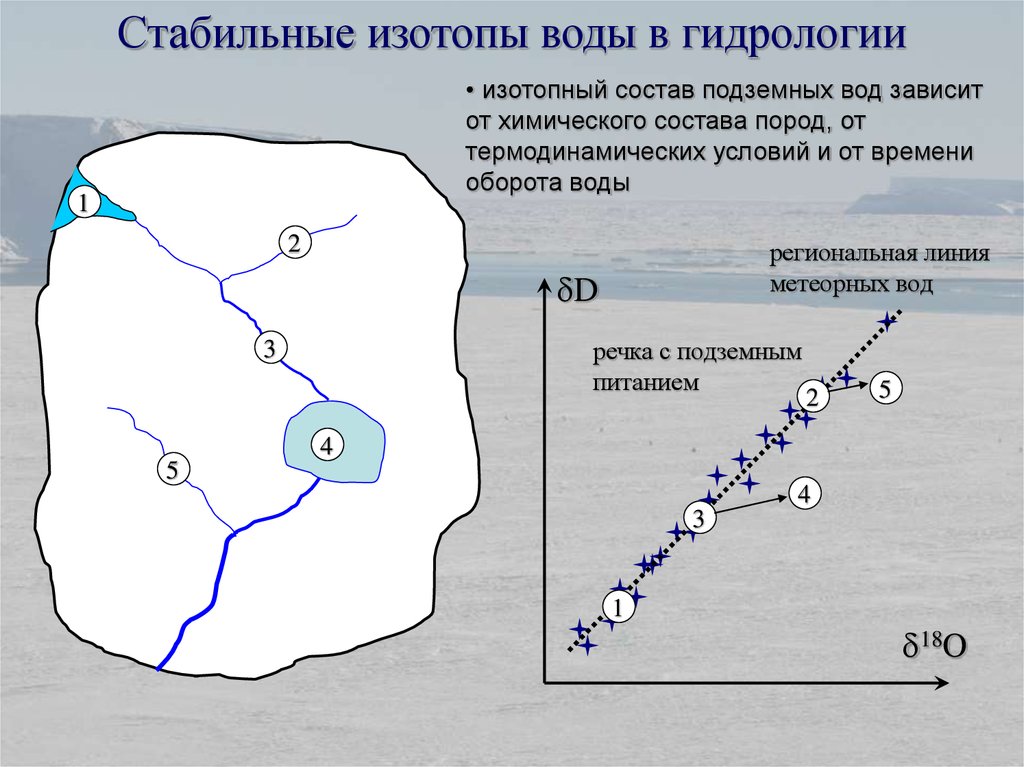
Стабильные изотопы воды в гидрологии• изотопный состав подземных вод зависит
от химического состава пород, от
термодинамических условий и от времени
оборота воды
1
2
региональная линия
метеорных вод
dD
речка с подземным
питанием
3
2
5
4
5
4
3
1
d18O
54.
Стабильные изотопы воды в гидрологии• изотопный метод прекрасно дополняет
(иногда – заменяет) другие методы
гидрологических исследований
1
2
региональная линия
метеорных вод
dD
3
4
5
итоговый
изотопный состав –
функция баланса
массы разных
компонент
5
2
6
4
3
6
1
d18O
55.
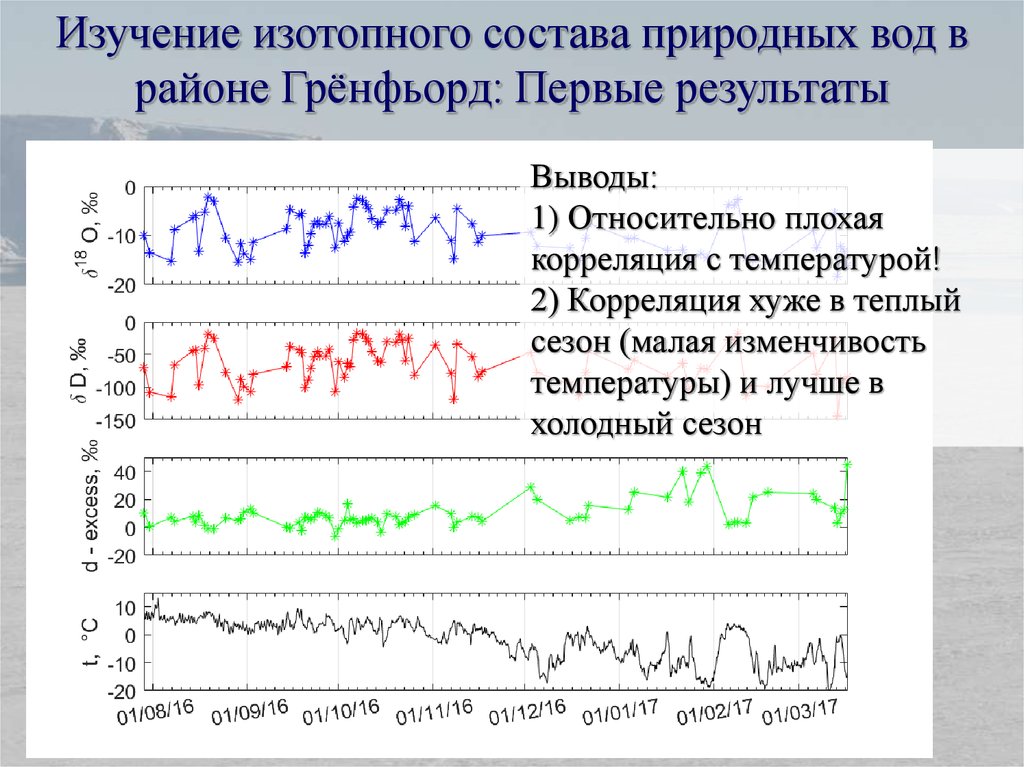
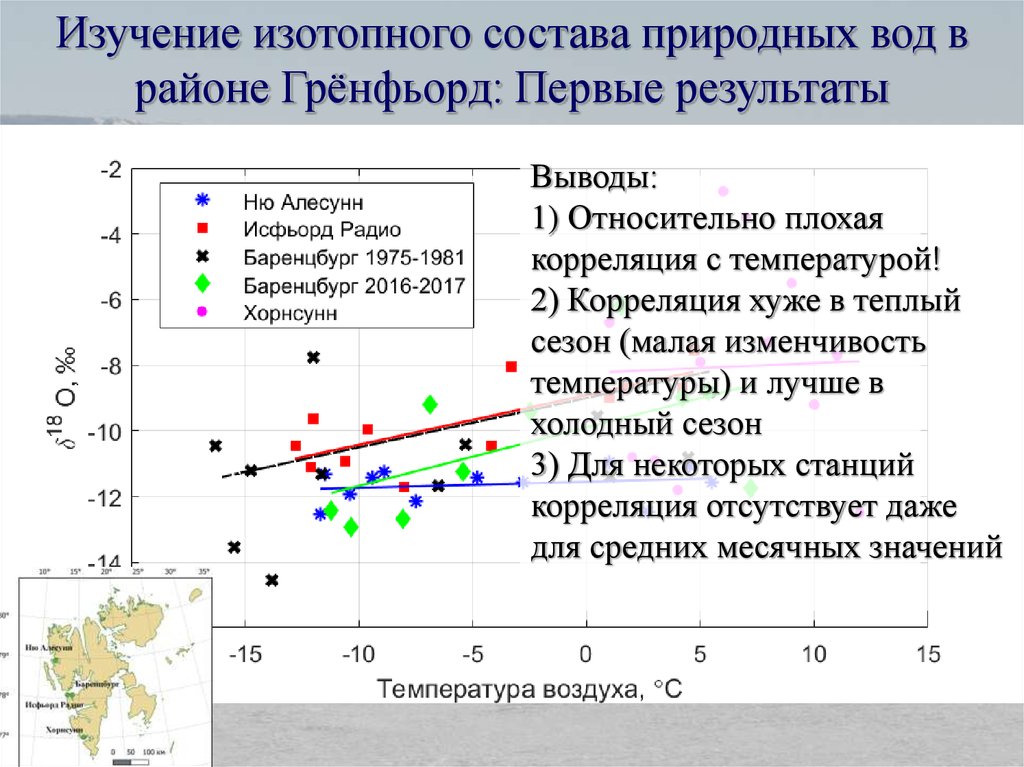
Изучение изотопного состава природных вод врайоне Грёнфьорд: Первые результаты
Выводы:
1) Относительно плохая
корреляция с температурой!
2) Корреляция хуже в теплый
сезон (малая изменчивость
температуры) и лучше в
холодный сезон
56.
Изучение изотопного состава природных вод врайоне Грёнфьорд: Первые результаты
Выводы:
1) Относительно плохая
корреляция с температурой!
2) Корреляция хуже в теплый
сезон (малая изменчивость
температуры) и лучше в
холодный сезон
3) Для некоторых станций
корреляция отсутствует даже
для средних месячных значений
57.
Изучение изотопного состава природных вод врайоне Грёнфьорд: Первые результаты
Альдегонда
Выводы:
1) Изотопный состав ледников и
рек с ледниковым питанием
близок к среднему составу
осадков
2) Весь лёд – «современный»
3) Озера и мелкие ручьи
испытывают сильное влияние
испарения и/или грунтовых вод
58.
Изучение изотопного состава природных вод врайоне Грёнфьорд: Первые результаты
Восточный и Западный Гренфьорд
Выводы:
1) Различный изотопный состав
талой воды в зонах аккумуляции
и абляции
2) Погребенный лёд имеет
ледниковое происхождение
3) Озера испытывают сильное
влияние испарения и/или
грунтовых вод
59.
Изучение изотопного состава природных вод врайоне Грёнфьорд: Первые результаты
Озеро Конгресс
Выводы:
1) Существенная межгодовая
изменчивость
2) Неполное перемешивание
(поверхностной) воды
3) Существенное влияние
грунтовых вод
60.
Изучение изотопного состава природных вод врайоне Грёнфьорд: Первые результаты
булгунях
Выводы:
1) Верхняя часть сложена
современными осадками
2) Нижняя часть, возможно,
сложена осадками,
сформировавшимися в более
холодную эпоху
61.
Methods of laboratory analysis of the stable waterisotopes: Isotope-Ratio Mass-Spectrometry
62.
Methods of laboratory analysis of the stable waterisotopes: Isotope-Ratio Mass-Spectrometry
40
13C, 18O
в морских осадках
0
3
Уровень моря, м
O2/N2 и инсоляция
2
1
0
-40
-80
-120
-1
-2
-160
150
200
Lipenkov et al., in press
250
300
Возраст, тыс. лет
13C, 18O
350
400
0
100
в озерных осадках
тепло
200
12
300
400
Возраст, тыс. л.н.
Bassinot et al., 1994
d18O фосфатов, ‰
Нормированные значения
O2/N2, CH4, 18Oatm
13C, 18O, 15N
500
в органике
10
8
остров Врангеля
6
-32
-36
холодно
0
5 тыс. л.н.
по материалам С.Р. Веркулича
GRIP
-40
по Вартанян, 2007
0
-44
5
10
15
Возраст, тыс. л.н.
20
25
d18O, ‰
4
63.
Methods of laboratory analysis of the stable waterisotopes: Laser Spectroscopy
64.
Thank you!E-mail to:
ekaykin@aari.ru