Similar presentations:
Business Plan Game
1. Business Plan Game
2. Business Plan Lecturers
• Rob Warmenhoven(Marketing)
• Florentien Popescu
(Finance)
• Yvette Hartink (Finance)
• Jan Luijten(Finance)
• Chris Daniels (Finance)
• Tijmen
Weber(Marketing)
Business Plan Lecturers
Arnhem Business School
2
3. Arnhem city on the river Rhine
• 1 hour from Amsterdam,• 5 hours from Paris,
• 5 hours from Londen,
• 5 hours from Berlin
4. Arnhem
5. Arnhem Business School
• HAN 30,000 students• Faculty of Economics,
Management and Law
has 9,000 students:
• > 1,000 international
students, 2 exchange
students from
Plekhanov
6. Lets begin
7.
8.
9. Purpose of the Business planproject
•In the Business PlanGame you will work
with fellow students
on the creative
process of
developing an
business idea to a
business plan
10.
11.
12. Step 1 Kick off
13. Step 2- Choosing your business Idea
14. step 3 write Businessplan
15.
step 4 End Presentation16. The Businessplan
17. Introduction
• Intoduction to thegroup and the product
idea
• Personal data
• Company data
18. A Marketing and a Financial part
19. Structure Marketing part
• External Analysis/DESTEP• Competition
• Marketing strategy( including
Customers)
• Marketing mix
20. Structure Finance part
Explanation about:• Balance sheet
• Income statement
• Cash flow statement
• Financial performance, ratios
21. Grading Criteria Business Plan
Marketing gradecounts 40% in End grade
+
Finance grade
is 40% in End grade
1. .
22. General Criteria
Complete• Your plan must have the
“nuts and bolts” to support
your idea
General
Criteria
Appearance
• Your plan must look good
Realism
• Extent to which the plan is
realistic
23.
Presentationpresentation grade is 20%
of the End grade
The purpose of the
presentation :
1. Briefly present your
idea to the audience
(what is your idea?)
2. Present your business
plan to the audience
(how are you going to
market and finance
your idea?)
3. Defend your business
plan by answering
questions from a
team of lecturers and
Business
Professionals
24. Program BP
DateTime
Topic
1 Monday
30 April
9:00
Kick-off (rob)
Marketing in the BusinessPlan
Finance in the BusinessPlan
#
10:30
11:00 - 15:40 Brainstorming/ Idea creation / research
2 Thursday
3 may
3 Friday
4 May
4 Saturday
5 may
8:30- 10.00
Guest lecture
10.00-17.10
Business plan writing / Individual group meetings/
available for your questions.
8:30 – 10.00
Guest Lecture
11.00-17:10
Businessplan writing
17:00
hand in the Business Plan
9.00-13.00
13.30
Presentation Day
Final Ceremony
25. VK group
• Join: 2018 BP Plekhanov ABS• Example commercials
• Reader BusinessPlan
• Extra information
• Example businessplan
26. Group(s) !
• All Groups please report to FloretinePopescu between 11:00 and 12:00 to
check attendence of groups/students.
• Every day write in the board where we
can find you in building 1 or 3
• We are in the room on the schedule ,
visiting other groups or in the Lenin
auditorium.
27. Example advertisements of BSP groups 3 movies from other years
28. Questions?
29.
30. Be Creative
31. Structure Marketing part Businessplan
1)2)
3)
4)
5)
External analysis
Competitors
Customers Segmentation
Marketing Strategy
Marketing mix
32. External analysis Tools
• Macro-environment(DESTEP model)
• Competitors analysis
• Customer analysis
33.
34. Macro Environment (DESTEP)
Socialcultural
Technological
Economic
Ecological
Demographic
Political
Company
35. Demographics
• Population Size• Age groups
• Gender
• Ethnic group
• Income
• Educational level
• Occupation
• Family structure
36. Birth Rate in Russia 2017
37.
38. Economic
• An increase in the value of the trading currencies increases the prices ofproducts in overseas markets.
• Income distribution and changes in purchasing power
• Tax rates
• Interest levels
• GDP levels (national income)
© 2013
39.
40. Average income in dollars $
4041. The sociocultural environment
• Characteristics of society• Characteristics of people in that society
• Cultural values and beliefs.
• Trends
42. breakfast
42
breakfast
43.
© 201344. Technological environment
• Fast pace oftechnological change
• High research and
development costs
and equally high
budgets to ensure
advancement.
• The emergence of
the Internet
45. Macro-economics: Ecological
• Growing shortage of rawmaterials
• Increased pollution
• Increased government
intervention
• Global warming
• Nuclear energy
46. Political and legal environment
• New legislation requiring the companyproduct to be modified for safety
reasons.
• Protecting companies/ consumers
• Growth of public interest groups
47. Political developments Food Safety/ labour laws
© 201348. DESTEP
© 201349. Write them down
Demographic DevelopmentsEconomical Development
1
1
2
2
Social Developments
Technological Development
1
1
2
2
Ecological Developments
Political Development
1
1
2
2
© 2013
50. 3) Competition
51. What about competition?
Strategy
Target group(s)
Product Positioning
Marketing mix
52.
53. Industry analysis
• Give Details about themarket of your product
• Market potential
• Trends, Market size
• Market growth,
• Seasonal influences
54. Sales of Candy in the Netherlands
ERWERKEN(INCL.KAU
D
TOTAAL
NEDERLAN
00
00
00
P0
P
0
0
P
0
0
0
0
P
0
0
2
0
0
P
0
1
6
0
1
P
0
1
0
0
0
P
0
1
1
0
0
P
0
1
5
0
0
P
0
2
9
0
1
P
0
2
3
0
0
0
2
4
0
0
8
12
9
P
9
0
P
0
0
0
1
P
0
0
3
0
0
P
0
0
4
0
0
P
0
1
8
0
1
P
0
1
2
0
0
P
0
1
3
0
0
P
0
2
7
0
1
P
0
2
1
0
0
P
0
2
2
0
0
0
3
6
1
0
0
01
VE R KOPE N
© 2013
IN
K
55.
56. Set Objectives , choose main strategy, and marketing strategy
57.
5-7Types of marketing plan objectives
Marketing objectives
To manage key relationships/activities
• To develop a new product
• To organize an event with at least 500 targeted visitors in 2012
Financial objectives
To attain certain financial results
Make € 100.000 profit within two years in the market of green
pot plants
Societal objectives (People-Planet-Profit)
To achieve social responsibility results. Help workers
To produce environmentally friendly, reduction of waste
with 10% in the coming production year 2012
Presentation © 2005 Marian Burk Wood - all rights reserved
58. Strategy
59.
60. Step 1 Segmentation
• The process ofdividing a larger
market into
smaller pieces
based on one or
more
meaningful
shared
characteristics
60
61.
Segmentation61
62.
Consumer/customer Analysis1 Who are the customers?
2 When do the buy ?
3 What do customers do with our products ?
4 Where do they buy
5 Why do consumers / customers buy ?
6 Why do they don’t buy your
63.
64. Step 2 Targeting
• Core strategy is the matching ofcompany strengths and market
opportunities
• Identification of group of
customers to whom the
company can clearly show it has
a differential advantage.
65. Step 3: Product Positioning
66.
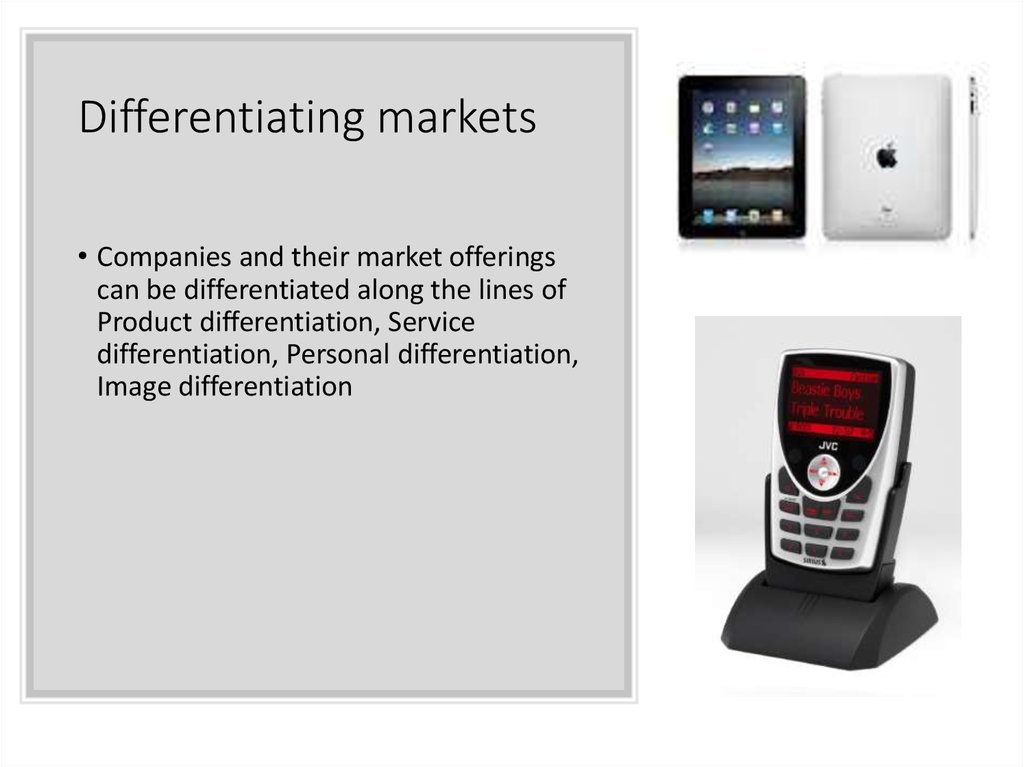
67. Differentiating markets
• Companies and their market offeringscan be differentiated along the lines of
Product differentiation, Service
differentiation, Personal differentiation,
Image differentiation
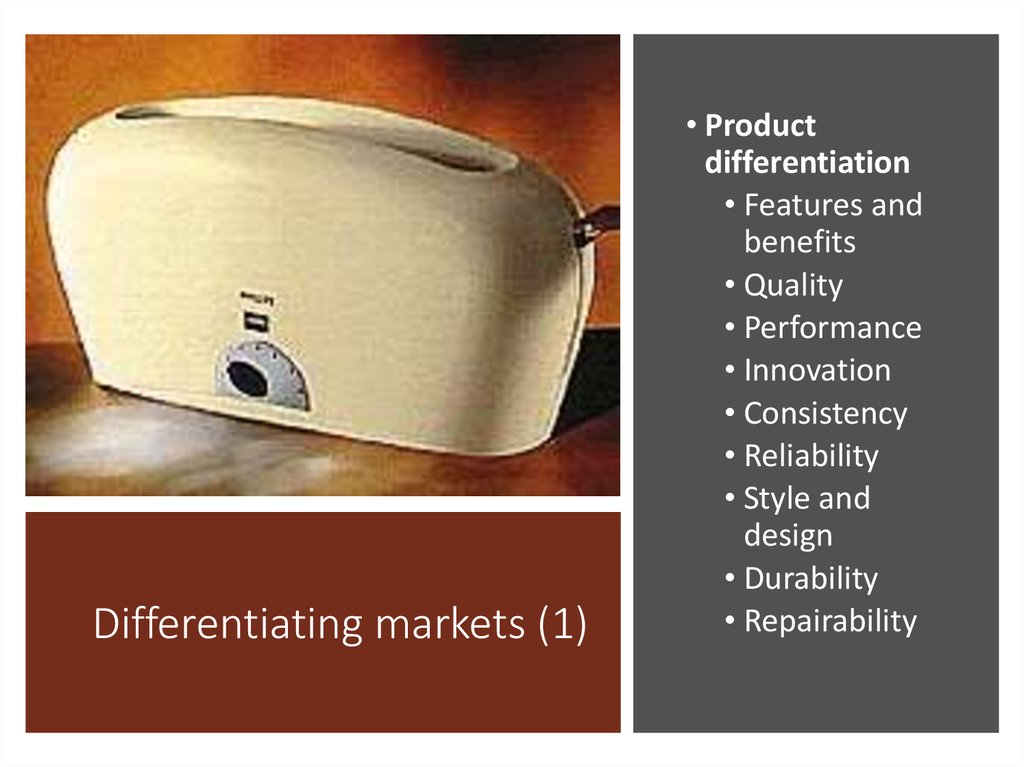
68. Differentiating markets (1)
• Productdifferentiation
• Features and
benefits
• Quality
• Performance
• Innovation
• Consistency
• Reliability
• Style and
design
• Durability
• Repairability
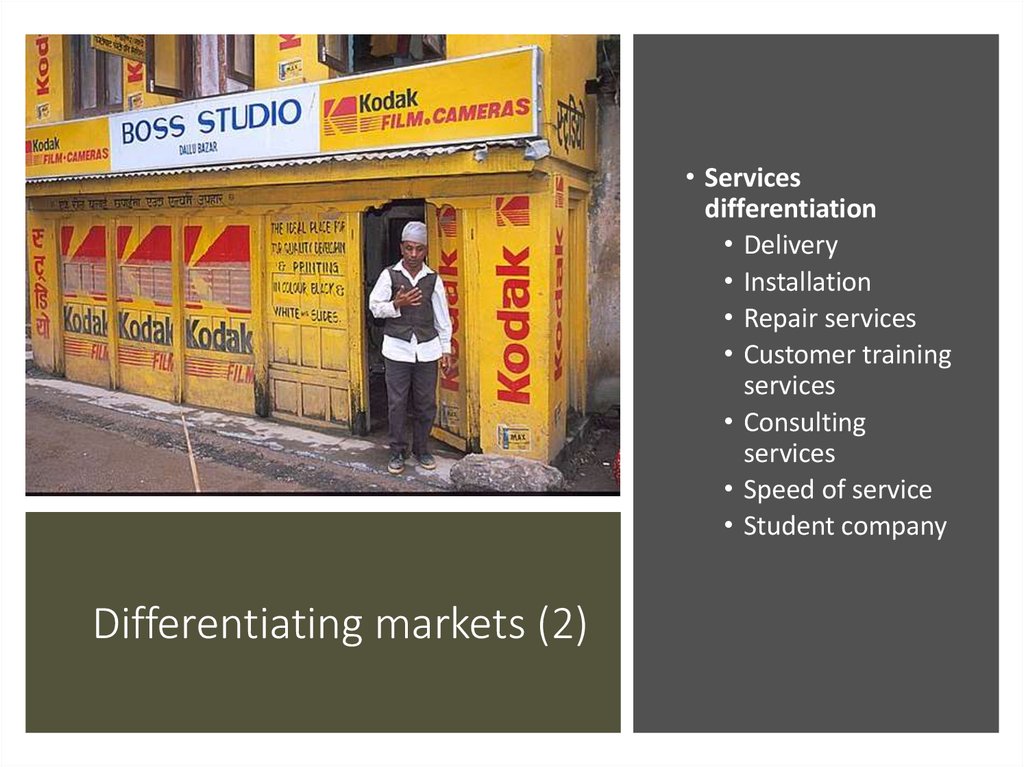
69. Differentiating markets (2)
• Servicesdifferentiation
• Delivery
• Installation
• Repair services
• Customer training
services
• Consulting
services
• Speed of service
• Student company
Differentiating markets (2)
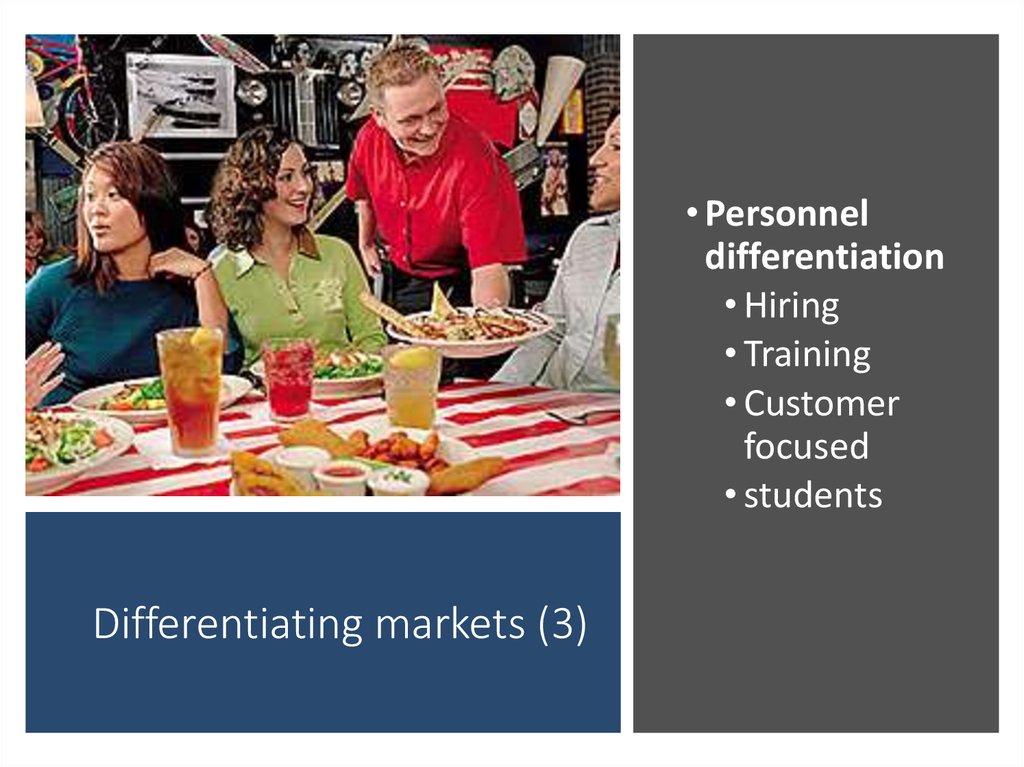
70. Differentiating markets (3)
• Personneldifferentiation
• Hiring
• Training
• Customer
focused
• students
Differentiating markets (3)
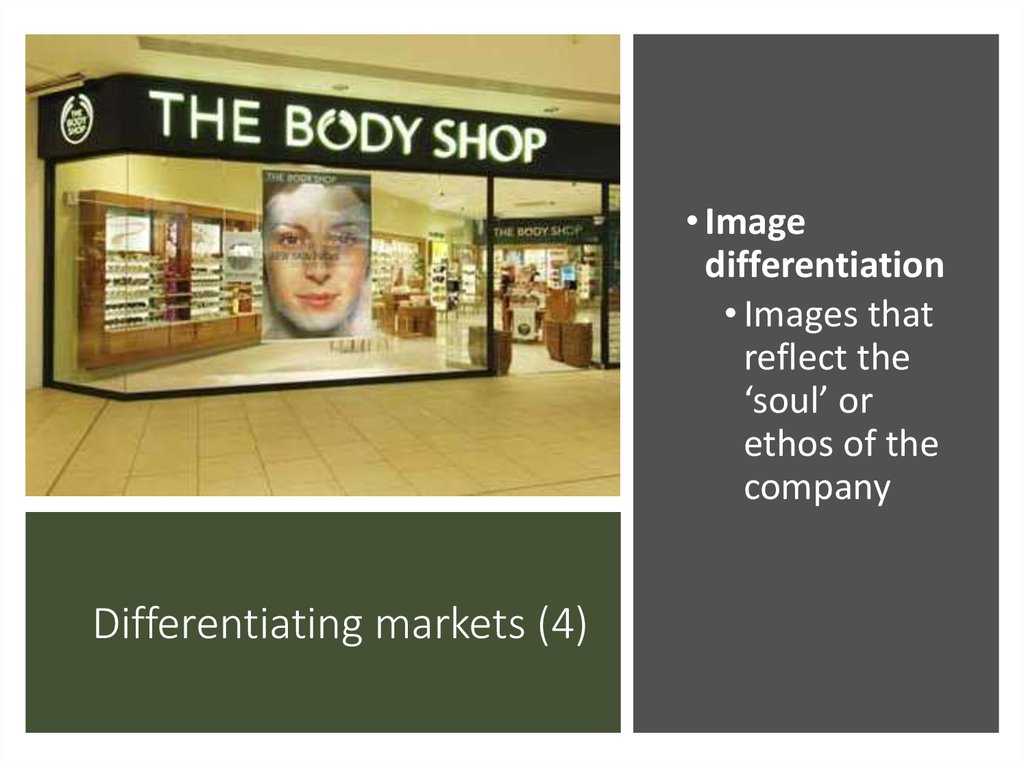
71. Differentiating markets (4)
• Imagedifferentiation
• Images that
reflect the
‘soul’ or
ethos of the
company
Differentiating markets (4)
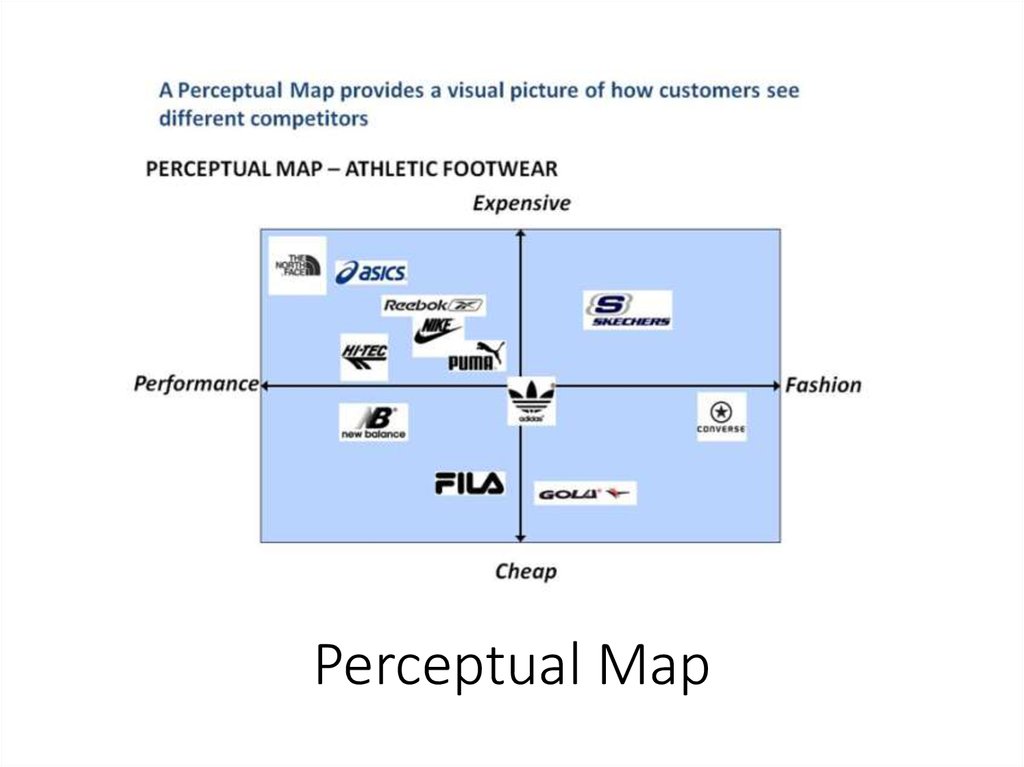
72.
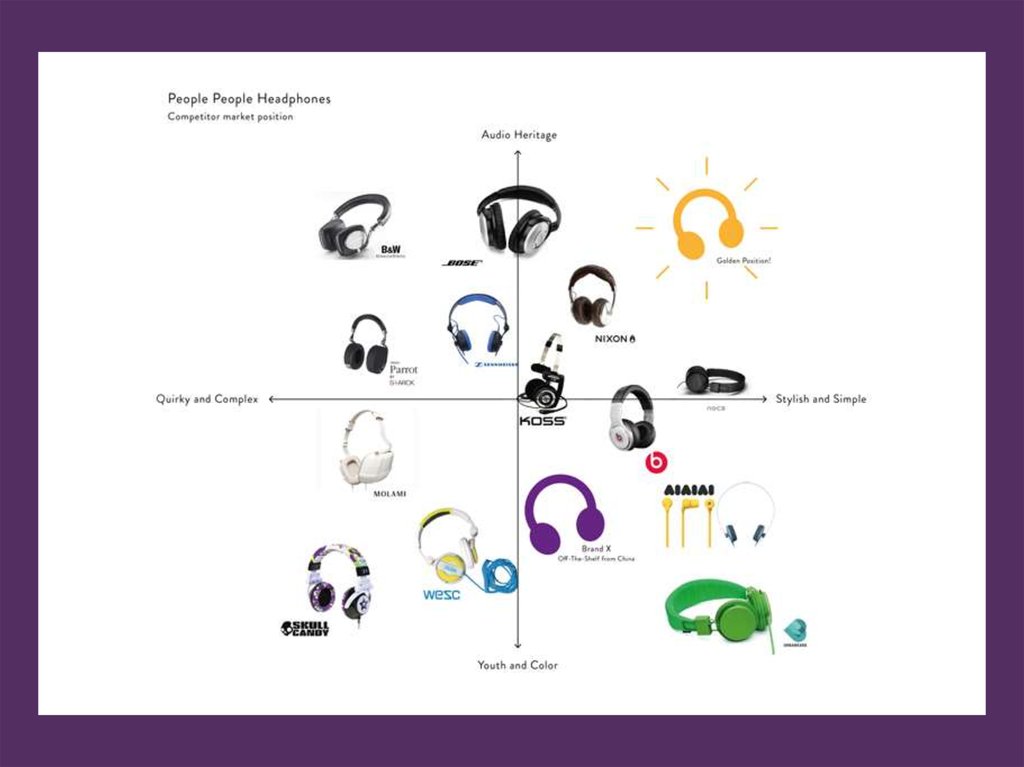
Perceptual Map73. Example Positioning
74. Perceptual Map
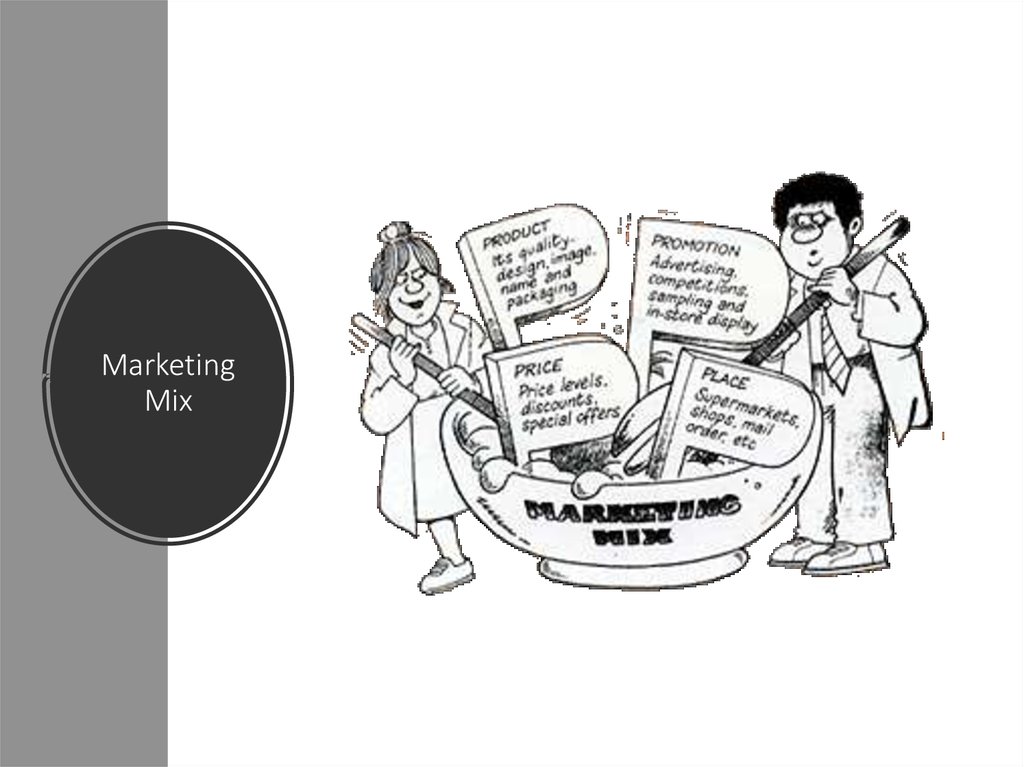
MarketingMix
75.
Product76. Marketing Mix
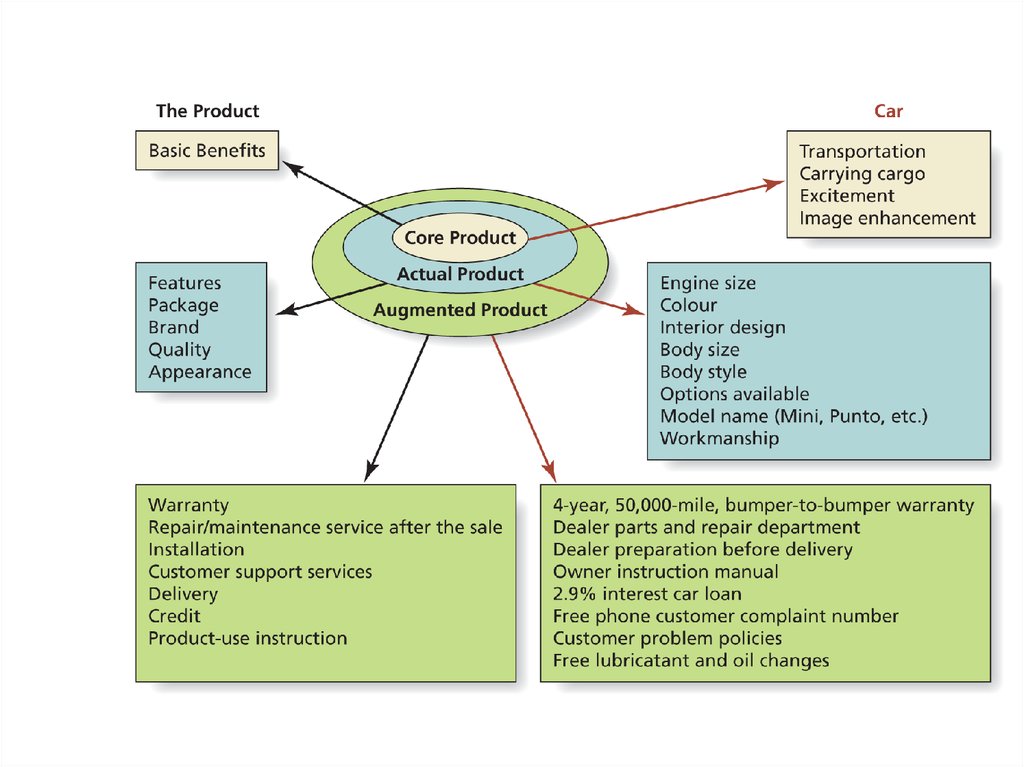
Layers of the product77. Product
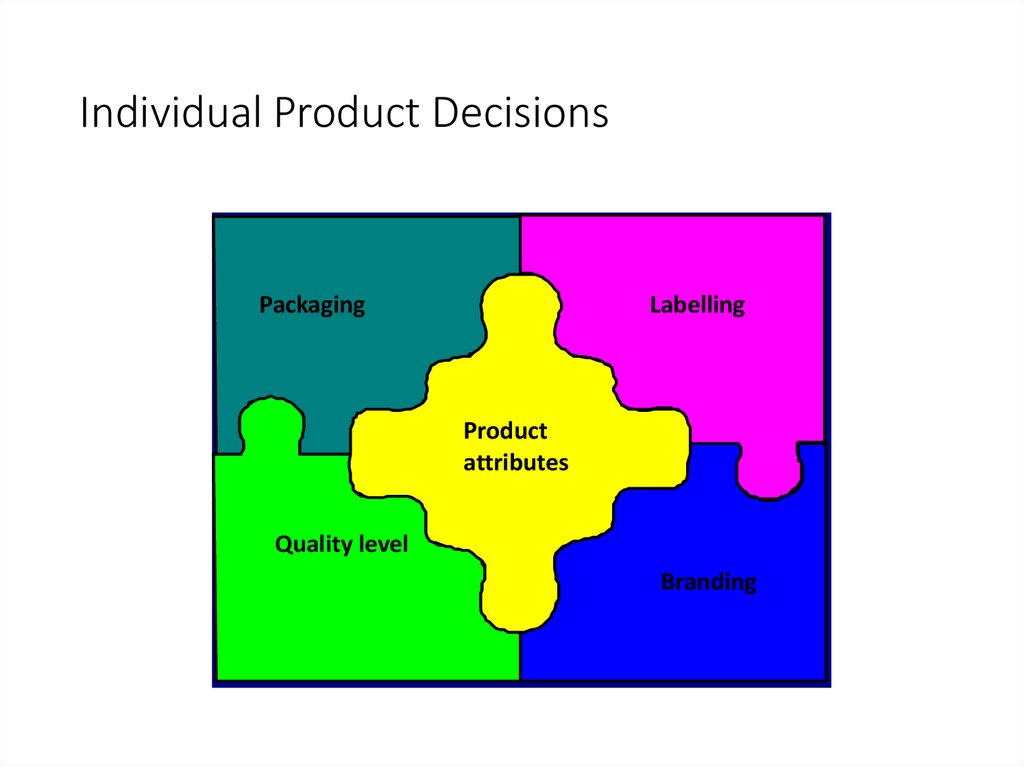
Individual Product DecisionsPackaging
Labelling
Product
attributes
Quality level
Branding
78.
8079. Individual Product Decisions
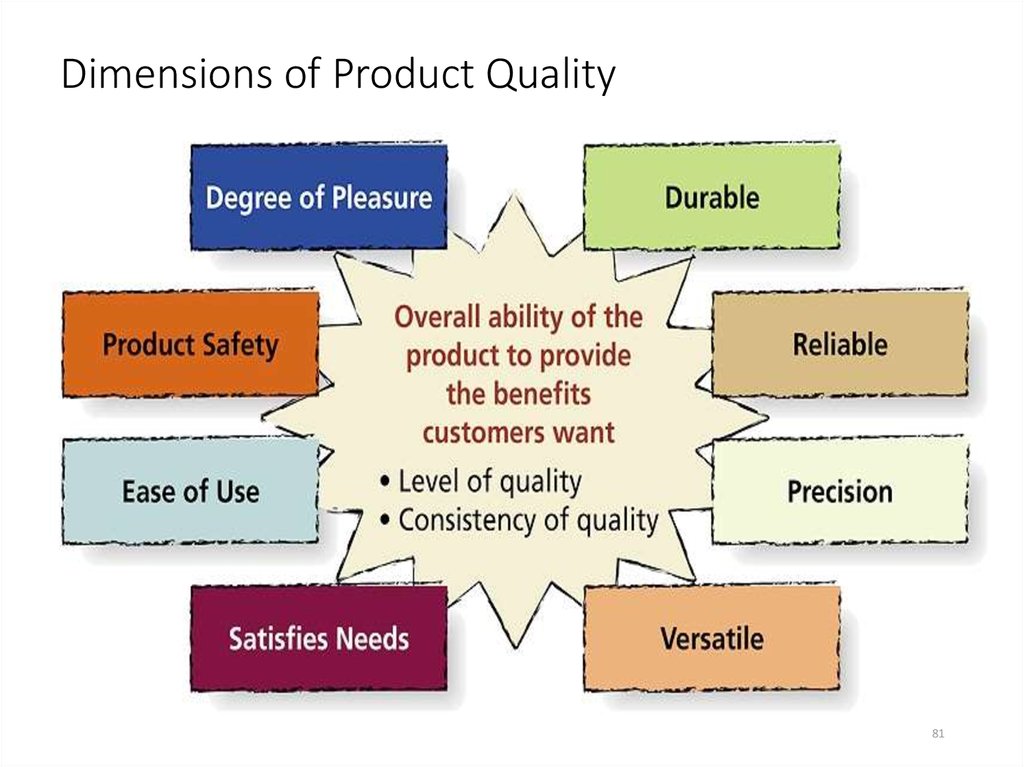
Dimensions of Product QualityFigure 9.4
81
80.
Product Attributes• Features as a tool for differentiation
• Value of features versus cost to company
• Style based solely on visual impact
– Does not make product perform better
• Design contributes to usefulness
81. Dimensions of Product Quality
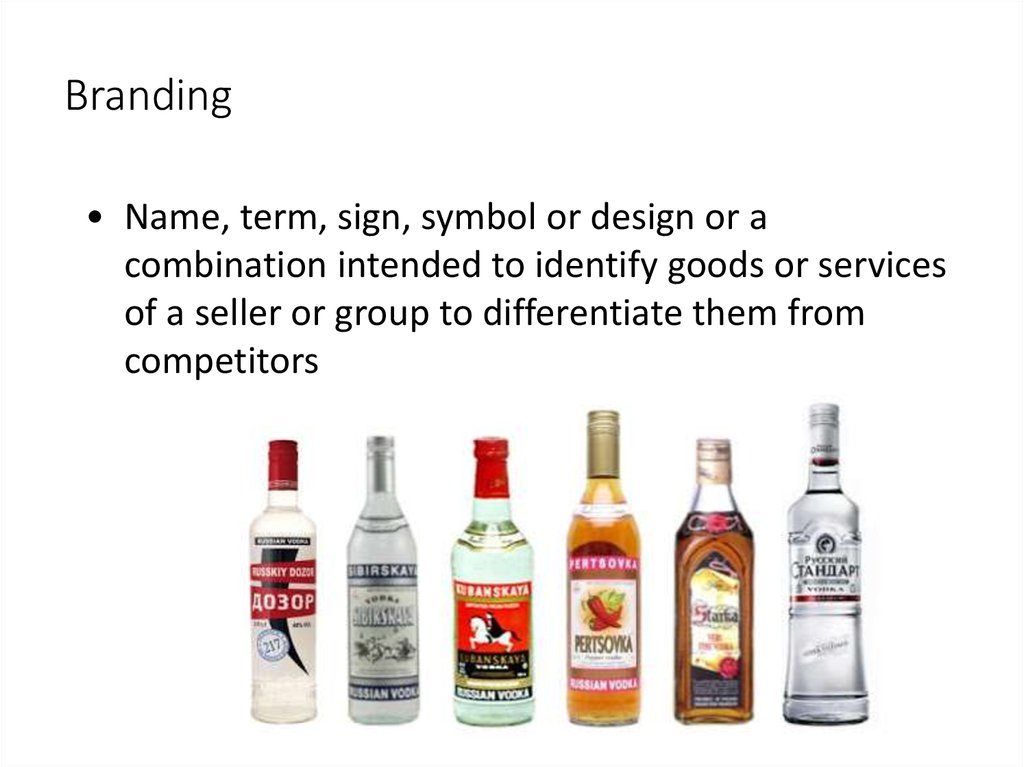
Branding• Name, term, sign, symbol or design or a
combination intended to identify goods or services
of a seller or group to differentiate them from
competitors
82. Product Attributes
Pricing83. Branding
PriceSet Price, Credit terms, payment period, discounts,
commissions
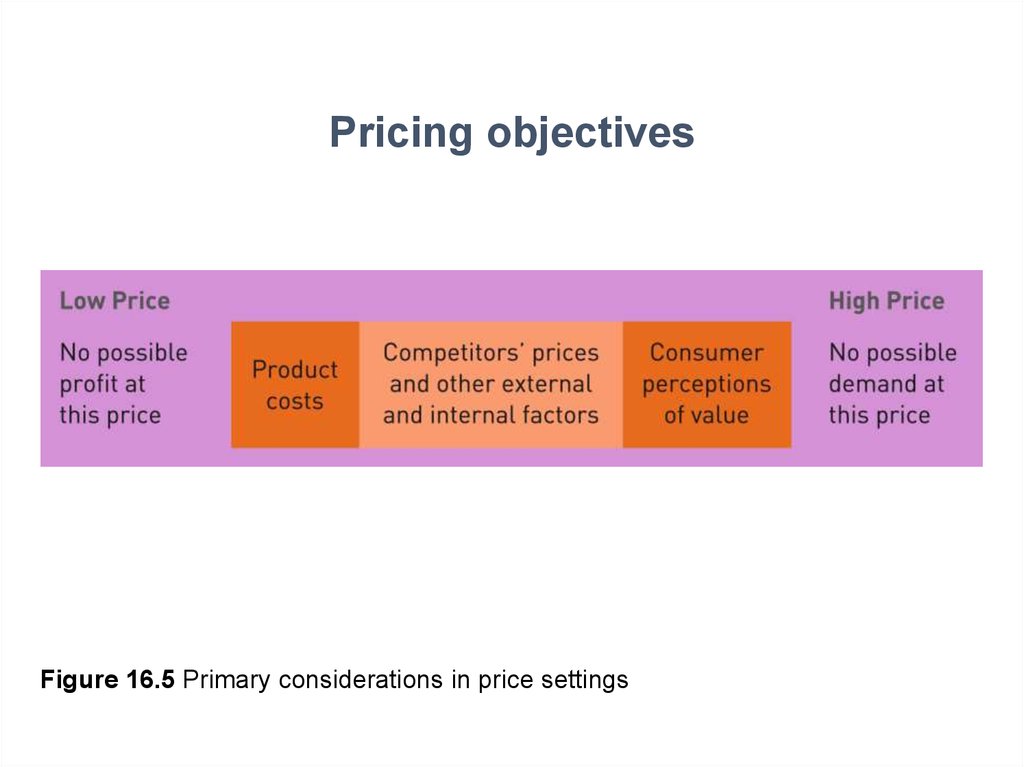
84. Pricing
objectivesFigure 16.5 Primary considerations in price settings
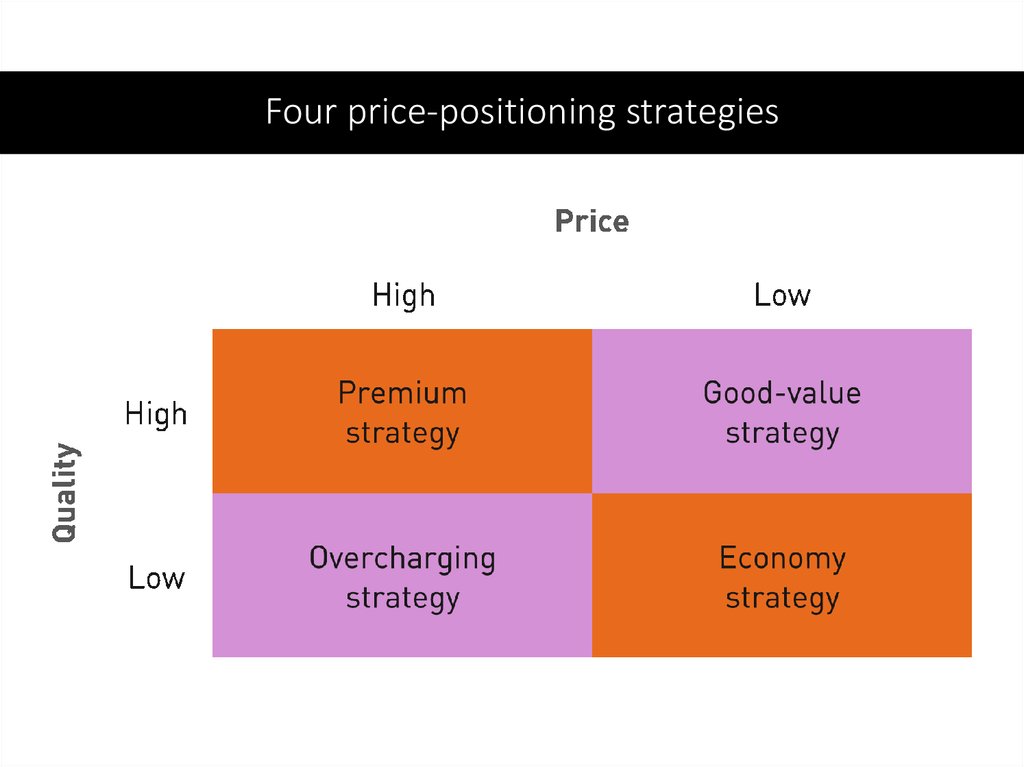
85. Price
Four price-positioning strategies86.
In marketingmix• What is your pricing Objective/
• Consumer price and retailer price
• Discounts possible ?
• Different prices senior, children, holidays
87.
Promotion88. In marketingmix
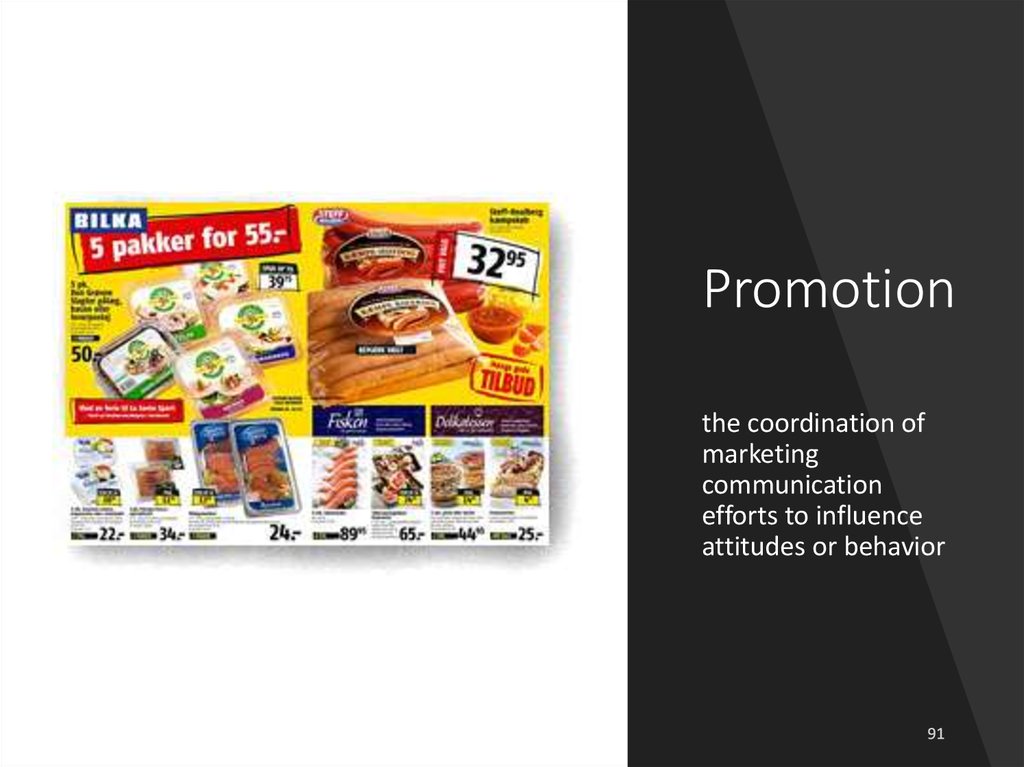
89. Promotion
the coordination ofmarketing
communication
efforts to influence
attitudes or behavior
90.
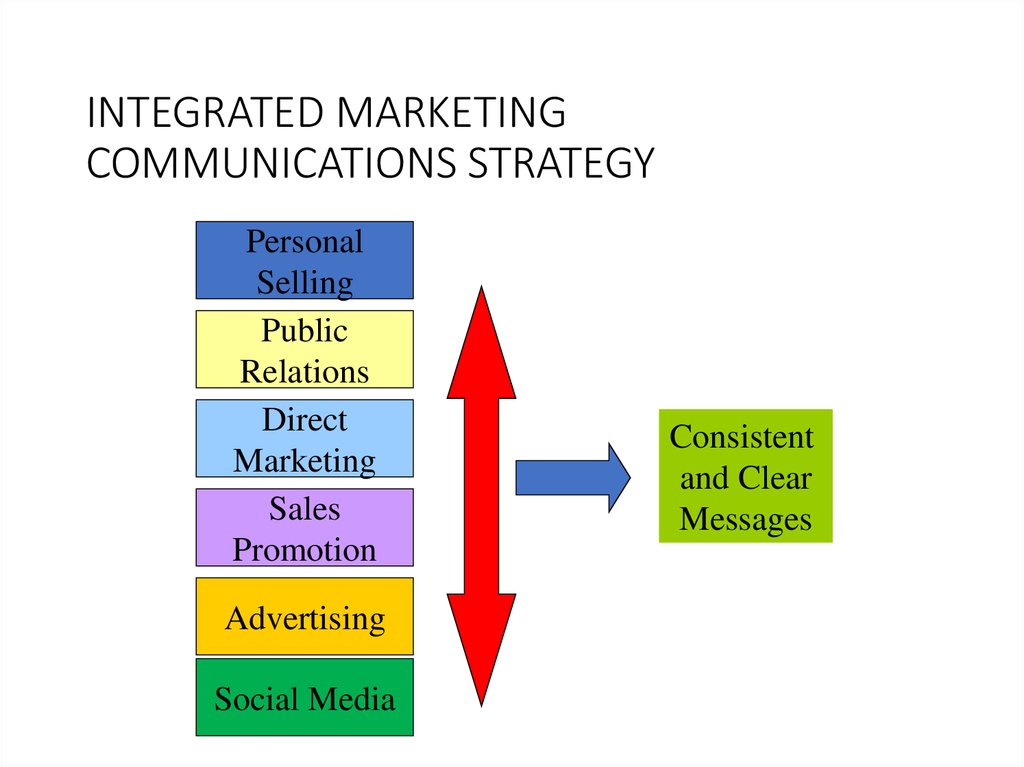
INTEGRATED MARKETINGCOMMUNICATIONS STRATEGY
Personal
Selling
Public
Relations
Direct
Marketing
Sales
Promotion
Advertising
Social Media
Consistent
and Clear
Messages
91. Promotion
MARKETINGCOMMUNICATIONS
MIX:
ADVERTISING
• Any paid form of non-personal presentation
and promotion of ideas, goods, or services
by an identified sponsor
92. INTEGRATED MARKETING COMMUNICATIONS STRATEGY
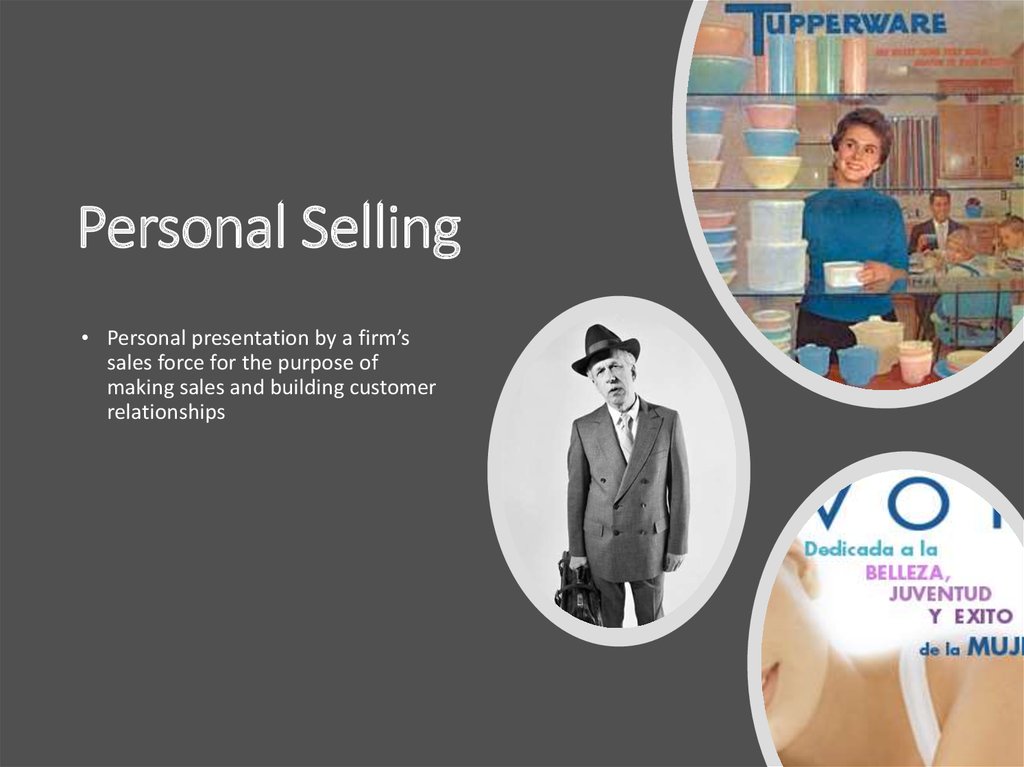
Personal Selling• Personal presentation by a firm’s
sales force for the purpose of
making sales and building customer
relationships
93. MARKETING COMMUNICATIONS MIX: ADVERTISING
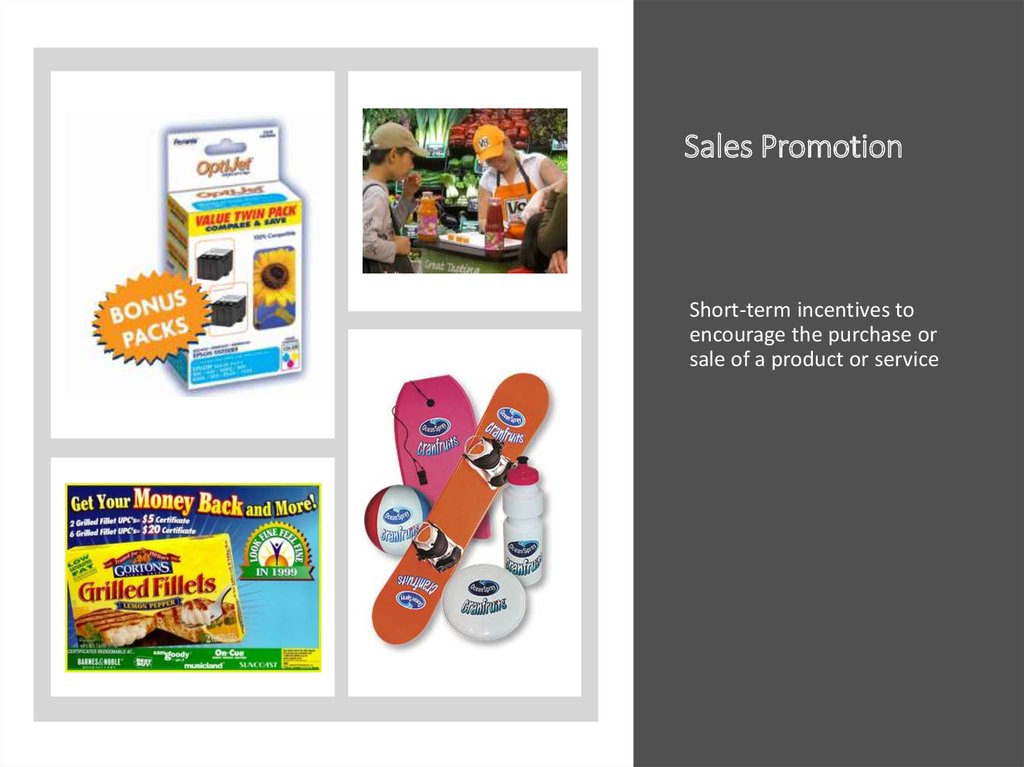
Sales PromotionShort-term incentives to
encourage the purchase or
sale of a product or service
94. Personal Selling
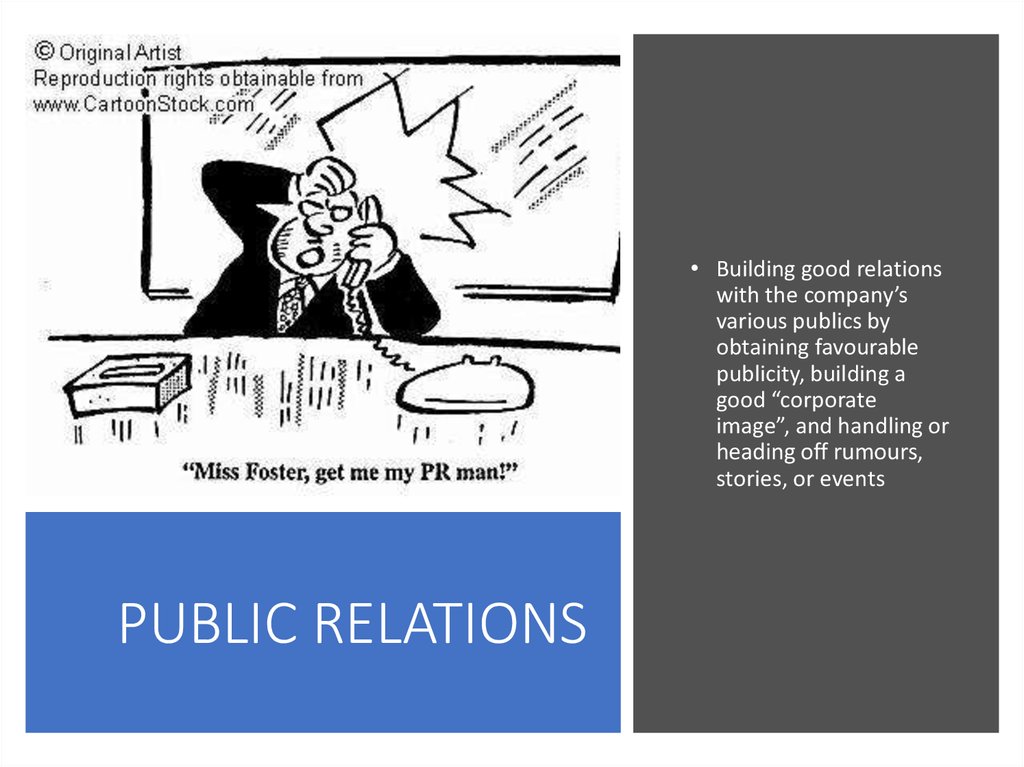
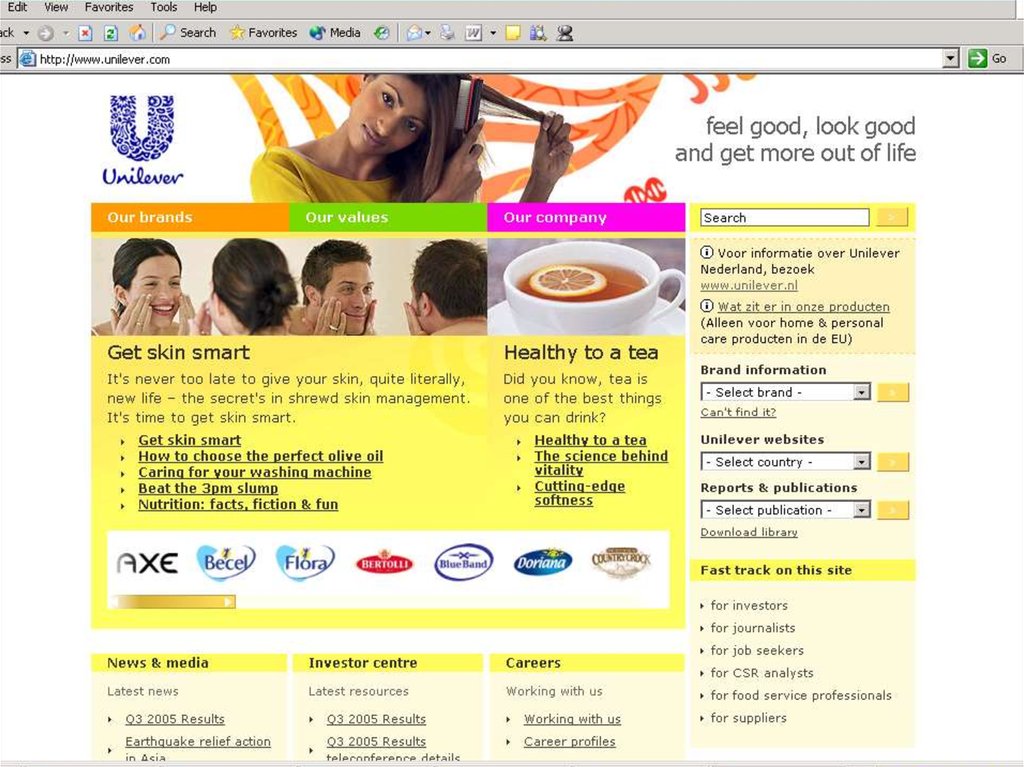
• Building good relationswith the company’s
various publics by
obtaining favourable
publicity, building a
good “corporate
image”, and handling or
heading off rumours,
stories, or events
PUBLIC RELATIONS
95. Sales Promotion
96. PUBLIC RELATIONS
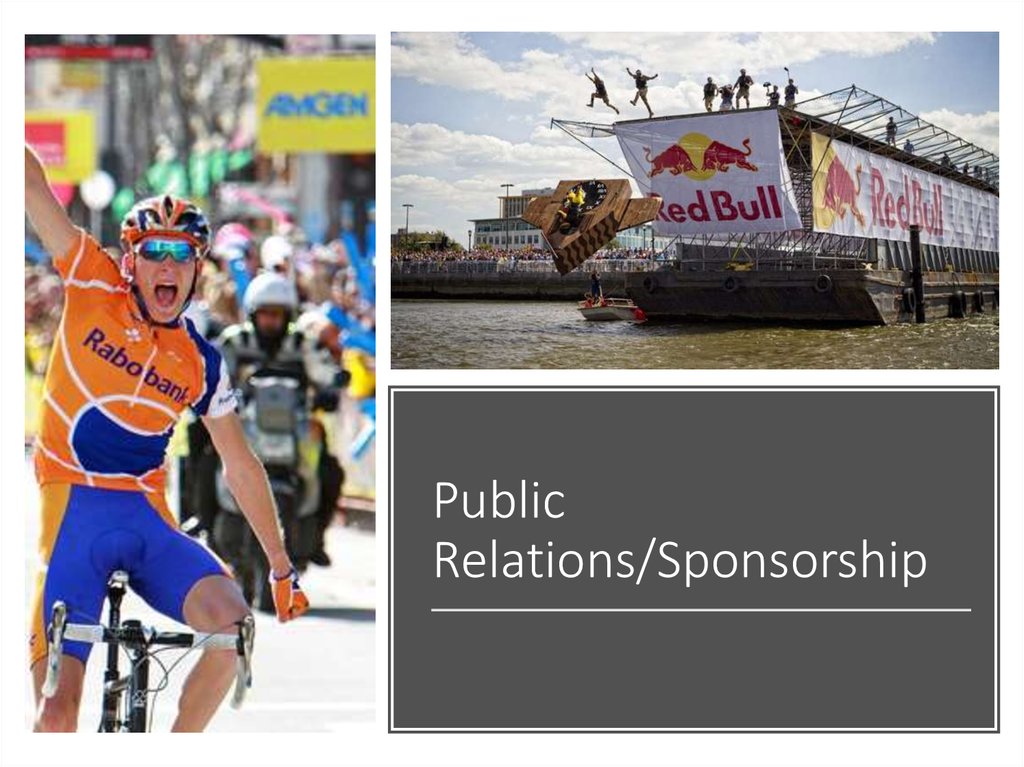
PublicRelations/Sponsorship
97.
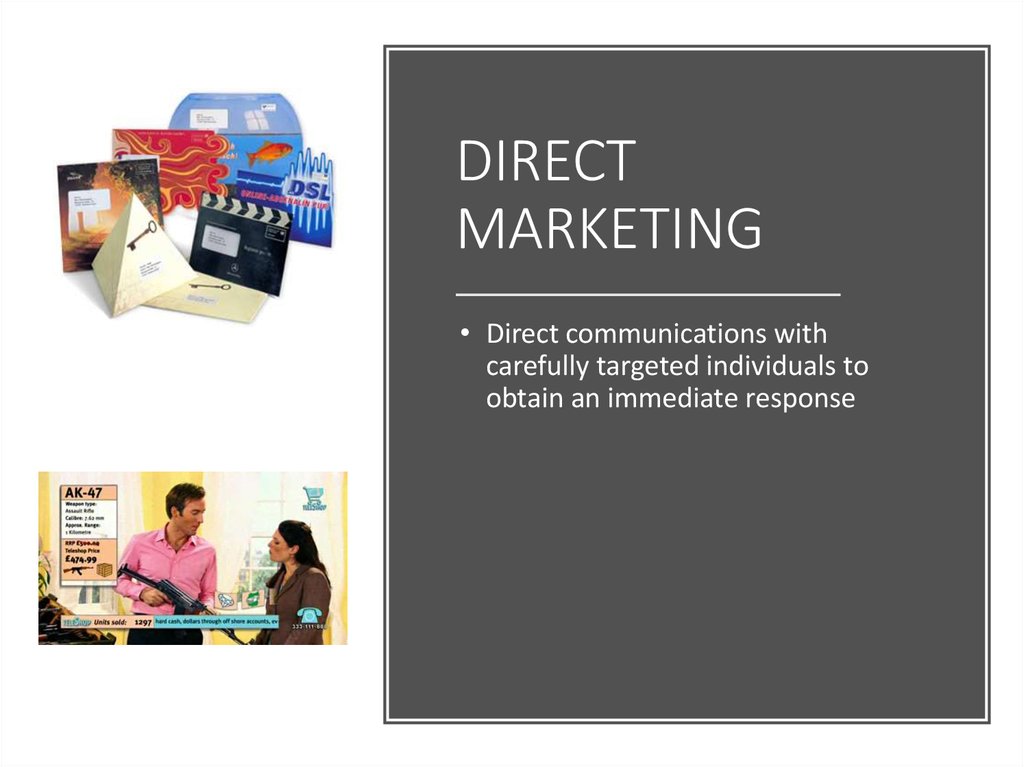
DIRECTMARKETING
• Direct communications with
carefully targeted individuals to
obtain an immediate response
98. Public Relations/Sponsorship
Social Media/Buzz Marketing12-100
99. DIRECT MARKETING
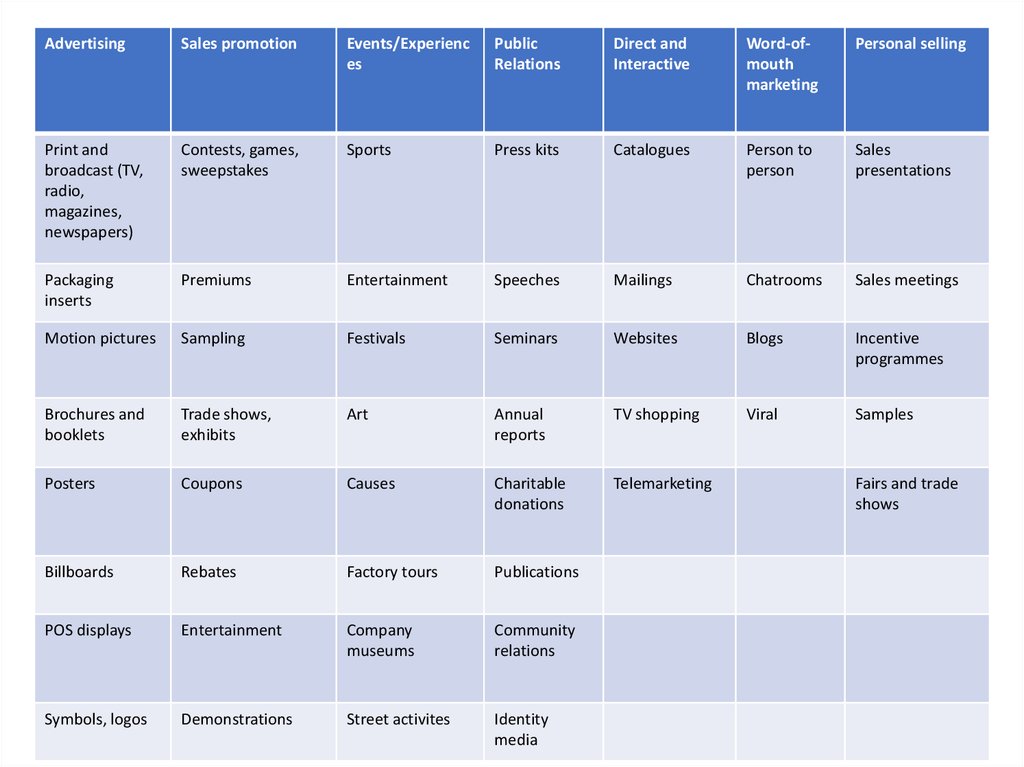
AdvertisingSales promotion
Events/Experienc
es
Public
Relations
Direct and
Interactive
Word-ofmouth
marketing
Personal selling
Print and
broadcast (TV,
radio,
magazines,
newspapers)
Contests, games,
sweepstakes
Sports
Press kits
Catalogues
Person to
person
Sales
presentations
Packaging
inserts
Premiums
Entertainment
Speeches
Mailings
Chatrooms
Sales meetings
Motion pictures
Sampling
Festivals
Seminars
Websites
Blogs
Incentive
programmes
Brochures and
booklets
Trade shows,
exhibits
Art
Annual
reports
TV shopping
Viral
Samples
Posters
Coupons
Causes
Charitable
donations
Telemarketing
Billboards
Rebates
Factory tours
Publications
POS displays
Entertainment
Company
museums
Community
relations
Symbols, logos
Demonstrations
Street activites
Identity
media
Fairs and trade
shows
100. Social Media/Buzz Marketing
Place (Distribution)101.
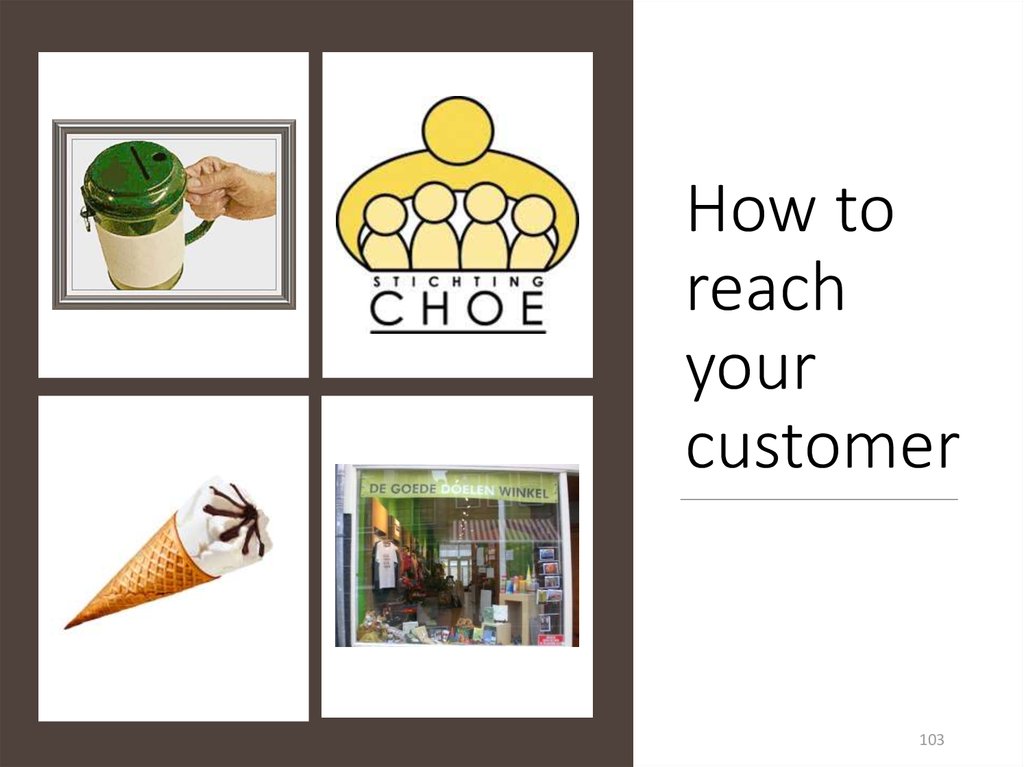
How toreach
your
customer
103
102. Place (Distribution)
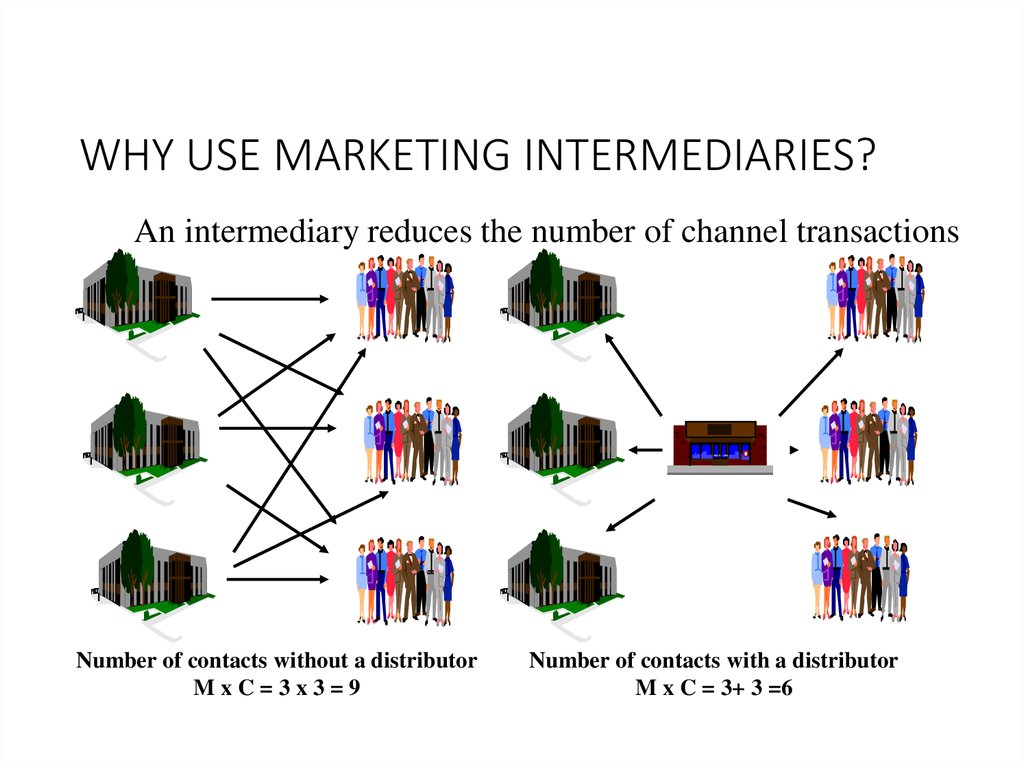
WHY USE MARKETING INTERMEDIARIES?An intermediary reduces the number of channel transactions
Number of contacts without a distributor
MxC=3x3=9
Number of contacts with a distributor
M x C = 3+ 3 =6
103. How to reach your customer
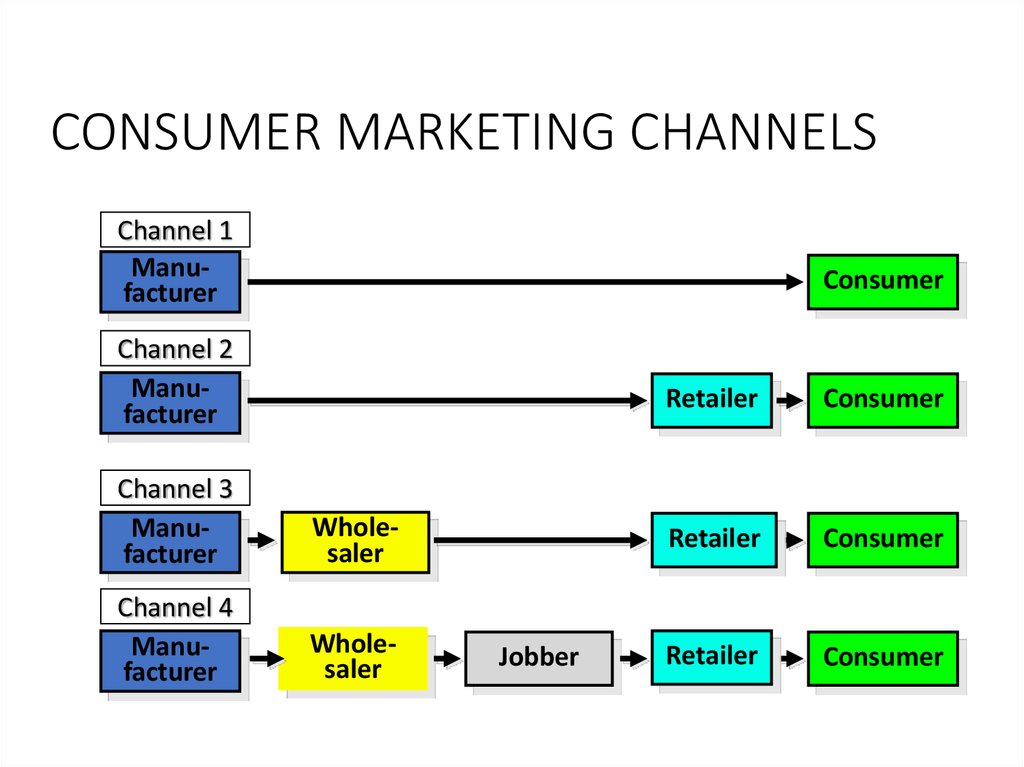
CONSUMER MARKETING CHANNELSChannel 1
Manufacturer
Consumer
Channel 2
Manufacturer
Channel 3
Manufacturer
Wholesaler
Channel 4
Manufacturer
Wholesaler
Jobber
Retailer
Consumer
Retailer
Consumer
Retailer
Consumer
104. WHY USE MARKETING INTERMEDIARIES?
105. CONSUMER MARKETING CHANNELS
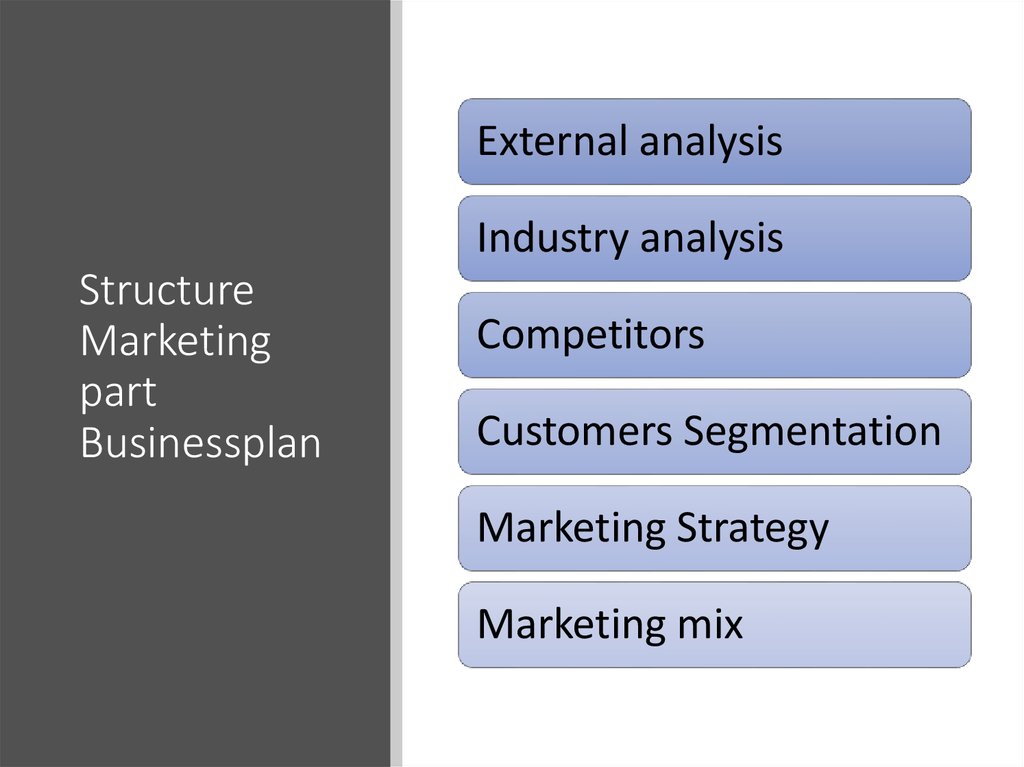
External analysisIndustry analysis
Structure
Marketing
part
Businessplan
Competitors
Customers Segmentation
Marketing Strategy
Marketing mix
106.
Financial Part Business Plan107. Structure Marketing part Businessplan
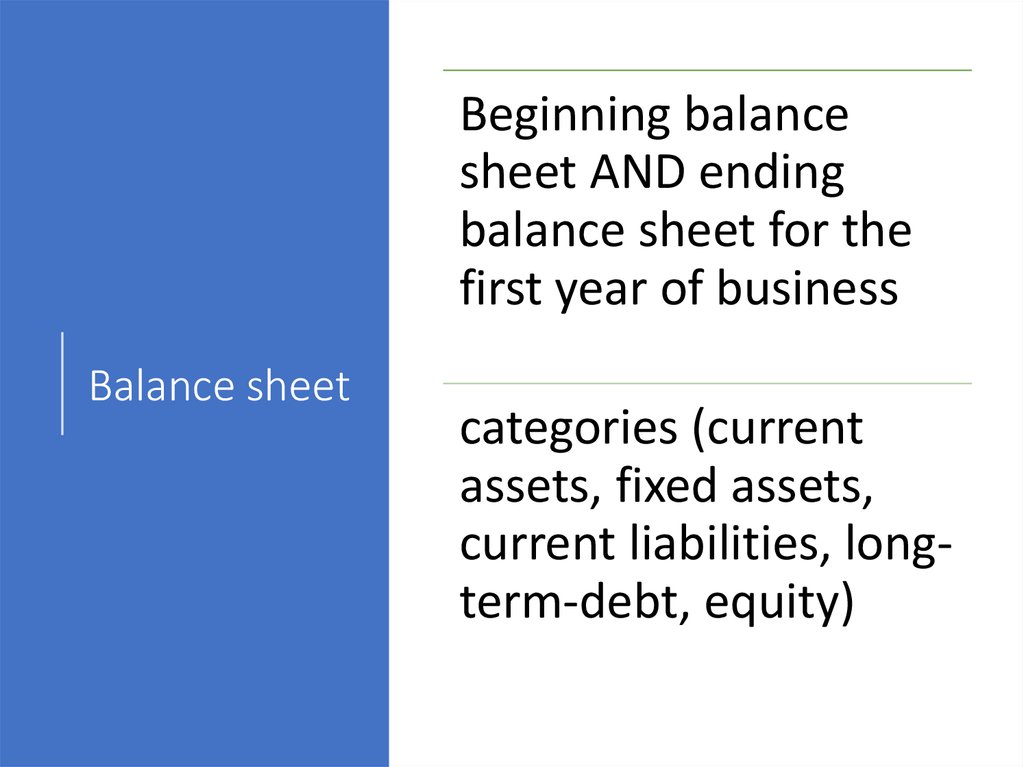
Beginning balancesheet AND ending
balance sheet for the
first year of business
Balance sheet
categories (current
assets, fixed assets,
current liabilities, longterm-debt, equity)
108. Financial Part Business Plan
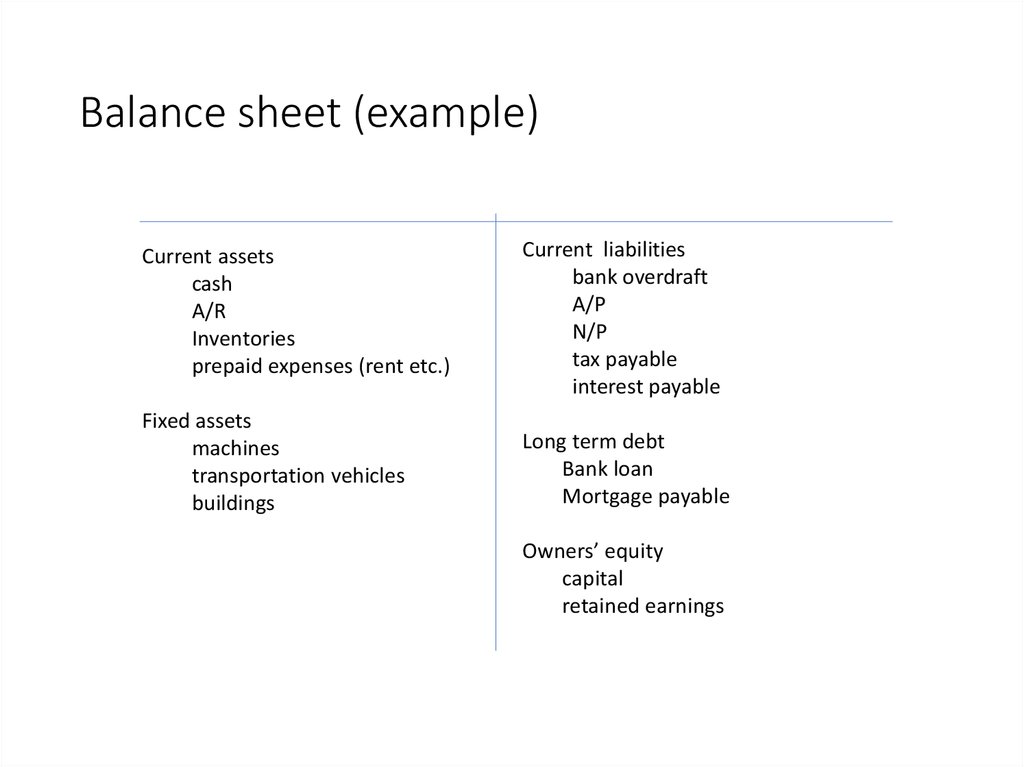
Balance sheet (example)Current assets
cash
A/R
Inventories
prepaid expenses (rent etc.)
Current liabilities
bank overdraft
A/P
N/P
tax payable
interest payable
Fixed assets
machines
transportation vehicles
buildings
Long term debt
Bank loan
Mortgage payable
Owners’ equity
capital
retained earnings
109. Balance sheet
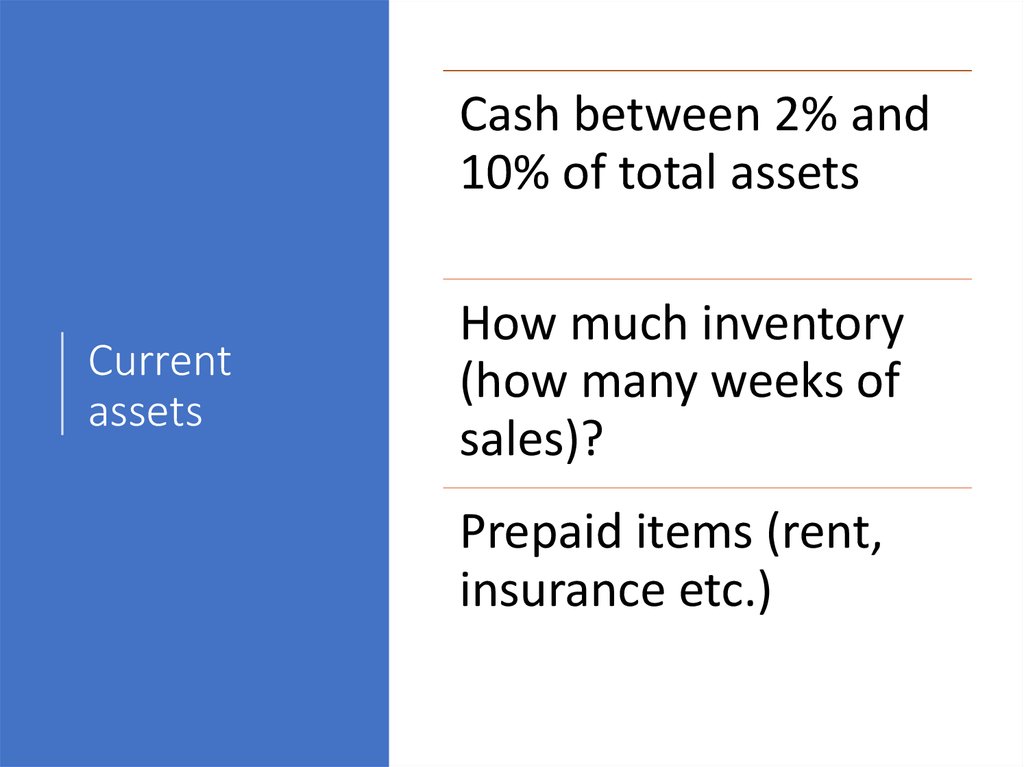
Cash between 2% and10% of total assets
Current
assets
How much inventory
(how many weeks of
sales)?
Prepaid items (rent,
insurance etc.)
110. Balance sheet (example)
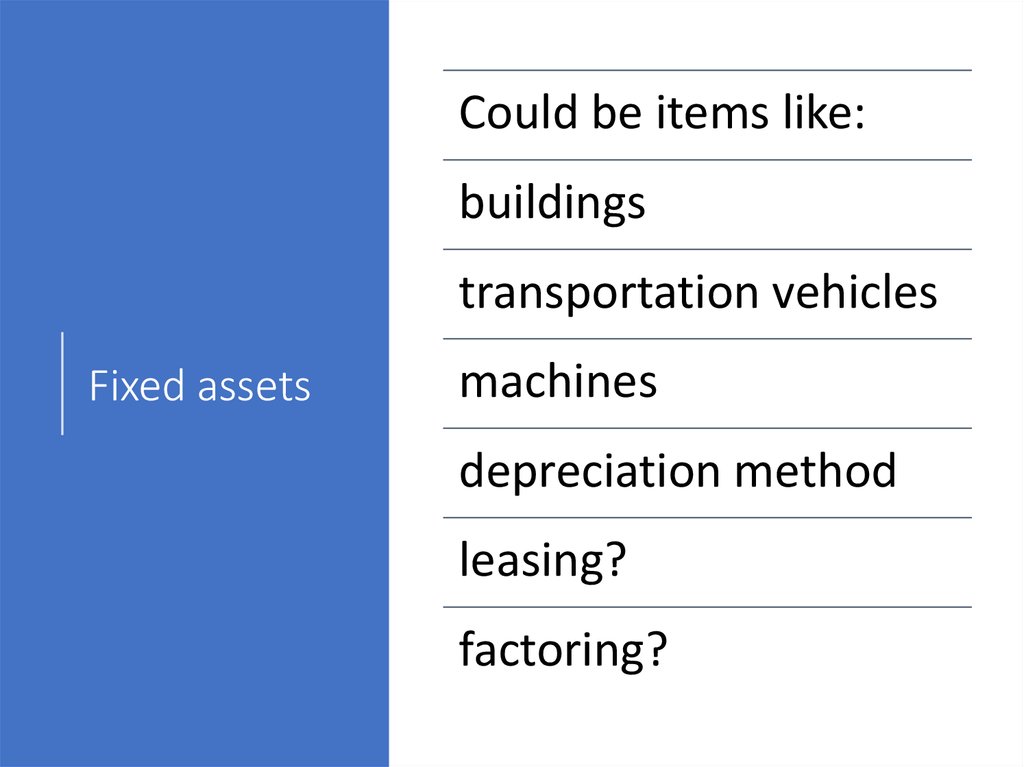
Could be items like:buildings
transportation vehicles
Fixed assets
machines
depreciation method
leasing?
factoring?
111. Current assets
A/P always less thaninventory
maybe bank overdraft
Current
liabilities
N/P (short term loans)
tax payable (from previous
period)
interest payable
112. Fixed assets
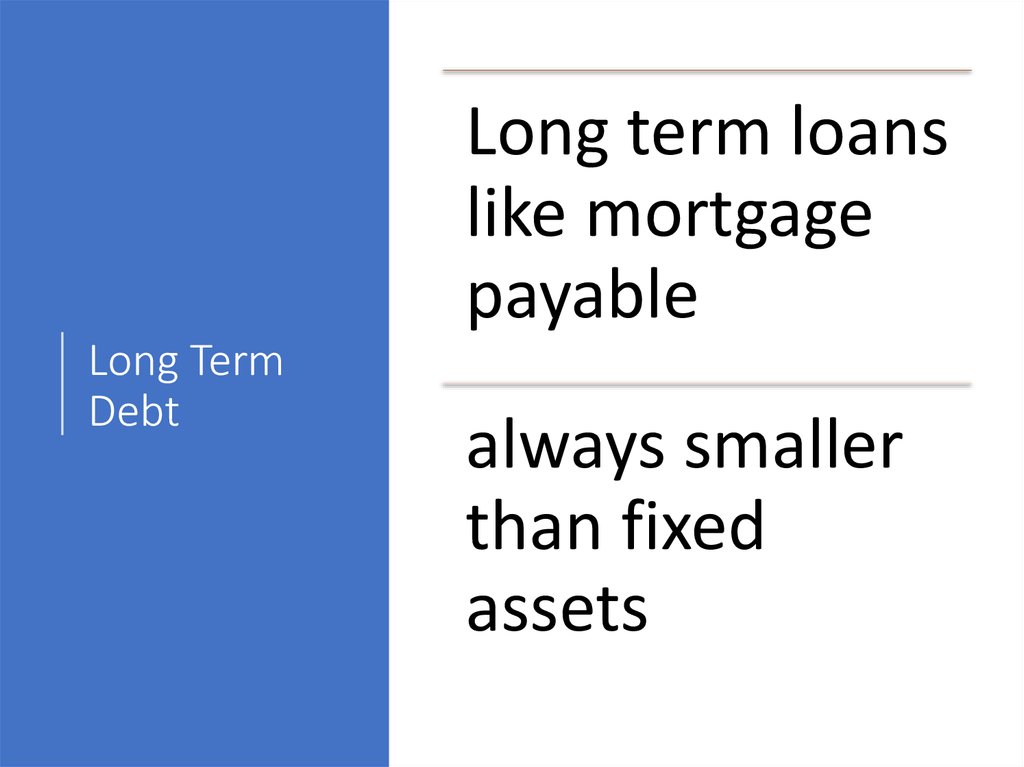
Long term loanslike mortgage
payable
Long Term
Debt
always smaller
than fixed
assets
113. Current liabilities
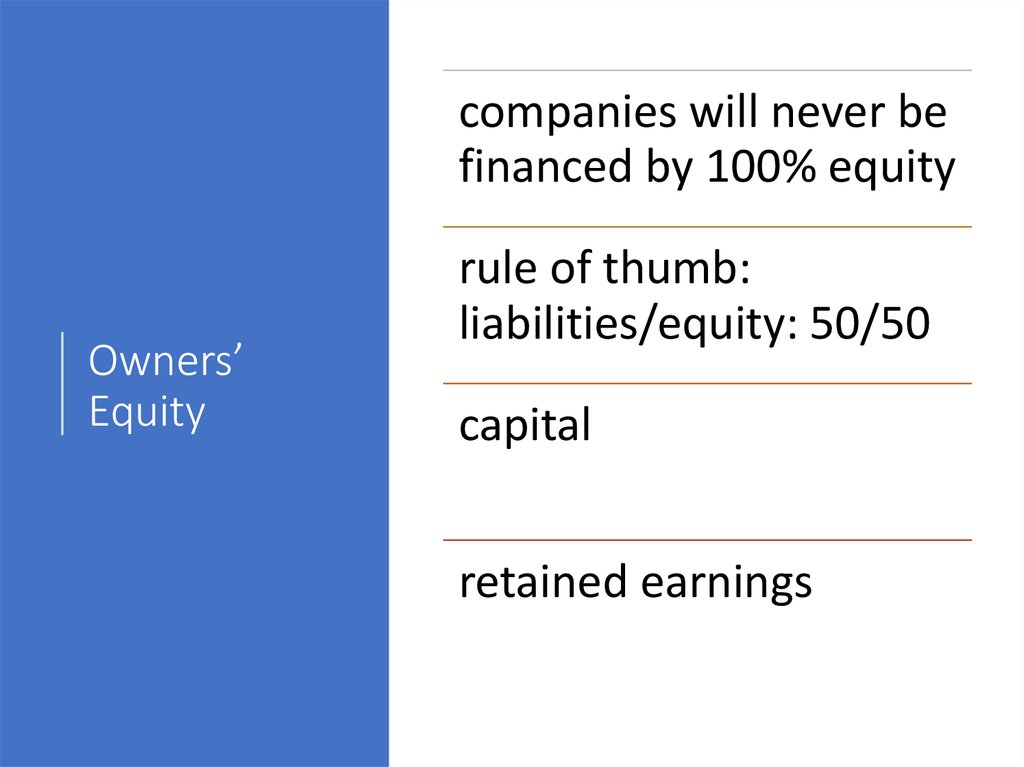
companies will never befinanced by 100% equity
Owners’
Equity
rule of thumb:
liabilities/equity: 50/50
capital
retained earnings
114. Long Term Debt
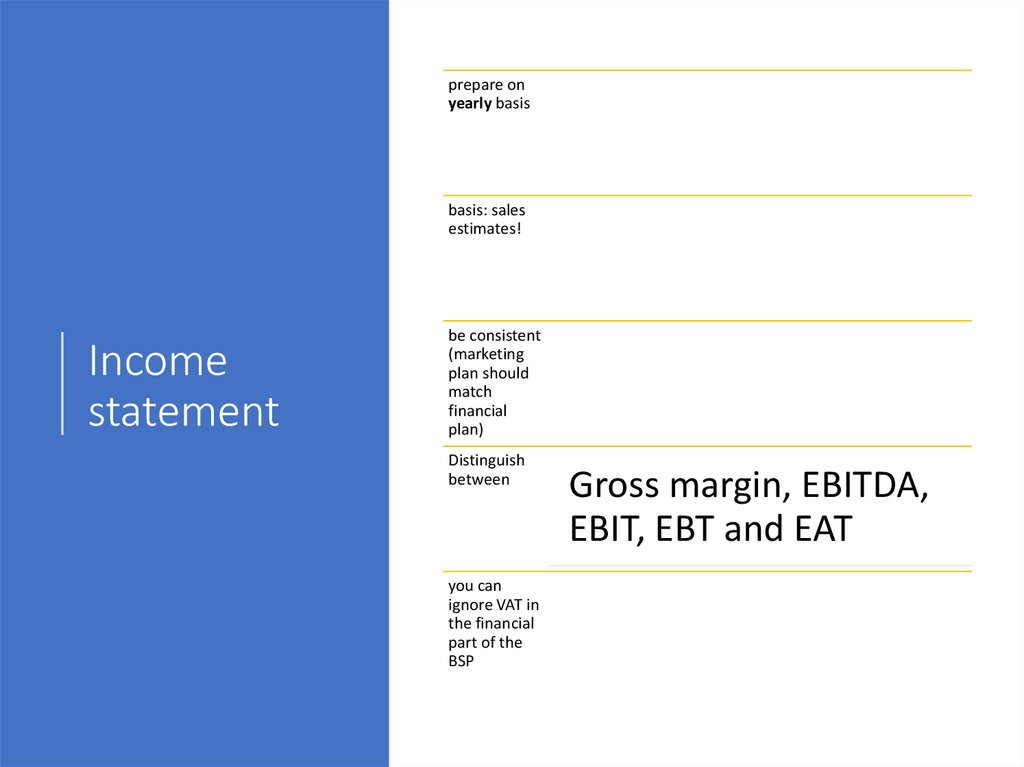
prepare onyearly basis
basis: sales
estimates!
Income
statement
be consistent
(marketing
plan should
match
financial
plan)
Distinguish
between
you can
ignore VAT in
the financial
part of the
BSP
Gross margin, EBITDA,
EBIT, EBT and EAT
115. Owners’ Equity
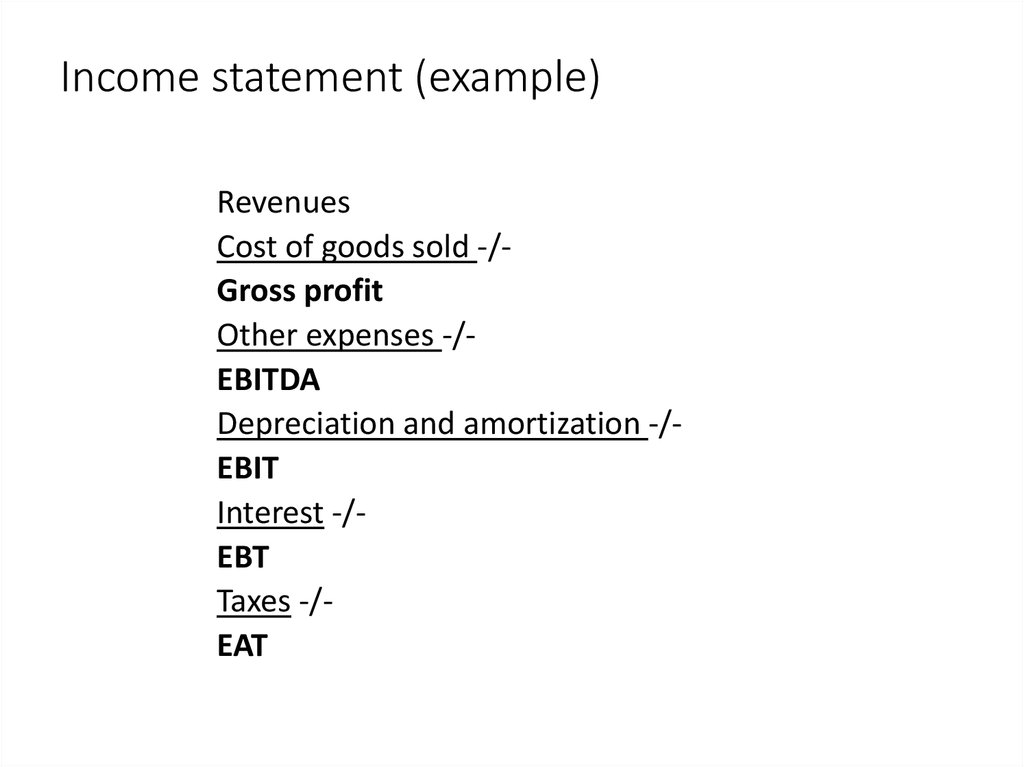
Income statement (example)Revenues
Cost of goods sold -/Gross profit
Other expenses -/EBITDA
Depreciation and amortization -/EBIT
Interest -/EBT
Taxes -/EAT
116. Income statement
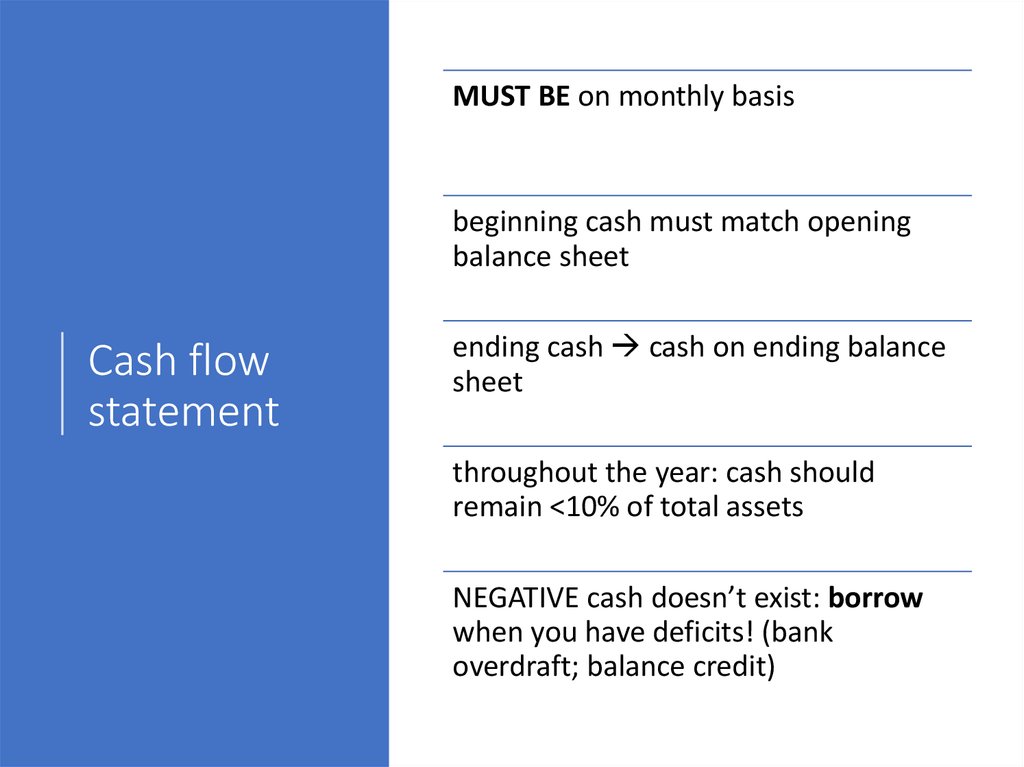
MUST BE on monthly basisbeginning cash must match opening
balance sheet
Cash flow
statement
ending cash cash on ending balance
sheet
throughout the year: cash should
remain <10% of total assets
NEGATIVE cash doesn’t exist: borrow
when you have deficits! (bank
overdraft; balance credit)
117. Income statement (example)
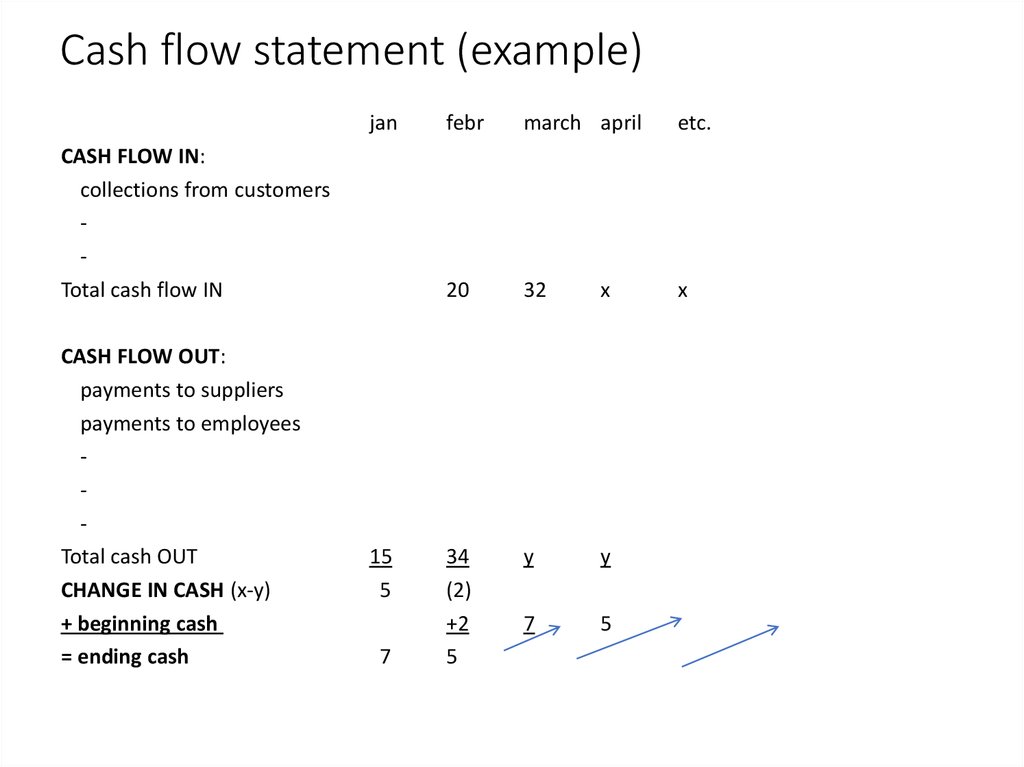
Cash flow statement (example)jan
CASH FLOW IN:
collections from customers
Total cash flow IN
CASH FLOW OUT:
payments to suppliers
payments to employees
Total cash OUT
CHANGE IN CASH (x-y)
+ beginning cash
= ending cash
15
5
7
febr
march april
etc.
20
32
x
x
34
(2)
+2
5
y
y
7
5
118. Cash flow statement
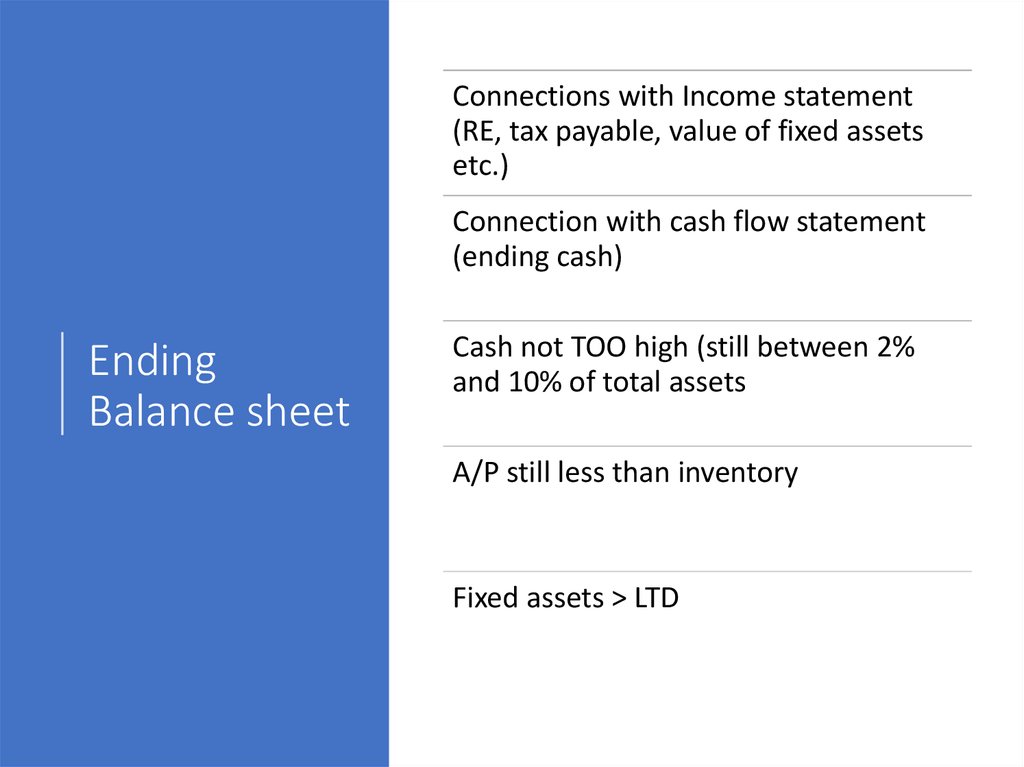
Connections with Income statement(RE, tax payable, value of fixed assets
etc.)
Connection with cash flow statement
(ending cash)
Ending
Balance sheet
Cash not TOO high (still between 2%
and 10% of total assets
A/P still less than inventory
Fixed assets > LTD
119. Cash flow statement (example)
LiquidityCurrent and/or quick ratio
Solvency
Ratios
Debt ratio, debt-to-equity ratio or other
measure
Profitability
ROA, ROE, Gross Profit%, Net Profit%
Find benchmarks (industry averages
etc)












 business


