


")
")
")
")


 business
Similar presentations:


Lenovo Group Limited
1. Lenovo Group Limited
Omarov Syrym2.
Lenovo Group Limited is a Chinese company thatproduces personal computers and other electronics. It is
the largest computer manufacturer in the world with a
market share of more than 20%, and also ranks fifth in the
production of mobile phones. The headquarters of Lenovo
is located in Beijing, a registered company in Hong Kong.
3.
4.
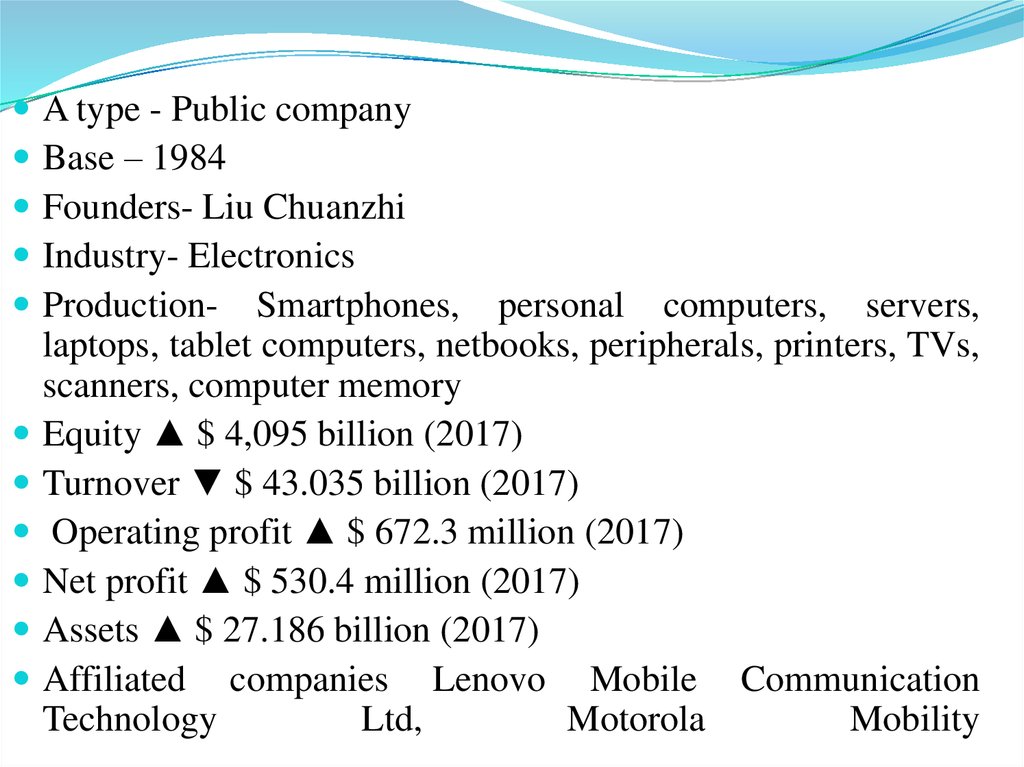
A type - Public companyBase – 1984
Founders- Liu Chuanzhi
Industry- Electronics
Production- Smartphones, personal computers, servers,
laptops, tablet computers, netbooks, peripherals, printers, TVs,
scanners, computer memory
Equity ▲ $ 4,095 billion (2017)
Turnover ▼ $ 43.035 billion (2017)
Operating profit ▲ $ 672.3 million (2017)
Net profit ▲ $ 530.4 million (2017)
Assets ▲ $ 27.186 billion (2017)
Affiliated companies Lenovo Mobile Communication
Technology
Ltd,
Motorola
Mobility
5.
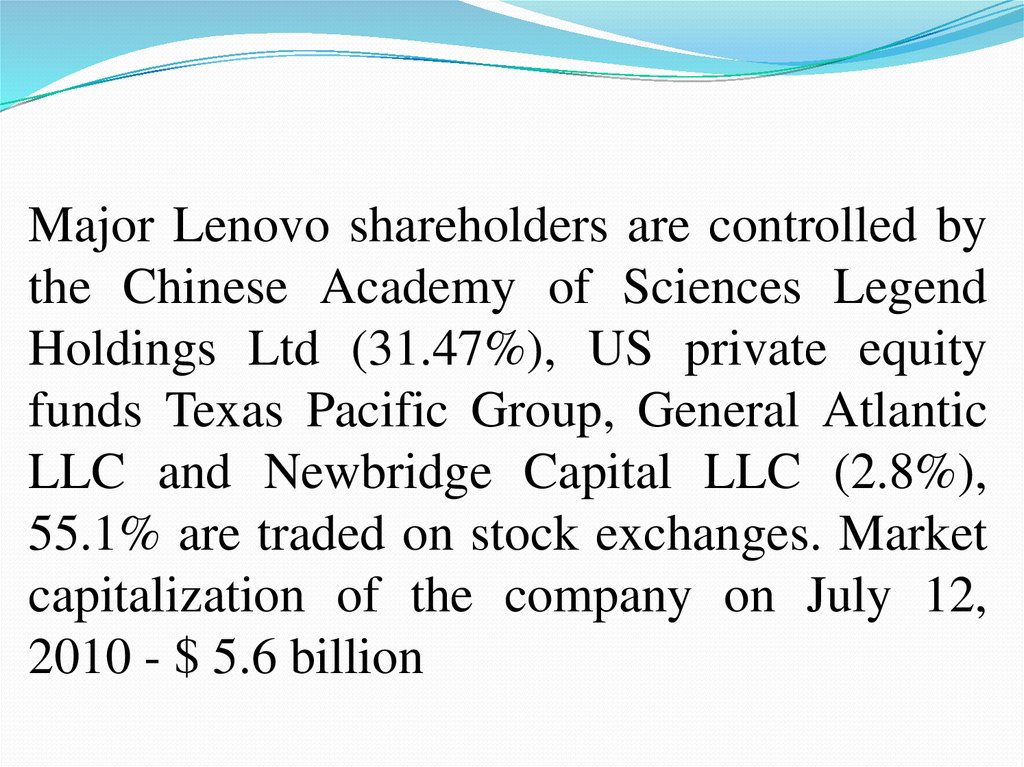
Major Lenovo shareholders are controlled bythe Chinese Academy of Sciences Legend
Holdings Ltd (31.47%), US private equity
funds Texas Pacific Group, General Atlantic
LLC and Newbridge Capital LLC (2.8%),
55.1% are traded on stock exchanges. Market
capitalization of the company on July 12,
2010 - $ 5.6 billion
6.
The company has more than 5,500 patentsworldwide. In addition, Lenovo hit the top 30
innovative companies by the magazine
BusinessWeek in 2010 and the top 10 most
environmentally friendly companies by the Forbes
magazine in 2011. Lenovo was recognized as one
of the world's leaders in reputation according to a
global survey conducted by the RepTrak 100
Reputation Institute in 2011, and also entered the
top 50 most wanted employers in the world from
the perspective of students, according to a study
by the Universum rating agency in 2011
7. CONSOLIDATED BALANCE SHEET
Non-current assets2017
US$’000
2016
US$’000
Property, plant and equipment
Prepaid lease payments
Construction-in-progress
Intangible assets
Interests in associates and joint ventures
Deferred income tax assets
Available-for-sale financial assets
Other non-current assets
1,236,250
473,090
413,160
8,349,145
32,567
1,435,256
255,898
122,221
1,391,494
337,929
231,110
8,661,087
40,439
1,000,572
139,572
164,410
12,317,587
11,966,613
8.
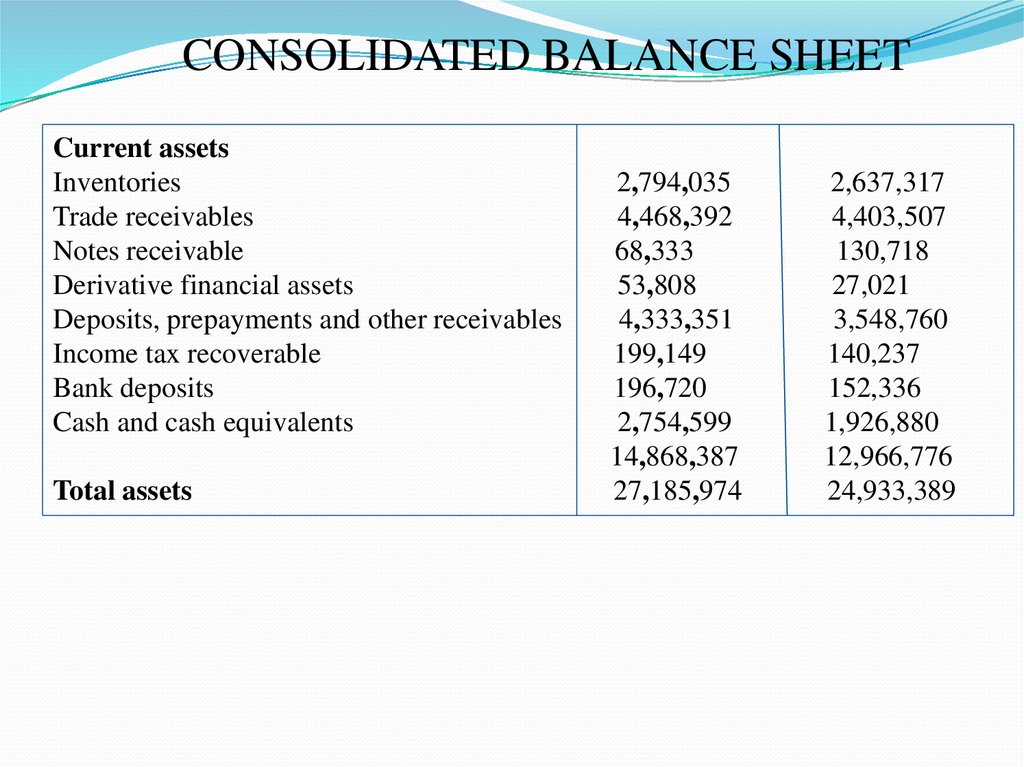
CONSOLIDATED BALANCE SHEETCurrent assets
Inventories
Trade receivables
Notes receivable
Derivative financial assets
Deposits, prepayments and other receivables
Income tax recoverable
Bank deposits
Cash and cash equivalents
Total assets
2,794,035
4,468,392
68,333
53,808
4,333,351
199,149
196,720
2,754,599
14,868,387
27,185,974
2,637,317
4,403,507
130,718
27,021
3,548,760
140,237
152,336
1,926,880
12,966,776
24,933,389
9.
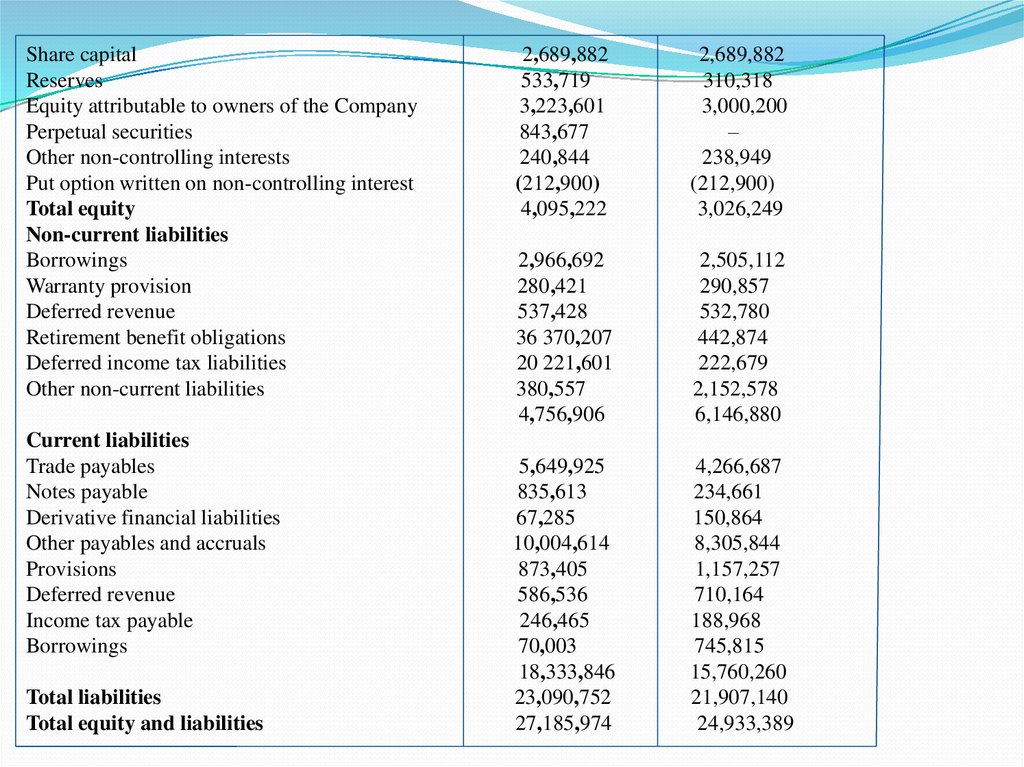
Share capitalReserves
Equity attributable to owners of the Company
Perpetual securities
Other non-controlling interests
Put option written on non-controlling interest
Total equity
Non-current liabilities
Borrowings
Warranty provision
Deferred revenue
Retirement benefit obligations
Deferred income tax liabilities
Other non-current liabilities
Current liabilities
Trade payables
Notes payable
Derivative financial liabilities
Other payables and accruals
Provisions
Deferred revenue
Income tax payable
Borrowings
Total liabilities
Total equity and liabilities
2,689,882
533,719
3,223,601
843,677
240,844
(212,900)
4,095,222
2,689,882
310,318
3,000,200
–
238,949
(212,900)
3,026,249
2,966,692
280,421
537,428
36 370,207
20 221,601
380,557
4,756,906
2,505,112
290,857
532,780
442,874
222,679
2,152,578
6,146,880
5,649,925
835,613
67,285
10,004,614
873,405
586,536
246,465
70,003
18,333,846
23,090,752
27,185,974
4,266,687
234,661
150,864
8,305,844
1,157,257
710,164
188,968
745,815
15,760,260
21,907,140
24,933,389
10.
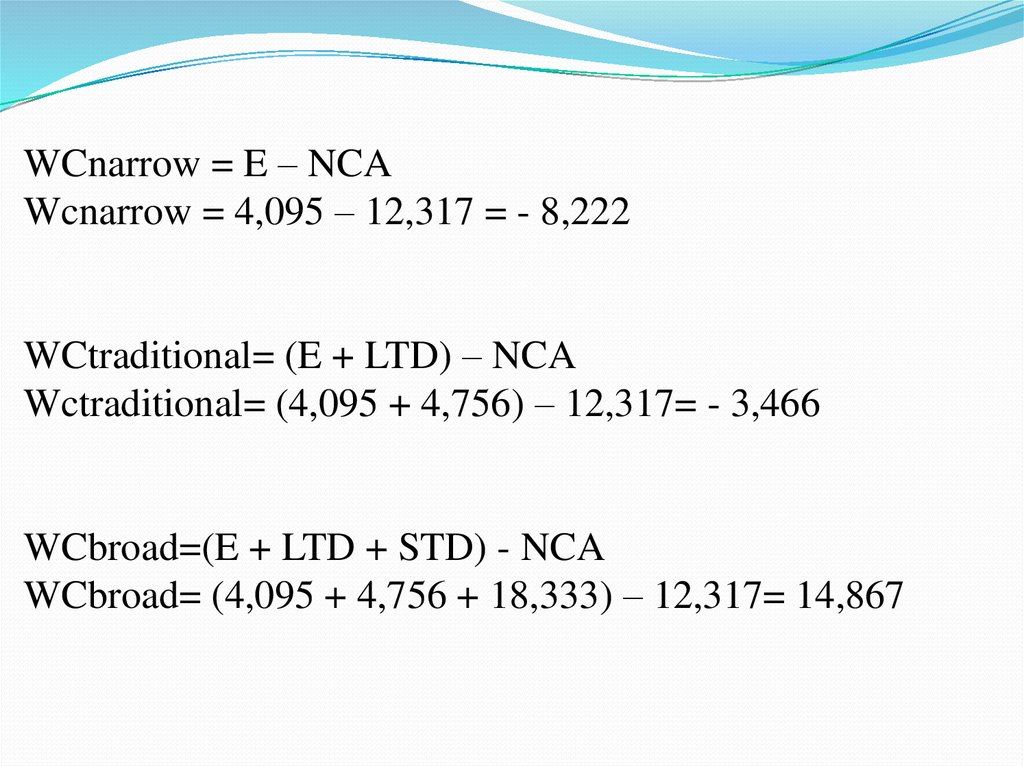
WCnarrow = E – NCAWcnarrow = 4,095 – 12,317 = - 8,222
WCtraditional= (E + LTD) – NCA
Wctraditional= (4,095 + 4,756) – 12,317= - 3,466
WCbroad=(E + LTD + STD) - NCA
WCbroad= (4,095 + 4,756 + 18,333) – 12,317= 14,867
11. Financial performance in billions of US dollars
Year2008
2009
2010
2011
2012
2013
2014
2015
2016
2017
Turnover 13,98 16,35
14,90
16,60
21,59
29,57
33,87
38,71
46,30
44,91
43,03
Net
profit
0,161 0,485
-0,226
0,129
0,273
0,475
0,632
0,817
0,837
-0,145
0,530
Assets
5,450 7,539
6,622
8,956
10,71
15,86
16,88
18,38
27,40
24,93
27,19
1,134 1,613
1,311
1,606
1,835
2,448
2,680
3,025
4,106
3,026
4,095
Equity
2007
12. Revenue by Business Group (%)
PCSD (70%)Mobile (18 %)
Data Center (9 %)
PC AND
SMART
DEVICE
BUSINESS
GROUP
MOBILE
BUSINESS
GROUP (MBG)
DATA CENTER
BUSINESS GROUP
(DCG)
69%
19%
10%
Others (3 %)
2%
13. PC & Smart Device Business Group (PCSD)
PC & Smart Device BusinessGroup (PCSD)
US$ Million
Revenue
Pre-tax Income
Pre-tax Income Margin (%)
2017/18
7,005
291
4.2%
2016/17
6,992
370
5.3%
14. Mobile Business Group (MBG)
US$ MillionRevenue
Pre-tax Loss
Pre-tax Income Margin (%)
.
2017/18
1,746
Operational
Reported*
Operational
Reported*
2016/17
1,706
(129)
(173)
(163)
(206)
(7.4)%
(9.9)%
(9.6)%
(12.1)%
15. Data Center Business Group (DCG)
US$ Million2017/18
Revenue
2016/17
971
1,087
(31)
(64)
Pre-tax Loss
Operational
Reported*
(114)
(144)
Pre-tax Income Margin (%)
Operational
Reported*
(11.7)%
(14.9)%
(2.9)%
(5.9)%
16.
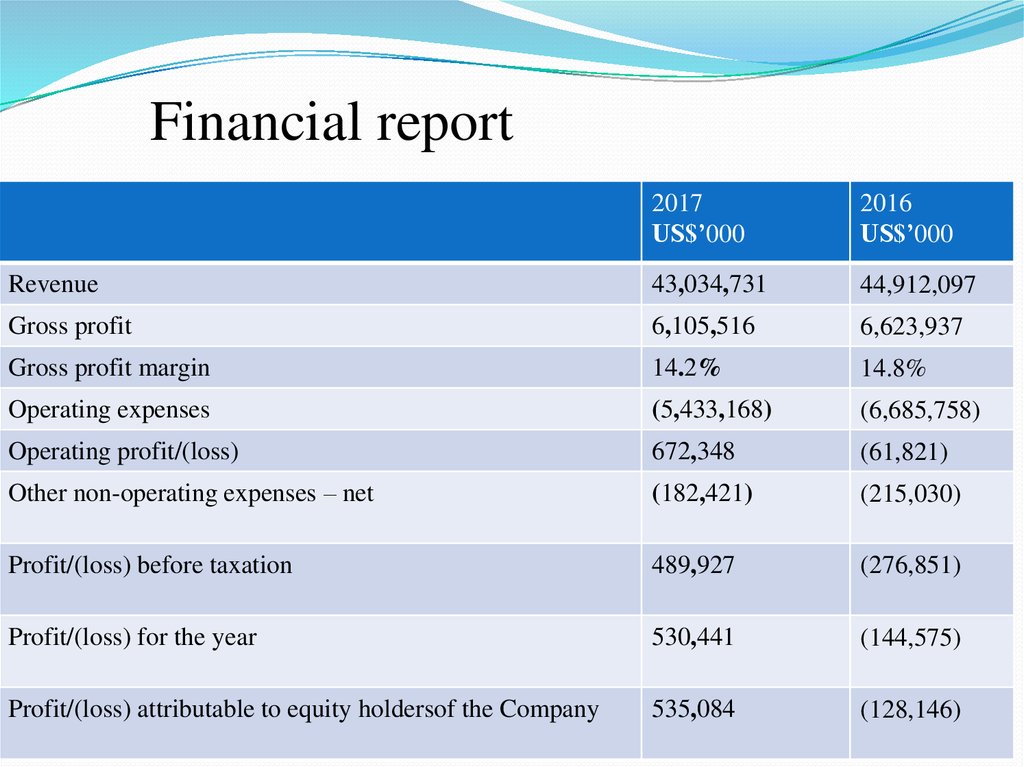
Financial report2017
US$’000
2016
US$’000
Revenue
43,034,731
44,912,097
Gross profit
6,105,516
6,623,937
Gross profit margin
14.2%
14.8%
Operating expenses
(5,433,168)
(6,685,758)
Operating profit/(loss)
672,348
(61,821)
Other non-operating expenses – net
(182,421)
(215,030)
Profit/(loss) before taxation
489,927
(276,851)
Profit/(loss) for the year
530,441
(144,575)
Profit/(loss) attributable to equity holdersof the Company
535,084
(128,146)
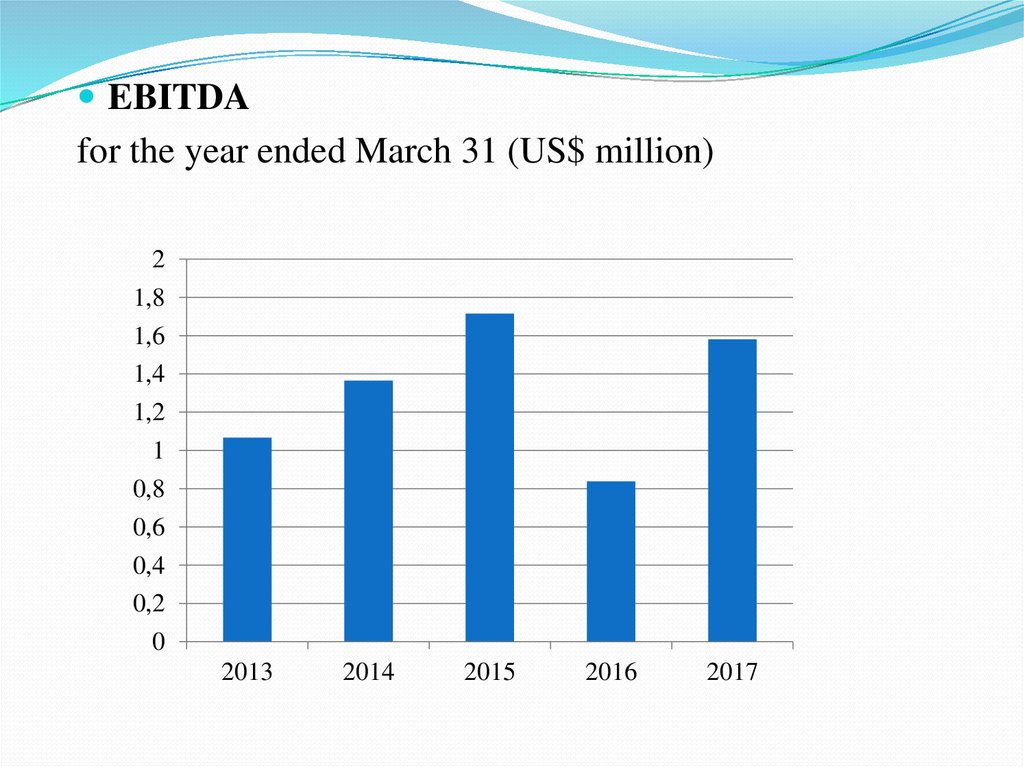
17.
EBITDAfor the year ended March 31 (US$ million)
2
1,8
1,6
1,4
1,2
1
0,8
0,6
0,4
0,2
0
2013
2014
2015
2016
2017
18. Cash and Working Capital
2017/18 2016/17US$ Million
Bank deposits and cash
Total Borrowings
Net (Debt)/Cash Reserves
Net cash (used in)/generated
from operating activities
1,541
2,843
(1,302)
(577)
2,064
3,231
(1,167)
8