


 industry
Similar presentations:


")


Extra data for history matching during the MGFM project
1.
Extra data for history matchingduring the MGFM project
Vladislav Sudakov, Marianna Dmitrieva
Reservoir Engineer
Sofoil LLC
2.
Agenda1. Oilfield region overview & problems
with history matching
2.
HPT-SNL & PPT results for DM
calibration
3. Salinity, pressure and temperature for
assessment of the DM
3.
Oilfield OverviewKav =801 mD
P4
P1
P6
I1
P2
I2
P3
P5
4.
Key Issues & ConcernsP4
Pressure
FIELD
Issue
P1
Pressure maintenance
P6
Water source / breakthrough
WBT time
Barrier suspicion
#
4000
1
2
3000
I1
2500
3
P, psi
3500
Not matching
2000
1500
P2
1000
I2
500
2002
2003
P3
2004
2005
2006
No aquifer
2007
2008
Date
P5
2009
2010
2011
Observed data
2012
2013
2014
5.
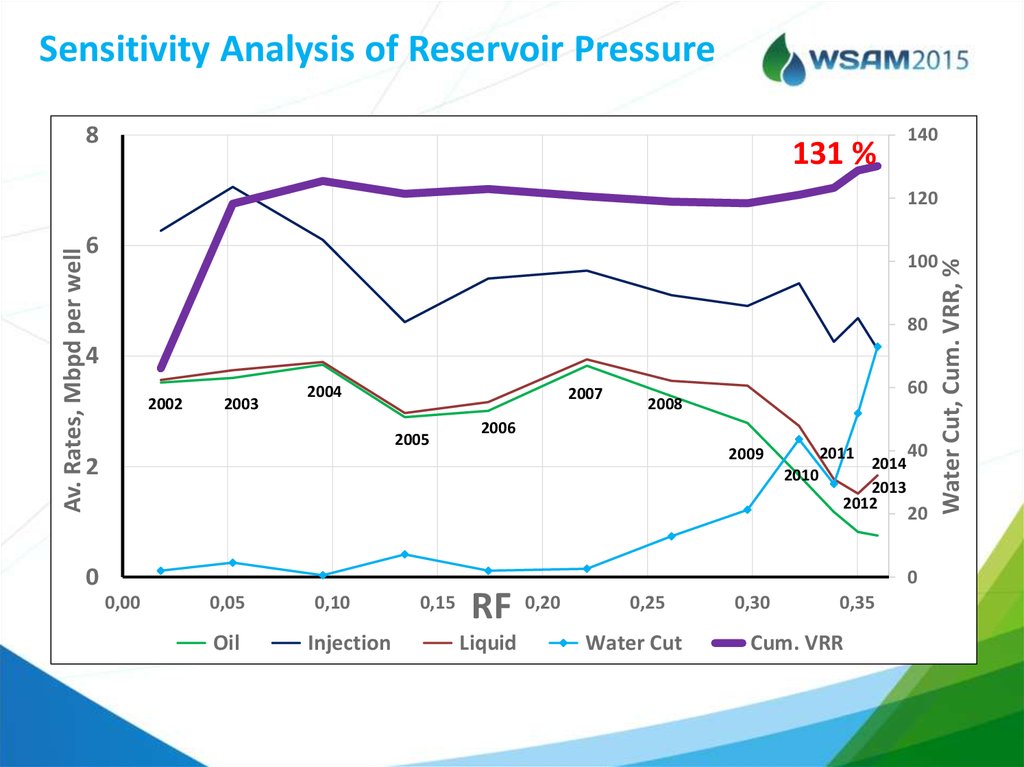
Sensitivity Analysis of Reservoir Pressure131 %
2500
Rock compressibility
1
4
2
6e-06
80
30e-06
2002
2300
2003
2004
2007
60
2008
2006
2005
2011
2009
2010
2200
2002
0
0,00
120
100
VRR
2
2400
Pressure, psi
Av. Rates, Mbpd per well
6
3e-06
140
2004
0,05
c=3e-5
0,10
Oil
Injection
2006
0,15
2008
0,20
RF c=3e-6
Liquid
2010
0,25
Water Cut
2014
2013
2012
2012
c=6e-60,30
2014
0,35
Cum. VRR
40
20
0
Water Cut, Cum. VRR, %
8
6.
Compressibility calibration from PPT surveyCf , 1/psi Φ, frac
Cf
Data Source
0.17·10-6
0.0
6.0·10-6
0.22
PPT well I1
20.0·10-6
0.29
Core Sample #51
Sandstone Lab Test
-7
(13.818·PORO)
=4·10 ·e
7.
Injection reallocation from HPT-SNL surveywell I2
Water Injected Rate well I2
Reallocated
P1
20000
18000
16000
P4
Original
P6
I1
BBL/D
14000
12000
10000
P2
8000
I2
6000
4000
2000
P3
0
P5
2002 2003 2004 2005 2006 2007 2008 2009 2010 2011 2012 2013 2014
8.
Pressure matchingbefore
Pressure - FIELD
3500
P, psi
2500
1500
500
2002 2003 2004 2005 2006 2007 2008 2009 2010 2011 2012 2013 2014
No aquifer
after
Observed data
Date
Pressure - FIELD
P, psi
2500
2000
1500
1000
500
2002 2003 2004 2005 2006 2007 2008 2009 2010 2011 2012 2013 2014
FG_M
Observed data
9.
Production reallocationP4
P1
P6
I1
P2
I2
P3
P5
10.
PPTReasons for Reallocation:
1. HPT-SNL Surveys
2. Rapid Water Breakthrough
11.
Results from PPT surveyχ Hydraulic diffusivity
P1
transmissibility
σ
I1
P4
P6
P2
baffle
I2
P3
P5
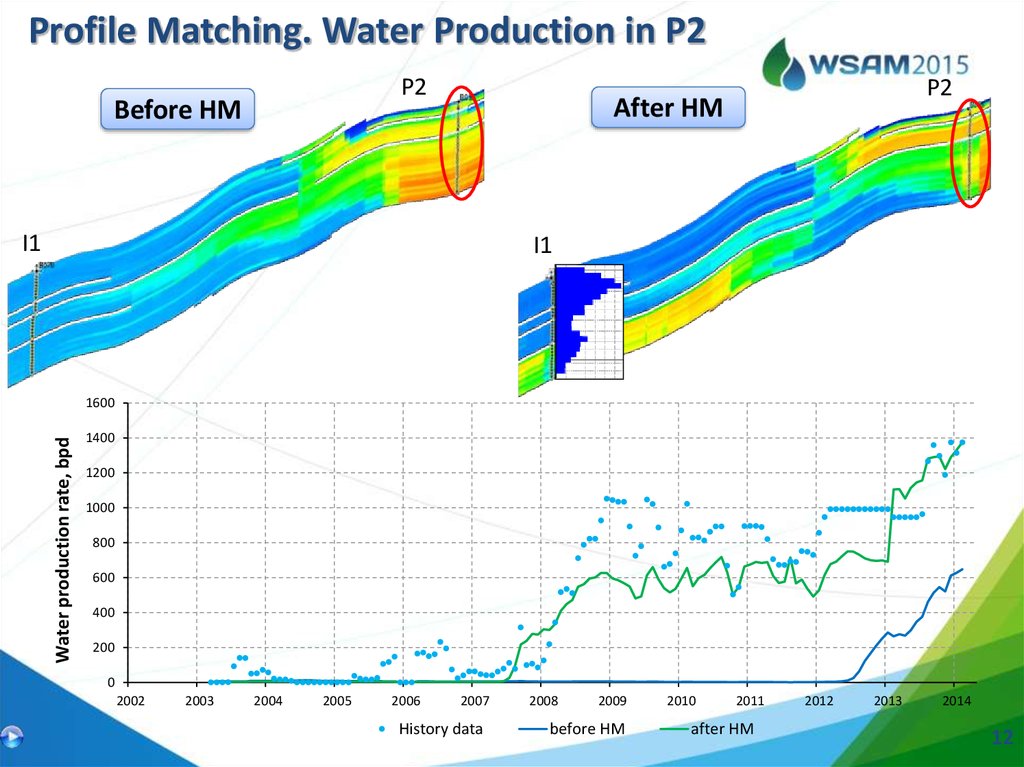
12.
Profile Matching. Water Production in P2P2
Before HM
P2
After HM
I1
I1
Water production rate, bpd
1600
1400
1200
1000
800
600
400
200
0
2002
2003
2004
2005
2006
2007
History data
2008
2009
before HM
2010
2011
after HM
2012
2013
2014
12
13.
Profile Matching. From I to I2 to P4I2
Before HM
P4
I2
After HM
P4
13
14.
Production history matching70
Production Rates, MSTBPD
60
50
40
30
20
10
0
2002
Oil
2003
2004
Oil (hist)
2005
2006
Water
2007
2008
Water (hist)
2009
2010
Injection
2011
2012
2013
Injection (hist)
2014
15.
CalibrationP4
P1
P4
P6
I1
P1
I2
P3
I1
I1
P2
P3
P2
P6
P5
P5
P4
P1
P1
P1P1
P6
I1
P5
I2
P3
P5