

")


 industry
Similar presentations:


The volume of industrial production
1. Hi! I’m Olga, employee, student, and aspiring researcher. My biggest inspiration is kind, smart, strong and cheerful people. А
and many-many othersI believe that mathematics is the
Queen of science.
2. I work in the Department of industrial enterprises statistics in Chelyabinskstat. Our statistical information allows you to: -
watch the dynamics of the industry of theChelyabinsk region;
- assess the contribution of the region to the Russian
economy;
- make forecasts;
- take measures to eliminate any problem;
- improve anything.
3. THE VOLUME OF INDUSTRIAL PRODUCTION (as a percentage of the volume for 1991)
9083,2
75
67,4
65,5
68,9
64,9
63,1
62,0
64,2
63,0
65,8
65,6
59,9
60
62,2
54,2
49,2
46,9
43,3
42,6
45
44,2
57,7
51,5
45,2
52,0
38,5
38,3
37,0
2018
2017
2016
2015
2014
2013
2012
2011
2010
2009
2008
2007
2006
2005
2004
2003
2002
2001
2000
1999
1998
1997
1996
1995
1994
1993
30
1992
33,4
4. THE SHARES OF INDUSTRIAL PRODUCTION ACTIVITIES IN THE TURNOVER OF THE CHELYABINSK REGION’S ECONOMY IN 2008 (as a percentage of
total)1,7
39,3
51,6
6,6
0,8
Extraction of minerals
Manufacturing activity
Provision of electricity, gas and steam; air conditioning
Water supply; water disposal, organization of waste collection and disposal, pollution elimination activity
Other activities
5.
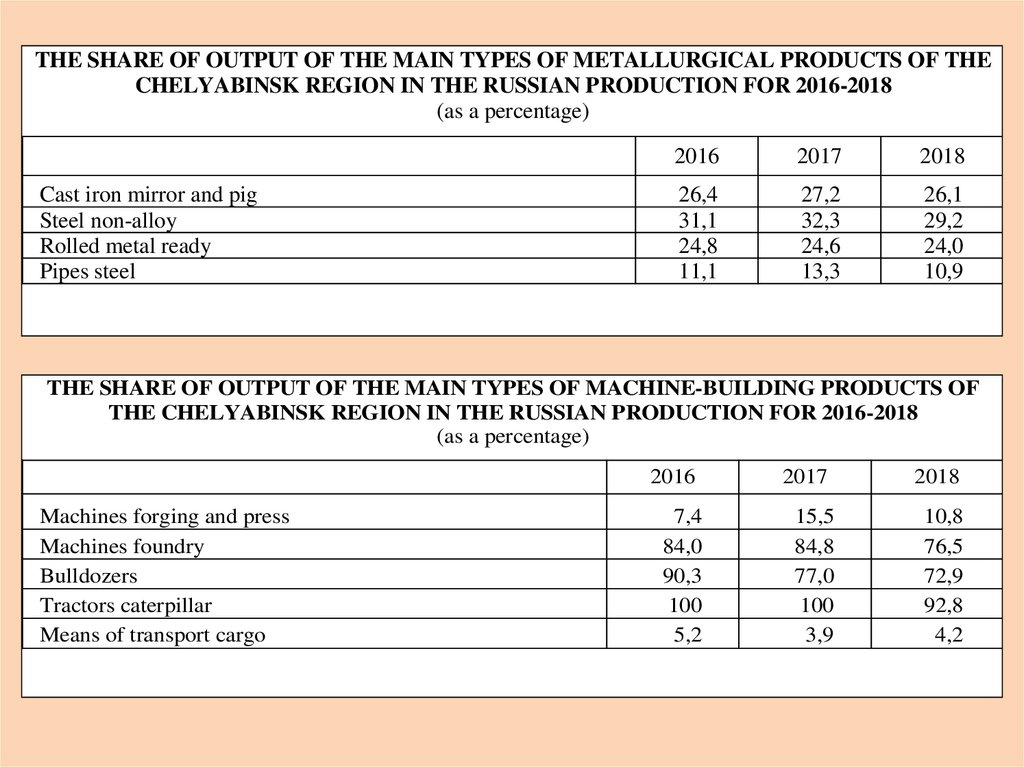
THE SHARE OF OUTPUT OF THE MAIN TYPES OF METALLURGICAL PRODUCTS OF THECHELYABINSK REGION IN THE RUSSIAN PRODUCTION FOR 2016-2018
(as a percentage)
Cast iron mirror and pig
Steel non-alloy
Rolled metal ready
Pipes steel
2016
2017
2018
26,4
31,1
24,8
11,1
27,2
32,3
24,6
13,3
26,1
29,2
24,0
10,9
THE SHARE OF OUTPUT OF THE MAIN TYPES OF MACHINE-BUILDING PRODUCTS OF
THE CHELYABINSK REGION IN THE RUSSIAN PRODUCTION FOR 2016-2018
(as a percentage)
2016
Machines forging and press
Machines foundry
Bulldozers
Tractors caterpillar
Means of transport cargo
7,4
84,0
90,3
100
5,2
2017
15,5
84,8
77,0
100
3,9
2018
10,8
76,5
72,9
92,8
4,2
6. I study at the South Ural State University to become a Master of Applied mathematics and informatics. First semester: I
conducted statistical processing of several samples.7. The simulation modeling is a research method in which the system is replaced by a model. Interrelations of system elements are
reflected by means of the mathematical device.8. The method of “Input-Output” balance is to create tables of interrelated economic indicators. SYMMETRIC table "INPUT-OUTPUT"
The method of “Input-Output” balance is to create tablesof interrelated economic indicators.
SYMMETRIC table "INPUT-OUTPUT" for 2011 (million rubles)
Products
Codes
№№
071
29.1
072
073
074
075
088
131
29.2
29.3
29.4
29.5
34
TOTAL
132
133
134
D1
D11
D29-D39
135
136
137
Р51с
B2n+ B3n
B1g
138
P1
139
140
P7
(P1+P7)BP
Mechanical equipment, except aircraft,
rocket, automobile and motorcycle
engines
General purpose equipment other
Equipment for agriculture and forestry
Machines
Special purpose equipment other
Motor vehicles, trailers and semi-trailers
Total intermediate consumption/final
use (sum of lines 001-130)
Salary
including wages
Other taxes less other subsidies on
production
Consumption of fixed capital
Net income (net mixed income)
Gross value added (sum of lines 132,
134-136)
Output of branches in basic prices
(sum of lines 131 and 137)
Import (CIF)
Total resources at basic prices (sum of
lines 138-139)
Mechanical
equipment,
except
aircraft,
rocket,
automobile
and
motorcycle
engines
General
purpose
equipment
other
Equipment
for
agriculture
and forestry
Machines
Special
purpose
equipment
other
Motor
vehicles,
trailers and
semi-trailers
Total (sum the
count 001-126)
29.1
29.2
29.3
29.4
29.5
34
TOTAL
071
072
073
074
075
088
127
35 148
4 647
59
1 507
4 054
696
9 911
22 816
523
1 403
4 572
1 841
5 433
1 400
8 716
148
234
2 649
452
801
11
1 690
101
115
9 691
8 029
283
1 282
15 356
3 412
13 294
9 779
953
2 832
1 008
485 757
376
285
62
43
282
674
810
124
356
530
076
160
226 696
90 445
70 770
244 575
101 089
79 132
70 491
18 745
14 280
16 946
10 831
8 244
217 663
81 711
62 451
1 187 537
134 186
101 770
48 876 260
20 258 675
16 296 783
1 638
9 511
22 067
988
7 306
42 729
189
1 020
-7 081
172
585
-4 309
989
6 727
19 401
-224
21 337
32 913
548 593
5 570 151
25 706 712
123 660
152 111
12 873
7 279
108 828
188 211
52 084 131
350 356
249 982
396 686
358 236
83 364
97 771
24 225
134 214
326 491
394 579
1 375 749
1 293 753
100 960 391
11 192 405
600 338
754 922
181 135
158 439
721 070
2 669 502
112 152 795