


 pedagogy
Similar presentations:


")


Statistical Techniques for Data Science Week 1
1.
Statistical Techniques for DataScience Week 1
2.
Objectives (for today)● to learn about the course
● to recall Probability theory
● to do short introduction to Statistics
2
3.
Course. Team and Communication● Zamira Kholmatova (@zzzkh)
● Okibe Solomon Okibe
3
4.
Course. Syllabus● Statistics
● Non-parametric Statistics
● Bandit algorithms
● Sampling
4
5.
Course. Structure● Lectures (2 hours/week) + Quizzes (5-10 min. on a lecture)
● Labs (2 hours/week) + Assignments (after each lab)
5
6.
Course. Books● Hogg, Robert V., Joseph W. McKean, and Allen T. Craig. «Introduction to
Mathematical Statistics»
● Hogg, Robert V., Elliot A. Tanis, and Dale L. Zimmerman. «Probability and
statistical inference»
● Hastie, T. Tibshirani, R. and Friedman, J. «The Elements of Statistical Learning»
● *Bishop, C. «Pattern Recognition and Machine Learning»
6
7.
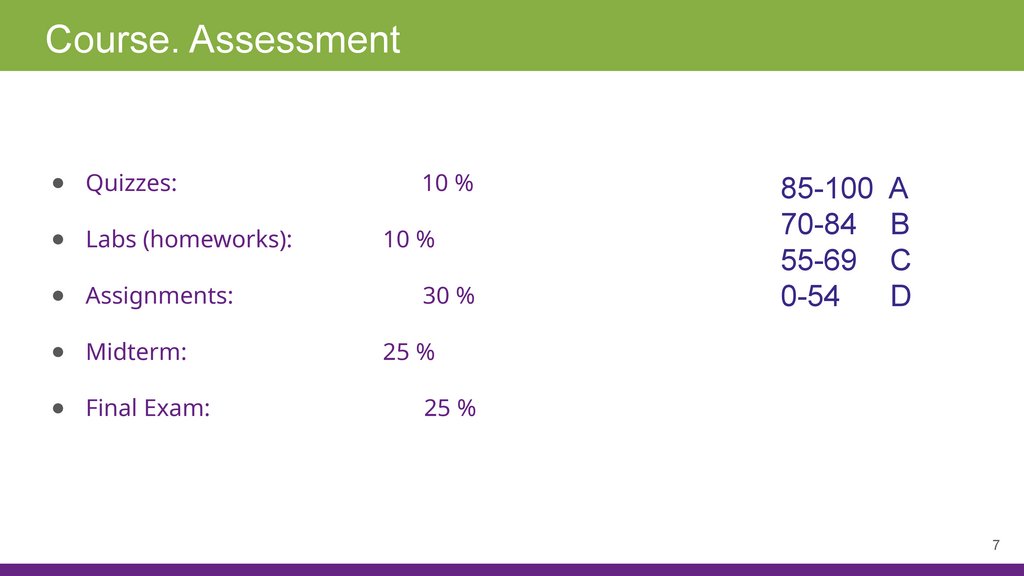
Course. Assessment● Quizzes:
● Labs (homeworks):
● Assignments:
● Midterm:
● Final Exam:
10 %
10 %
30 %
85-100 A
70-84 B
55-69 C
0-54
D
25 %
25 %
7
8.
Course. Tools● Pen and Paper
● Python (ver. 3+)
● …
8
9.
Prerequisites● Linear Algebra
● Calculus
● Probability Theory
9
10.
How to success?● Assignments:
○
work hard (individually) + office hours
● Exams:
○
○
read the books + office hours
do exercises
10
11.
What are your expectations?● Answer the questions:
○
○
○
○
Which book I will read during the course?
What is the most interesting project topic for me?
Which tools I would like to study in the course?
Which paper(s) I would like to read / implement ?
● Fill the form: https://forms.yandex.ru/cloud/696be4e0f47e734bf2544df2
1
1
12.
Part1. Review of ProbabilityTheory
13.
Warm up… Random Variables● What are examples of random variables (YES/NO)?
A. Winning a lottery
B. Choosing a green ball from an urn with a large mixture of red and black balls
C. Total value from a roll of two dice
D. Two people in a classroom sharing the same birthday
E. The average exam score of a class if every student guesses answers
F. Winings from a game with a $1 gain/loss for each head/tail coin flip in a series of 10 flips
13
14.
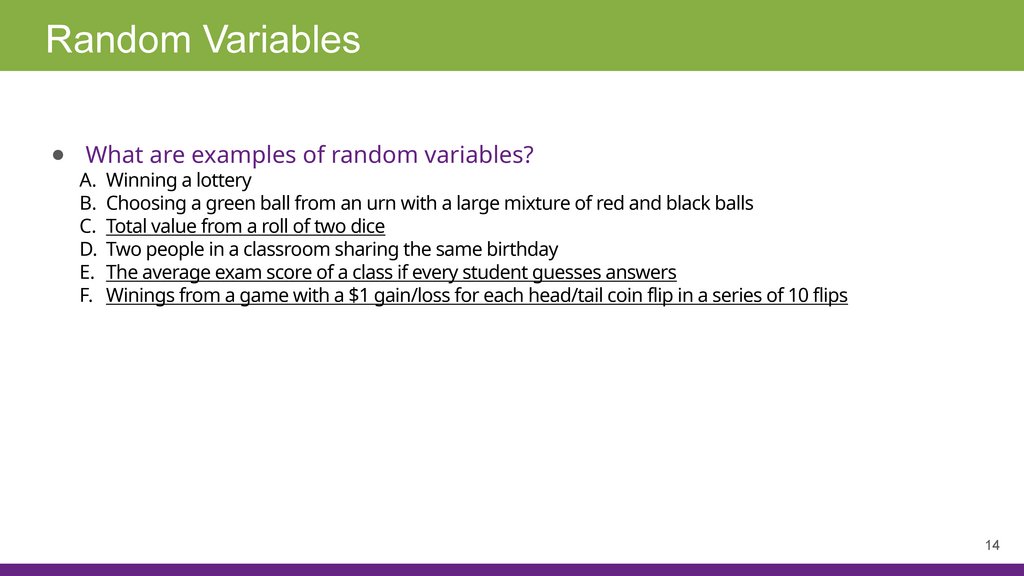
Random Variables● What are examples of random variables?
A. Winning a lottery
B. Choosing a green ball from an urn with a large mixture of red and black balls
C. Total value from a roll of two dice
D. Two people in a classroom sharing the same birthday
E. The average exam score of a class if every student guesses answers
F. Winings from a game with a $1 gain/loss for each head/tail coin flip in a series of 10 flips
14
15.
Terms● Do not confuse/mix
○
○
○
○
Outcomes,
Sample Space,
Events and
Random Variables
● A random variable assigns a numerical value to each outcome of a chance event
(in a random experiment)
15
16.
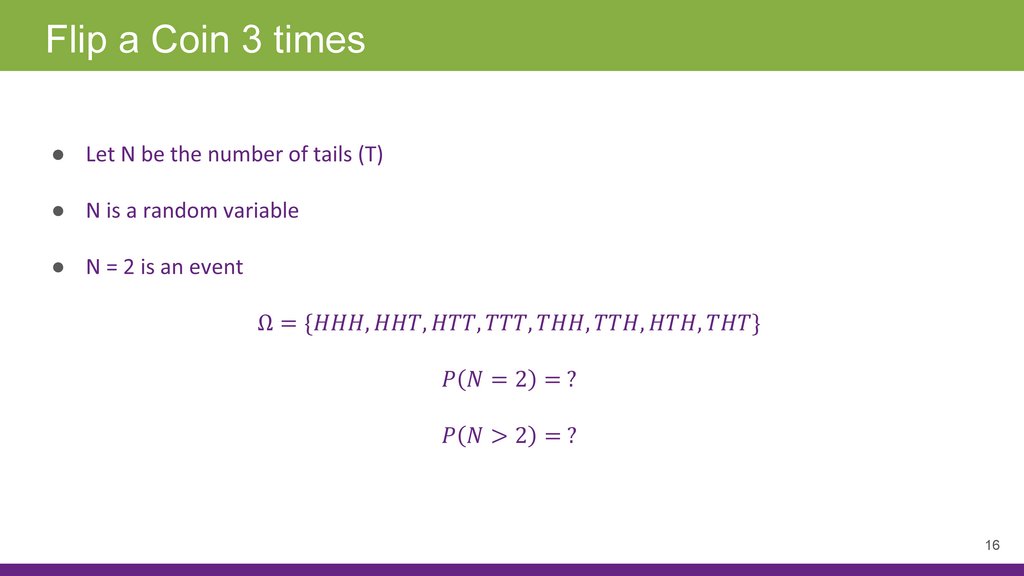
Flip a Coin 3 times16
17.
Functions of Random Variables● When you apply a mathematical function g to a random variable X, you create a
new random variable Y = g(X) – why do we need this fact?
● For a random variable it is important to understand its
○
○
○
probability distribution,
expected value, and
variance
17
18.
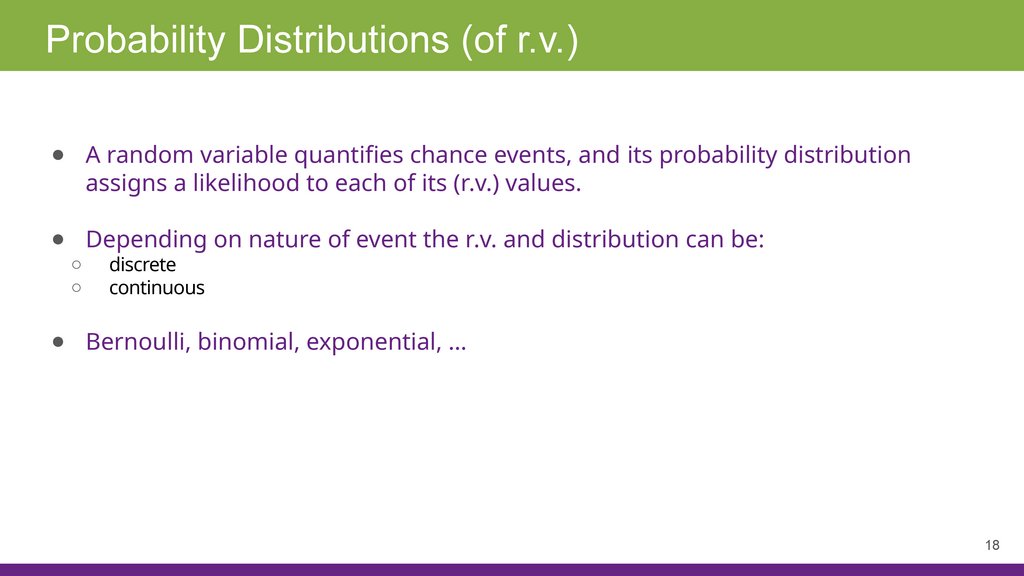
Probability Distributions (of r.v.)● A random variable quantifies chance events, and its probability distribution
assigns a likelihood to each of its (r.v.) values.
● Depending on nature of event the r.v. and distribution can be:
○
○
discrete
continuous
● Bernoulli, binomial, exponential, …
18
19.
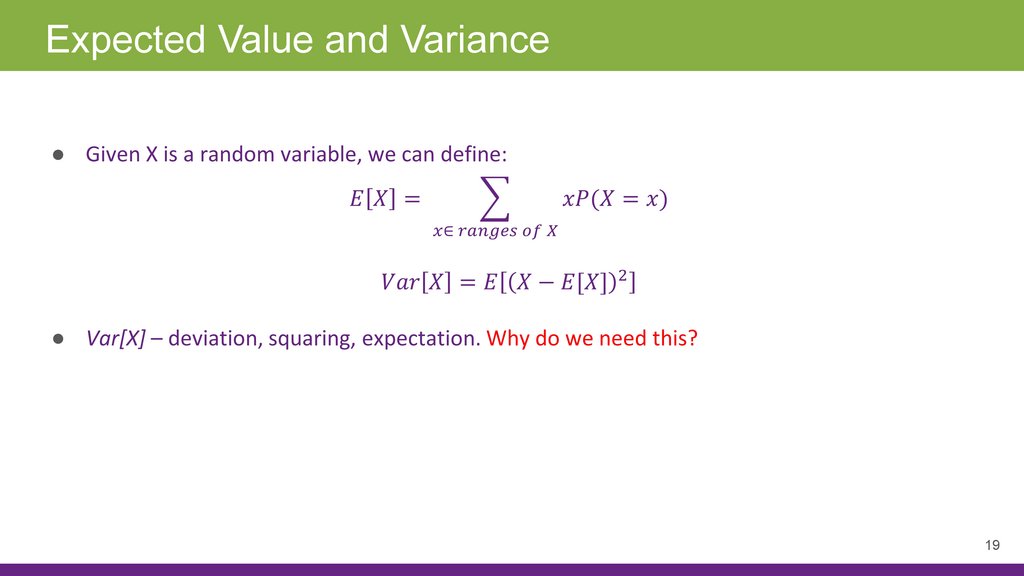
Expected Value and Variance19
20.
Probability TheoryIt is about
● modeling real-world phenomena (and understanding what is «normal» and
«unusual»)
● making optimal predictions
● measuring risks/reliability
● drawing inference from «small» samples
● incorporating new evidence
20
21.
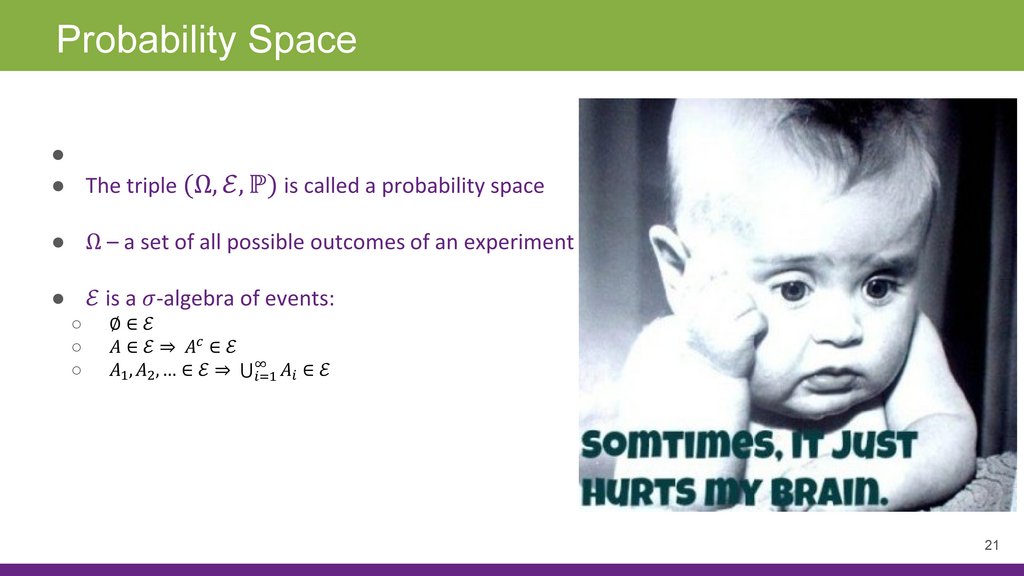
Probability Space21
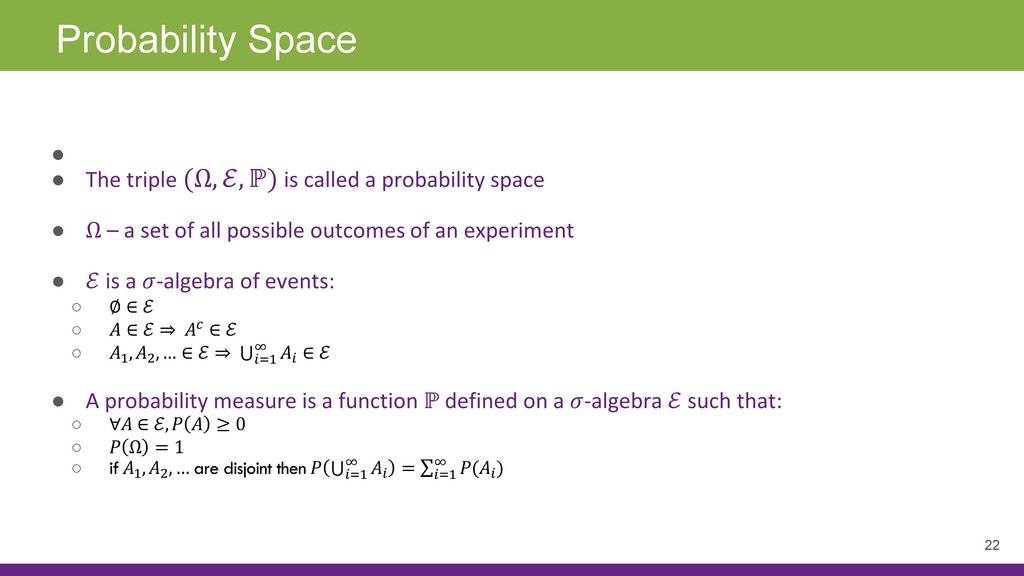
22.
Probability Space22
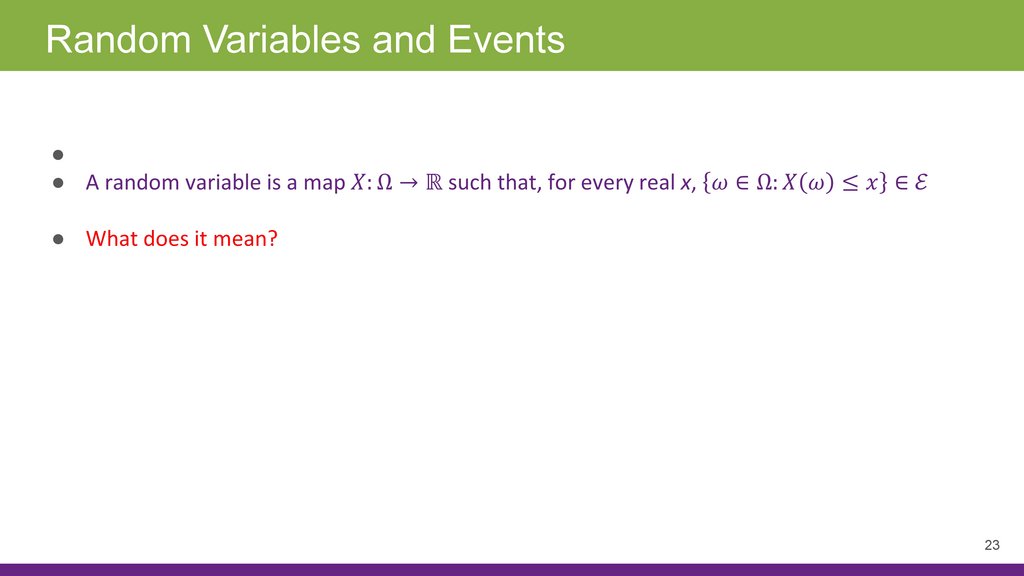
23.
Random Variables and Events23
24.
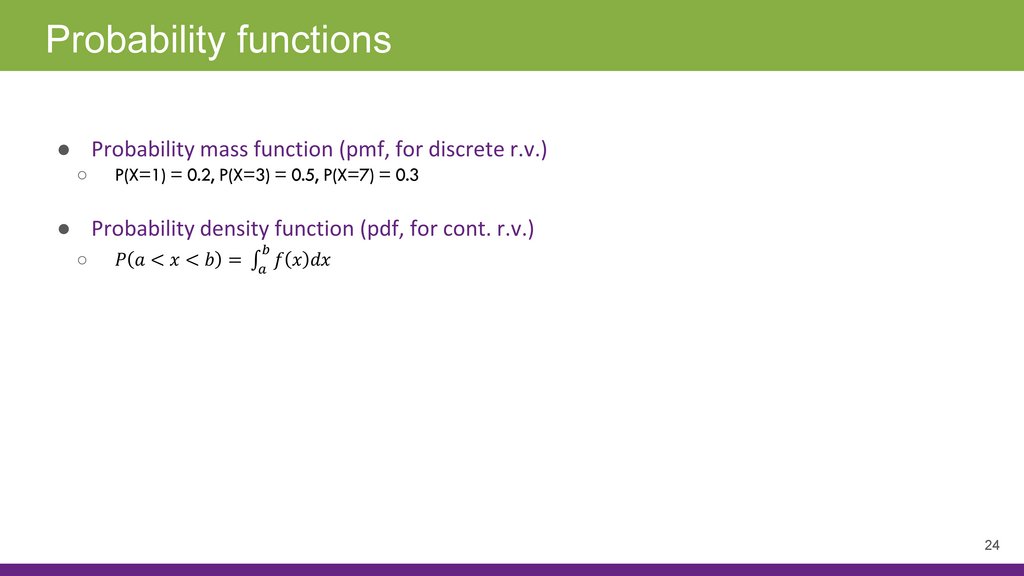
Probability functions24
25.
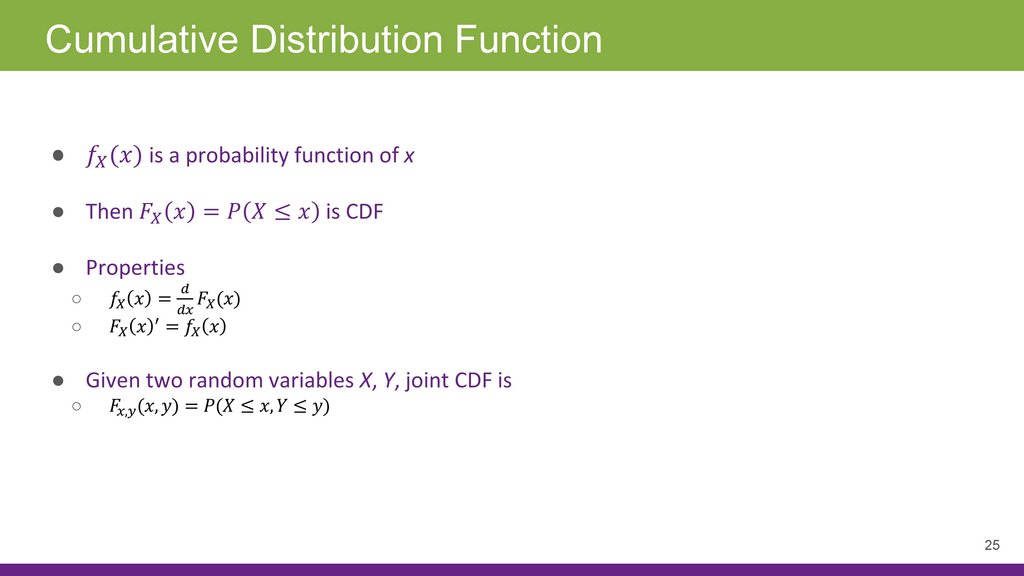
Cumulative Distribution Function25
26.
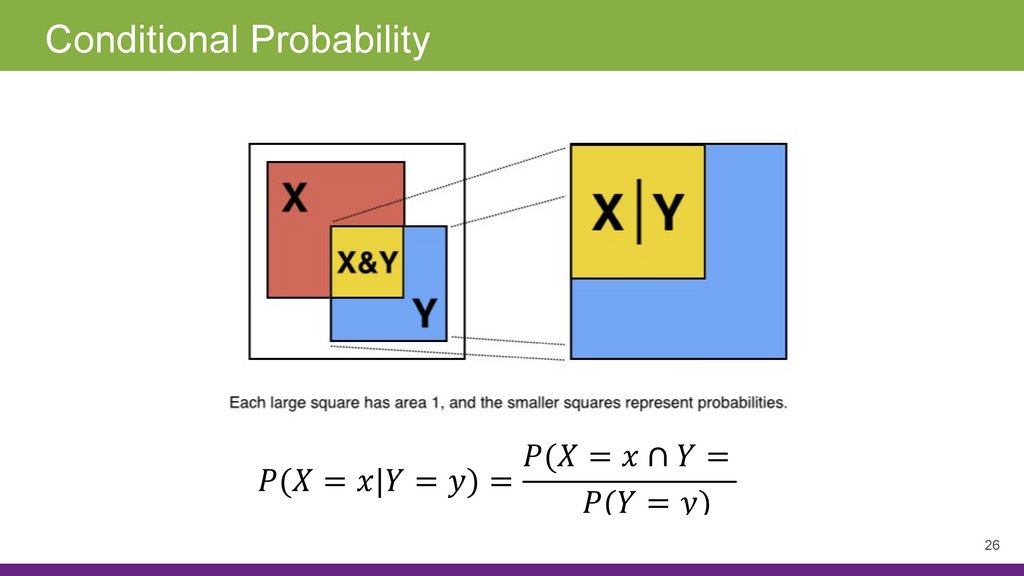
Conditional Probability26
27.
Conditional Probability. ExampleHas
Has no
Total
Has
Has no
Total
27
28.
Bayes' Theorem28
29.
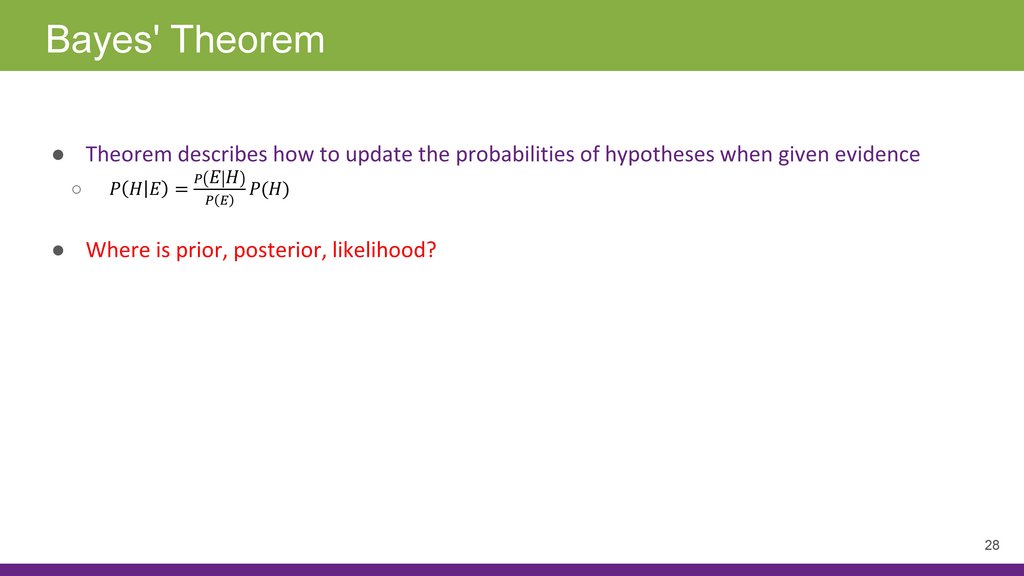
Bayes' Theorem● Theorem describes how to update the probabilities of hypotheses when given
evidence
● Philosophically, all probabilities are conditional probabilities
29
30.
Part 2. Introduction to Statistics31.
Statistical modeling● Statistical modeling is based on optimization and simulation
○
it is important to know optimization techniques
● In this course, we will study various techniques to estimate the parameters, also
by means of resampling and simulation
31
32.
The Essence of Statistics● Statistics solves a backwards problem
● It starts from data (observe) and then asks what was used to generate the data
● With statistics we can quantify predictions
● And also helps to quantify our uncertainty
32
33.
Descriptive Statistics● Descriptive statistics enables us to present the data in a meaningful way, which
allows simpler interpretation of the data
● Typically, two general types of statistic that are used to describe data:
○
○
Measures of central tendency
Measures of spread
33
34.
Measuring the Central Tendency34
35.
Measuring the Spread35
36.
Inferential Statistics● Inferential statistics allows us to use samples to make generalizations about the
populations from which the samples were drawn
● It is, therefore, important that the sample accurately represents the population
36
37.
Data and Estimators38.
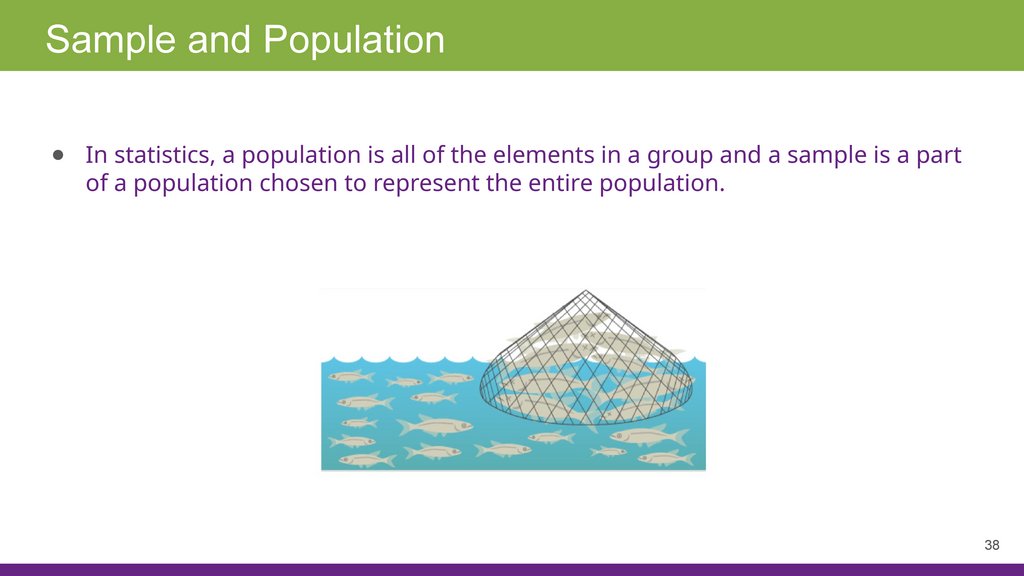
Sample and Population● In statistics, a population is all of the elements in a group and a sample is a part
of a population chosen to represent the entire population.
38
39.
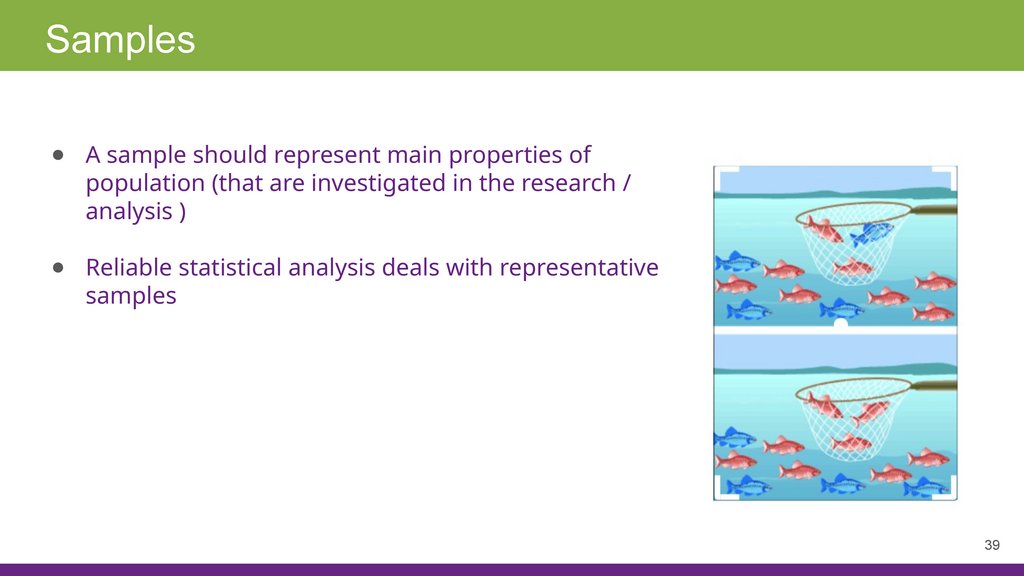
Samples● A sample should represent main properties of
population (that are investigated in the research /
analysis )
● Reliable statistical analysis deals with representative
samples
39
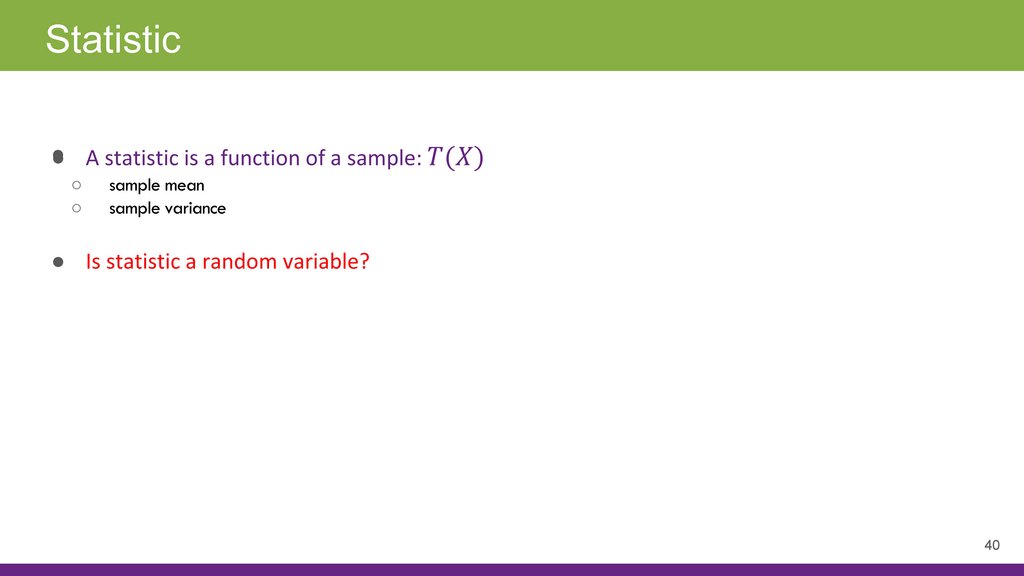
40.
Statistic40
41.
Estimation● Inferential statistics is focused on the estimation of the population parameter
from the sample statistic
● The sample statistic is calculated from the sample data and the population
parameter is inferred (or estimated) from this sample statistic
● !!! Statistics are calculated, parameters are estimated
41
42.
Point Estimates● The point estimate is the single best guess about the value of parameter
● A good estimator must satisfy three conditions:
○
○
○
unbiased: the expected value of the estimator must be equal to the value of the parameter
consistent: the value of the estimator approaches the value of the parameter as the sample size
increases
relatively efficient: the estimator has the smallest variance of all estimators which could be used
42
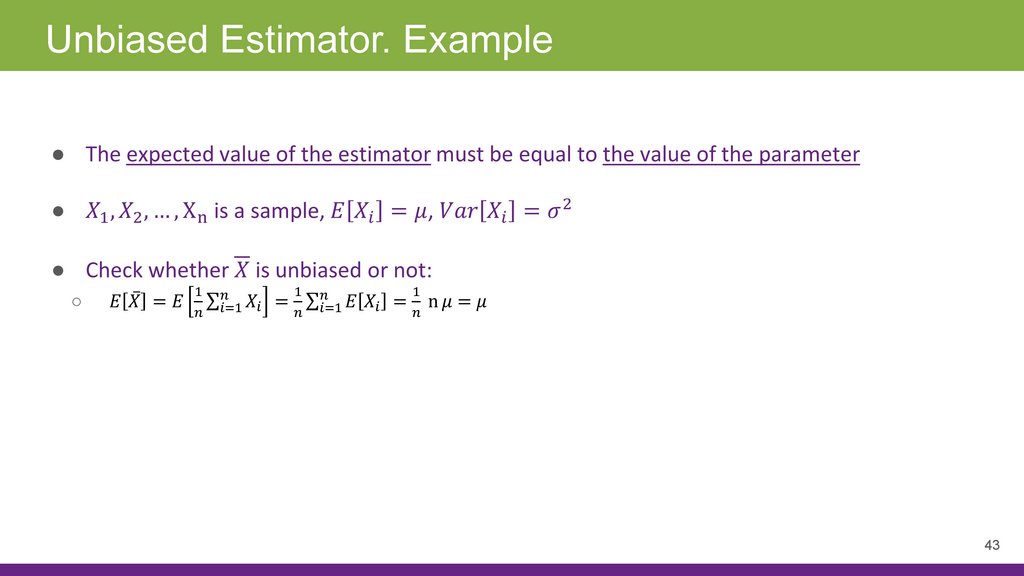
43.
Unbiased Estimator. Example43
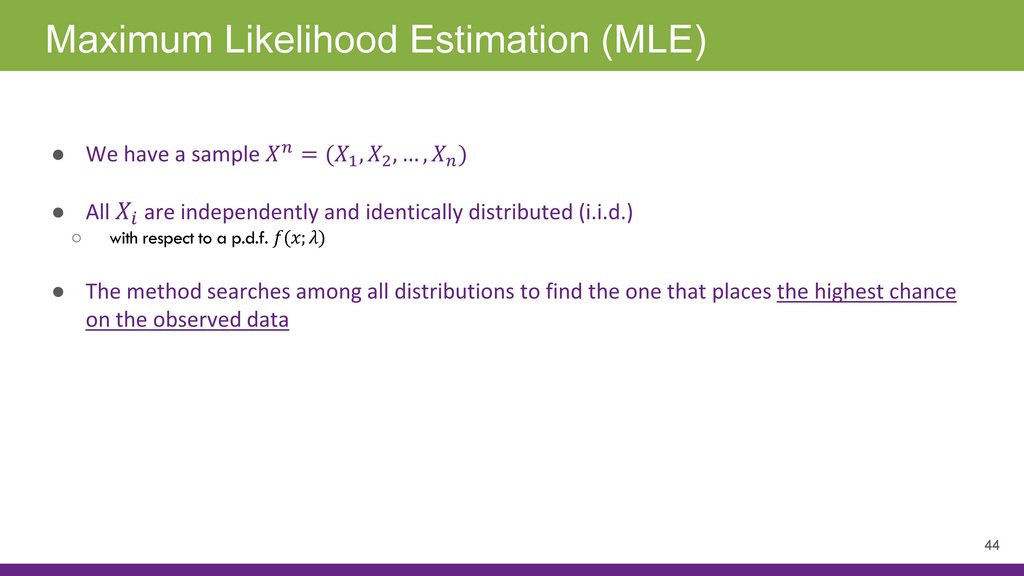
44.
Maximum Likelihood Estimation (MLE)44
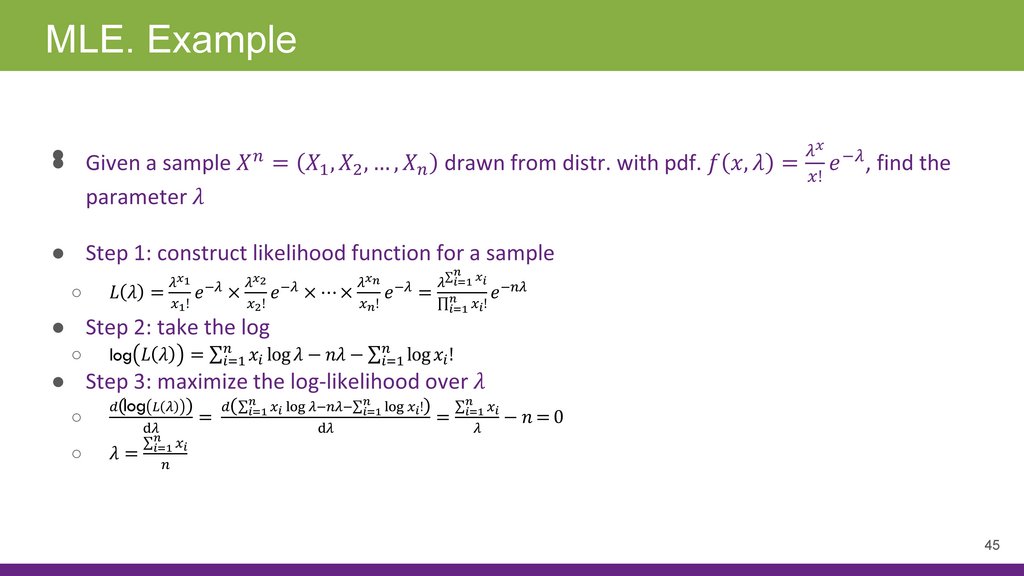
45.
MLE. Example45
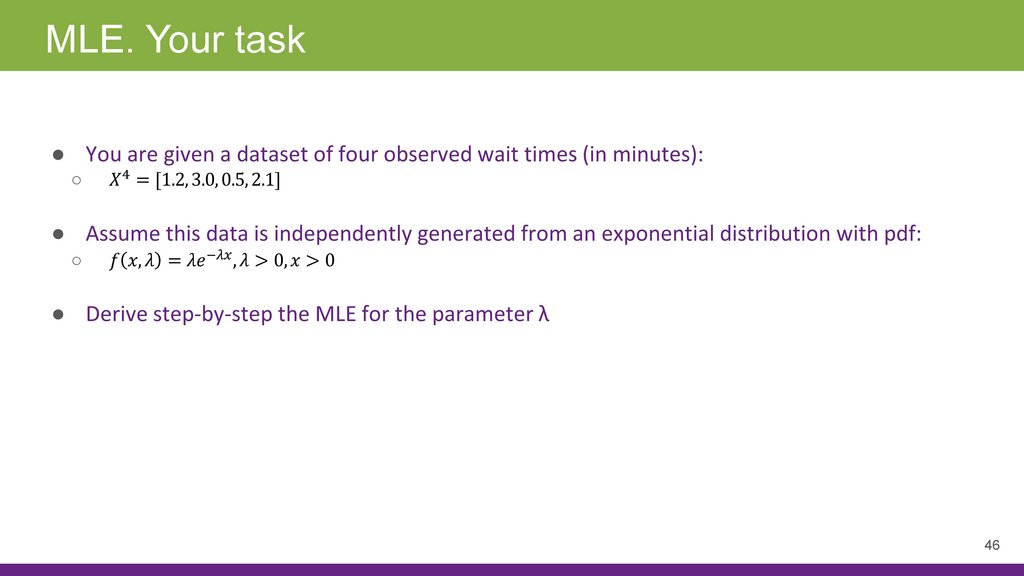
46.
MLE. Your task46
47.
Interval Estimates● A confidence interval contains the true value of the corresponding parameter
with the specified probability
● If we repeat the entire data collection and interval construction process an
infinite number of times (under identical conditions), then 95% of the computed
intervals would contain the true parameter value
47
48.
To read before the next class● Hogg, Robert V., Joseph W. McKean, and Allen T. Craig. «Introduction to
Mathematical Statistics»
○
○
1.1 – 1.9 (to recall the general theory of distribution functions)
2.1 (about conditional probability)
● Hogg, Robert V., Elliot A. Tanis, and Dale L. Zimmerman. «Probability and
statistical inference»
○
○
○
1.1 – 1.5 (to recall the general theory of distribution functions)
2.1, 2.2 (discrete distributions)
3.1, 3.2 (continuous distributions)
48