

 mean")
 mean")
 mean")
 mean")


 mathematics
Similar presentations:


")

")


")
Descriptive statistics
1. Descriptive statistics:
Descriptive statisticsSets
Counting methods
Discrete probability
2. Descriptive Statistics
A list of numbers, or numerical data, can be describedby various statistical measures.
•Average or (arithmetic) mean
•Median
•Mode
•Range
•Standard deviation
3. Descriptive Statistics Average or (arithmetic) mean
4. Descriptive Statistics Average or (arithmetic) mean
A = average (or arithmetic mean)N = the number of terms (e.g., the number of items or
numbers being averaged)
S = the sum of the numbers in the set of interest (e.g., the
sum of the numbers being averaged)
5. Descriptive Statistics Average or (arithmetic) mean
Example:If a teacher tutored five students and they subsequently scored
96, 94, 92, 87, and 81, what was the average score of the
students whom the teacher tutored?
6. Descriptive Statistics Average or (arithmetic) mean
Example:If a teacher tutored five students and they subsequently scored
96, 94, 92, 87, and 81, what was the average score of the
students whom the teacher tutored?
N = 5 since there are 5 students
S = 96 + 94 + 92 + 87 + 81 = 450
7. Descriptive Statistics Median
What is the median of the set that consists of thenumbers 5, 2, 8, 9, 2?
8. Descriptive Statistics Median
Example:What is the median of the set that consists of the
numbers 5, 2, 8, 9, 2?
Order sequentially:
2, 2, 5, 8, 9
Median = 5
9. Descriptive Statistics Median
Example:If x < 5, what is the median of the set consisting of the
following numbers:
6, 5, 6, 7, 9, 10, 2, x
10. Descriptive Statistics Median
Example:If x < 5, what is the median of the set consisting of the
following numbers:
6, 5, 6, 7, 9, 10, 2, x
Order the items sequentially:
2, x, 5, 6, 6, 7, 9, 10
You do not know whether x > 2 or x < 2. However, it does not
matter.
With an even number of items in the list, the median is the
average of the two middle numbers: 6
11. Descriptive Statistics Mode
12. Descriptive Statistics Mode
Set K: 2, 4, 6, 8, 5, 3, 4The mode is 4 since this number appears twice (more than
any other number).
The set {1, 2, 2, 1, 2} has one mode, 2
The set {1, 2, 2, 1, 2, 1} has two modes, 1 and 2
13. Descriptive Statistics
The degree to which numerical data are spread out ordispersed can be measured in many ways. Two
ways of measuring the dispersion of data are
following:
•Range
•Standard deviation
14. Descriptive Statistics Range
15. Descriptive Statistics Range
Set R: 14, 10, 19, 143, 180Range = largest - smallest = 180 - 10 = 170
The range for the set {1, 29, 3, 17, 54, 11} is 54-1 = 53
16. Descriptive Statistics Standard deviation
One of the most common measures of dispersion is thestandard deviation.
Generally speaking, the greater the data are spread away
from the mean, the greater the standard deviation.
The standard deviation of n numbers can be calculated as
follows:
(1) Find the arithmetic mean;
(2) Find the differences between the mean and each of the n
numbers;
(3) Square each of the differences;
(4) Find the average of the squared differences; and
(5) Take the nonnegative square root of this average.
17. Descriptive Statistics Standard deviation
18. Descriptive Statistics Standard deviation
The most important part of understanding standard deviations is knowing that asthe standard deviation increases, the dispersion of the data increases.
The standard deviation of the red graph is much larger than that of the
blue graph.
19. Descriptive Statistics Standard deviation
Shown below is this calculation for the data 0, 7, 8, 10, 10,which have arithmetic mean 7.
20. Descriptive Statistics Standard deviation
Notice that the standard deviation depends on every datavalue, although it depends most on values that are farthest
from the mean. This is why a distribution with data grouped
closely around the mean will have a smaller standard
deviation than will data spread far from the mean. To
illustrate this, compare the data 6, 6, 6.5, 7.5, 9, which also
have mean 7. Note that the numbers in the second set of
data seem to be grouped more closely around the mean of
7 than do the numbers in the first set. This is reflected in
the standard deviation, which is less for the second set
(approximately 1.1) than for the first set (approximately
3.7).
21. Descriptive Statistics Frequency distribution
There are many ways to display numerical data that showhow the data are distributed. One simple way is with a
frequency distribution, which is useful for data that have
values occurring with varying frequencies.
For example, the 20 numbers shown on the left below are
displayed on the right in a frequency distribution by listing
each different value x and the frequency f with which x
occurs.
22. Descriptive Statistics Frequency distribution
For example, the 20 numbers shown on the left below aredisplayed on the right in a frequency distribution by listing each
different value x and the frequency f with which x occurs.
23. Descriptive Statistics Frequency distribution
From the frequency distribution, one can readily computedescriptive statistics. The following each statistic shows how to
calculate it:
Mean
5 2 4 2 3 1 2 3 1 5 0 7 1.6
20
Median
–1 (the average of the 10th and 11th numbers)
Mode
The number that occurs most frequently is 0.
Range
0 – (–5) = 5
Standard deviation
5 1.6 2 4 1.6 2 ... 0 1.6 7 1.7
2
2
20
2
24. DATA ANALYSIS AND INTERPRETATION
25. The SAT Data Interpretation will present information in any one of a number of visual formats. These include:
The SAT Data Interpretation will present informationin any one of a number of visual formats. These
include:
pie charts
bar charts
line graphs
scatter plots & best-fit lines
box plots
histograms (which are different from bar charts!!)
charts of numerical data
26. 1. Data Interpretation – Pie Chart
A pie chart is also called a circle graph because it is acircular chart divided into sectors. The sectors illustrate
percentages or proportions of a quantity that is defined in
the question itself. Every pie chart is divided into multiple
‘pies’ or sectors, each of which represents a certain
quantity.
27. 2. Data Interpretation – Column Chart
Column charts are the second most important type ofillustration on the SAT. They are also known as bar charts.
A bar chart is a kind of visual illustration that has
rectangular bars with lengths proportional to the values
they represent. The bars can be plotted vertically or
horizontally.Height of bars is proportional to their value.
28. 3. Data Interpretation – Line Chart
A line graph displays information as a series of data pointsconnected by straight line segments. Line graphs help you
understand the movement or growth Here is an example of
a line graph illustration.
Line graphs display the movement or growth of quantities.
29. 4. Data Interpretation – Box and Scatter Plots
A scatter plot is a way of displaying bivariate data, that is,measures of two different variables for each subject. In
other words, a scatter plot is a visualization of the
relationship between two variables measured on the same
set of individuals, for instance: age and weight of several
persons on the same graph, or their annual income and the
amount of debt they carry, or their number of kids and
number of cars, and so on.
30.
Examples31.
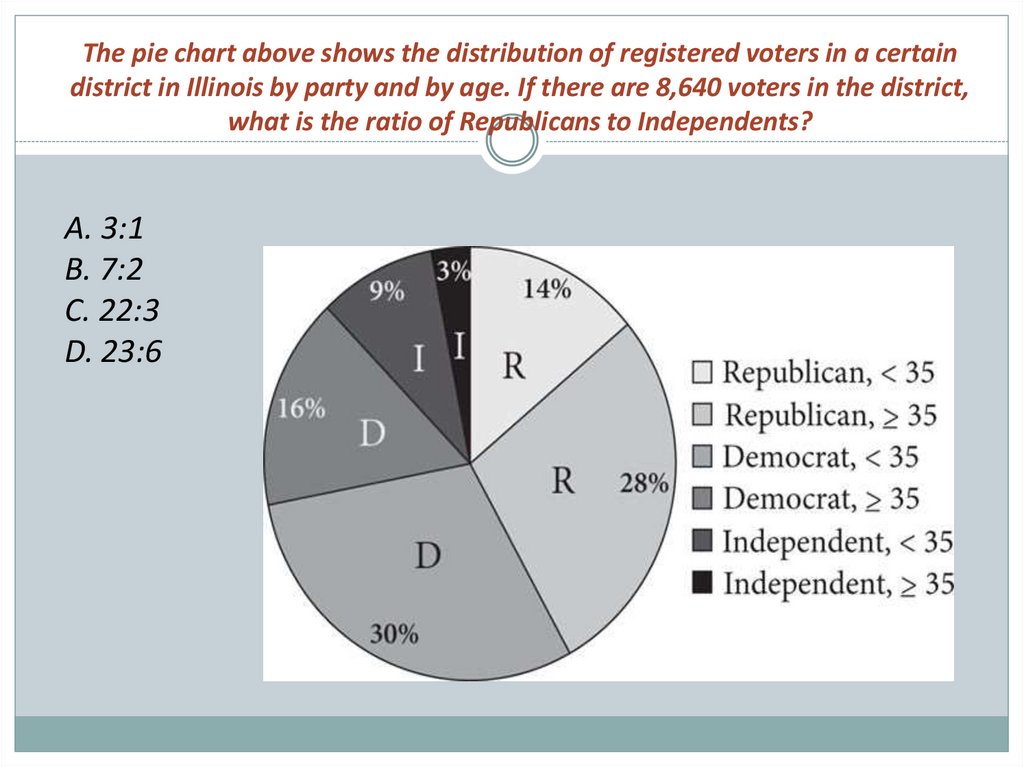
The pie chart above shows the distribution of registered voters in a certaindistrict in Illinois by party and by age. If there are 8,640 voters in the district,
what is the ratio of Republicans to Independents?
A. 3:1
B. 7:2
C. 22:3
D. 23:6
32.
Correct Answer: BStrategic Advice: Sometimes, a question includes information
that is not needed, making it appear more complicated than it
really is. In this question, the number of actual voters in the
district has nothing to do with the ratio that you're looking for.
Explanation: Because the figures in the pie chart are given as
percentages, the ratio will be the same no matter how many
voters there are in the district. All you need to do is compare
Republicans to Independents. The question does not specify an
age range, so add both together for each. The district consists of
14 + 28 = 42 parts Republican and 9 + 3 = 12 parts Independent,
so the ratio is 42:12, which reduces to 7:2.
33.
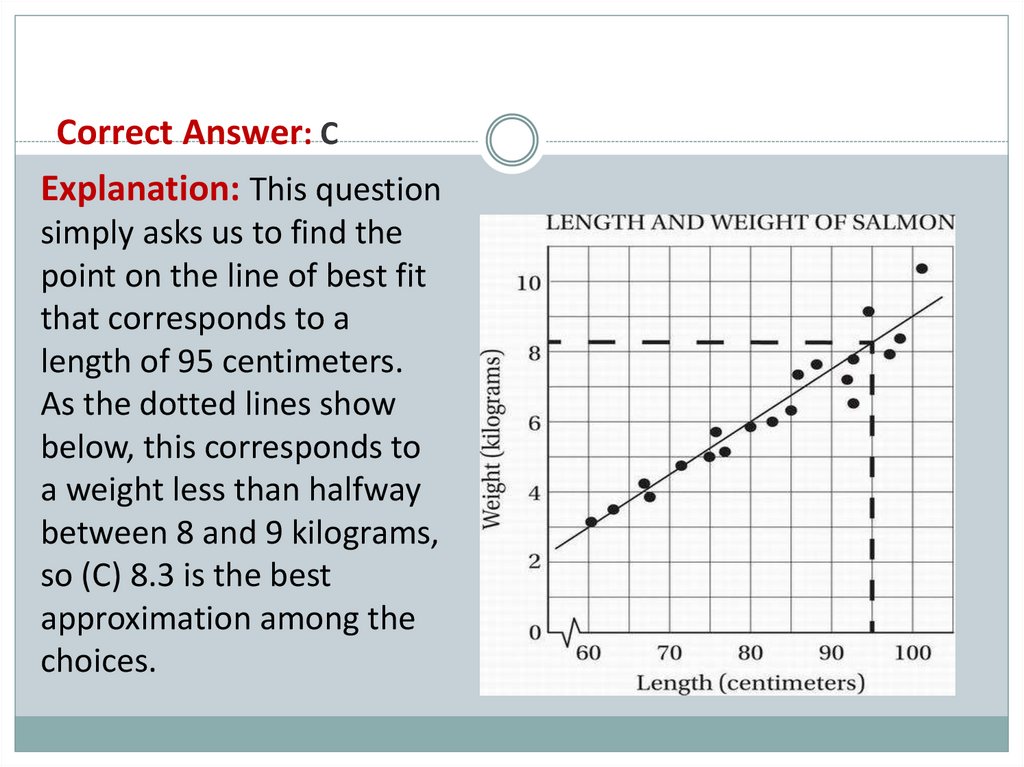
The scatterplot above shows the length and weight of a group of 20 salmon andthe line of best fit for the data. According to this line of best fit, which of the
following best approximates the weight, in kilograms, of a salmon that is 95
centimeters long?
A. 7.6
B. 7.8
C. 8.3
D. 8.8
34.
Correct Answer: CExplanation: This question
simply asks us to find the
point on the line of best fit
that corresponds to a
length of 95 centimeters.
As the dotted lines show
below, this corresponds to
a weight less than halfway
between 8 and 9 kilograms,
so (C) 8.3 is the best
approximation among the
choices.
35.
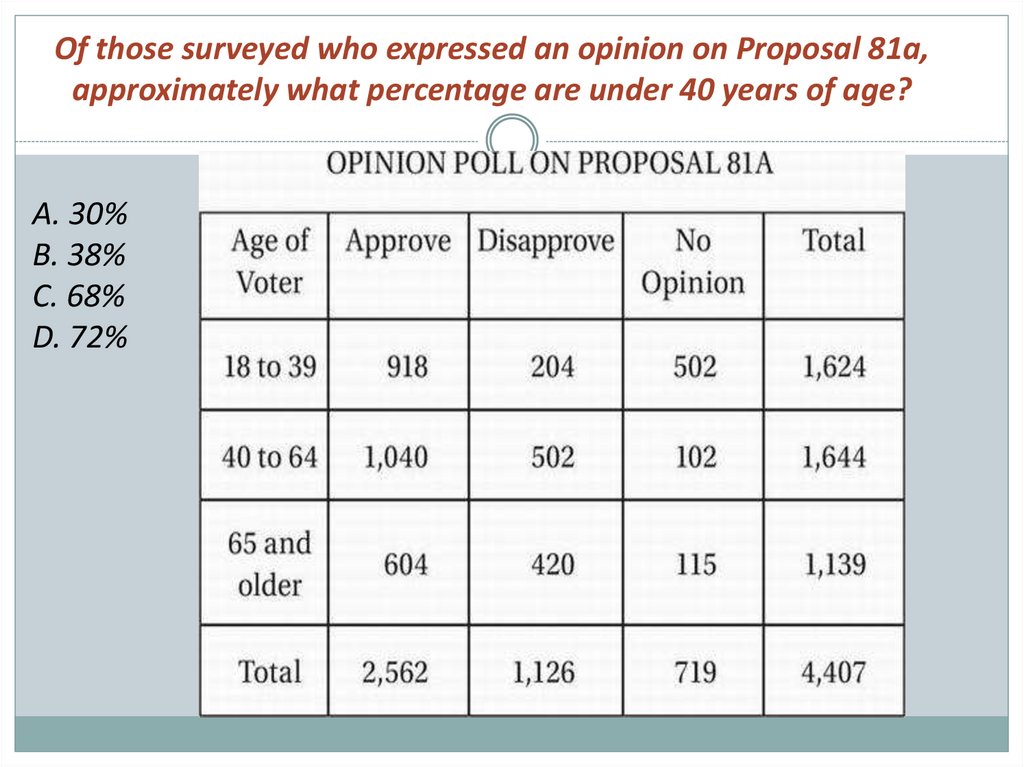
Of those surveyed who expressed an opinion on Proposal 81a,approximately what percentage are under 40 years of age?
A. 30%
B. 38%
C. 68%
D. 72%
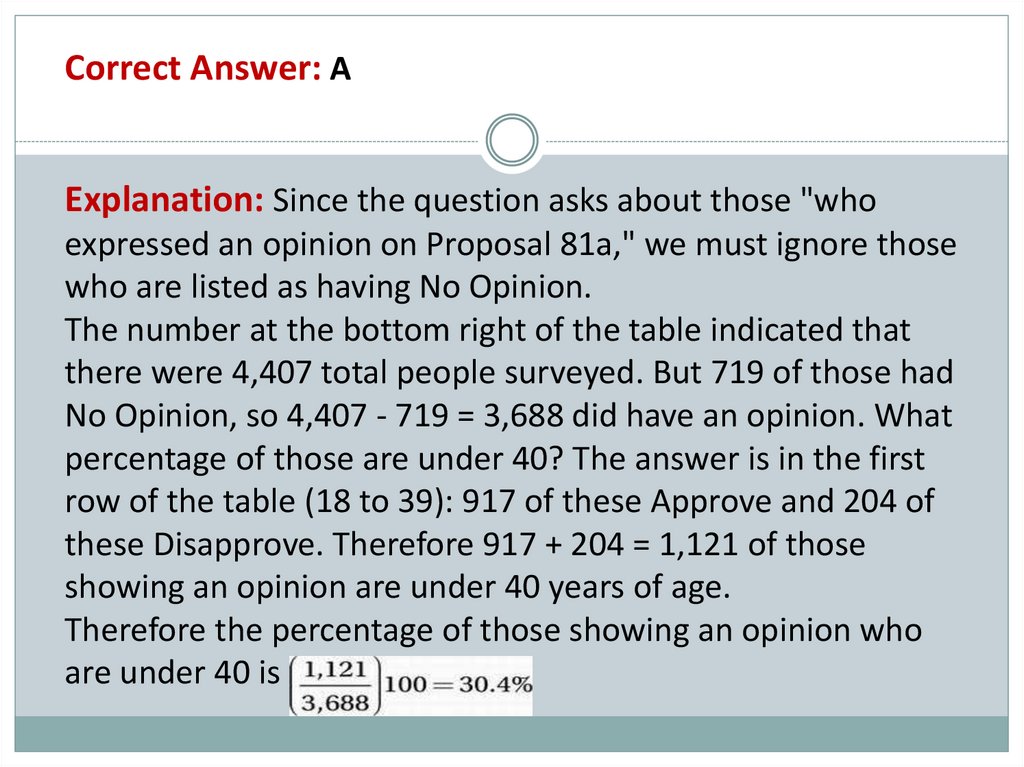
36.
Correct Answer: AExplanation: Since the question asks about those "who
expressed an opinion on Proposal 81a," we must ignore those
who are listed as having No Opinion.
The number at the bottom right of the table indicated that
there were 4,407 total people surveyed. But 719 of those had
No Opinion, so 4,407 - 719 = 3,688 did have an opinion. What
percentage of those are under 40? The answer is in the first
row of the table (18 to 39): 917 of these Approve and 204 of
these Disapprove. Therefore 917 + 204 = 1,121 of those
showing an opinion are under 40 years of age.
Therefore the percentage of those showing an opinion who
are under 40 is
37.
A bicyclist is training for the Liège-Bastogne-Liège, one of Europe's oldestroad bicycle races. The line graph above shows the number of miles she
biked each week for eight weeks. According to the graph, what was the
greatest change (in absolute value) in the weekly number of miles she
biked between two consecutive weeks?
A. 7
B. 8
C. 9
D. 10
38.
Correct Answer: DStrategic Advice: The greatest change (in absolute value) in miles ridden per
week could be an increase or a decrease. Try organizing the changes in a
table (or a simple list).
Explanation: Make a list to show the changes in miles ridden per week
between each pair of consecutive weeks. You don't have to worry about
whether the change is positive or negative, so to keep things simple, always
subtract the smaller number from the larger number. Save yourself some
time by skipping weeks that clearly have smaller changes, such as between
weeks 1 and 2 and between weeks 3 and 4.
Weeks 2-3: 72 – 64 = 8
Weeks 4-5: 78 – 70 = 8
Weeks 5-6: 85 – 78 = 7
Weeks 6-7: 85 – 75 = 10
Weeks 7-8: 82 – 75 = 7
Of the differences, the greatest is from week 6 to week 7, which is a change
of 10 miles, making (D) correct.
39.
The bar graph above shows the results of a grammar quiz in alanguage arts class. What is the difference between the mean and
median of the quiz scores? ( Round your answer to the nearest
hundredth.)
40.
Correct Answer: 0,29Strategic Advice: Knowing basic statistics definitions is the key to
answering a question like this. The calculations aren't difficult-you just
have to know how to perform them.
Explanation: When data values are arranged from least to greatest,
the median is the value in the middle. Add the bar heights to find that
there are 52 students represented in the bar graph, which is an even
number, so take the average of the two middle values to get the
median. Half of 52 is 26, so the values in the middle are the 26th and
27th value. Both of these values are 6, so the median is 6. To find the
mean, add all the quiz scores together and divide by the number of
students, 52. To speed up the calculations, multiply each bar height
by the corresponding score (mentally if possible):
Rounded to the nearest hundredth, the difference between
the median and the mean is 6,29 - 6 = 0,29. Grid this in as
0,29.