


 biology
Similar presentations:


")


AFM study of mitochondria of C. Elegans: N2, MTX2 and GAS-1
1.
AFM study of mitochondria of C. Elegans:N2, MTX2 and GAS-1
2.
To remind:mitochondria of human fibroblasts
3.
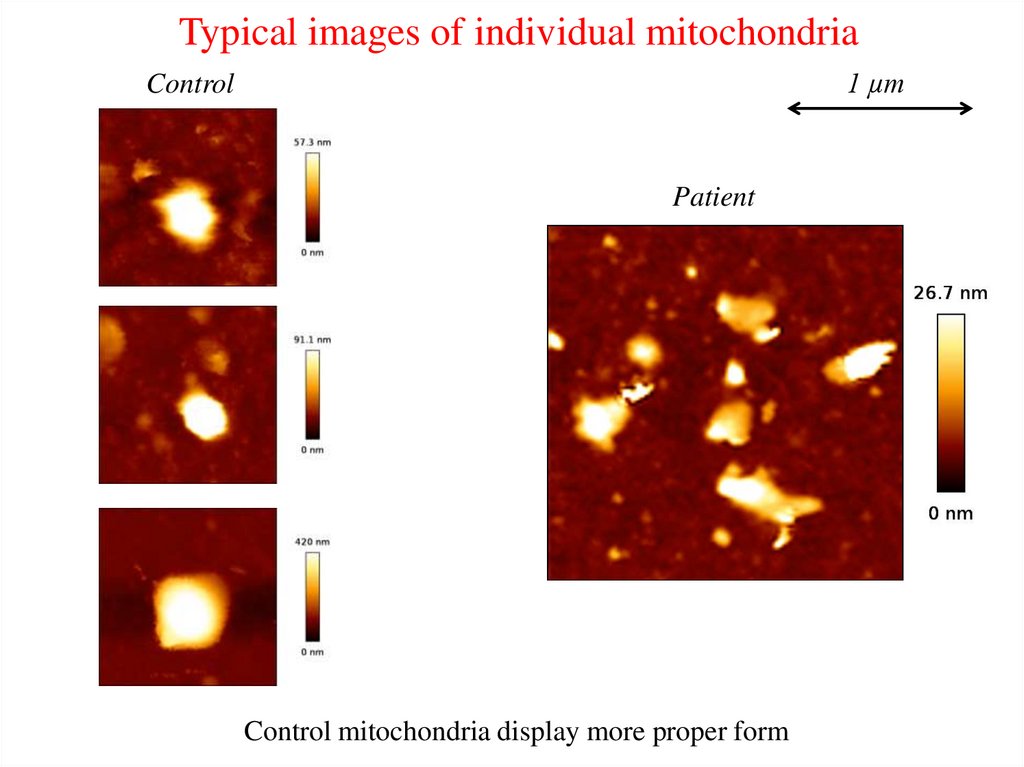
Typical images of individual mitochondria1 µm
Control
Patient
Control mitochondria display more proper form
4.
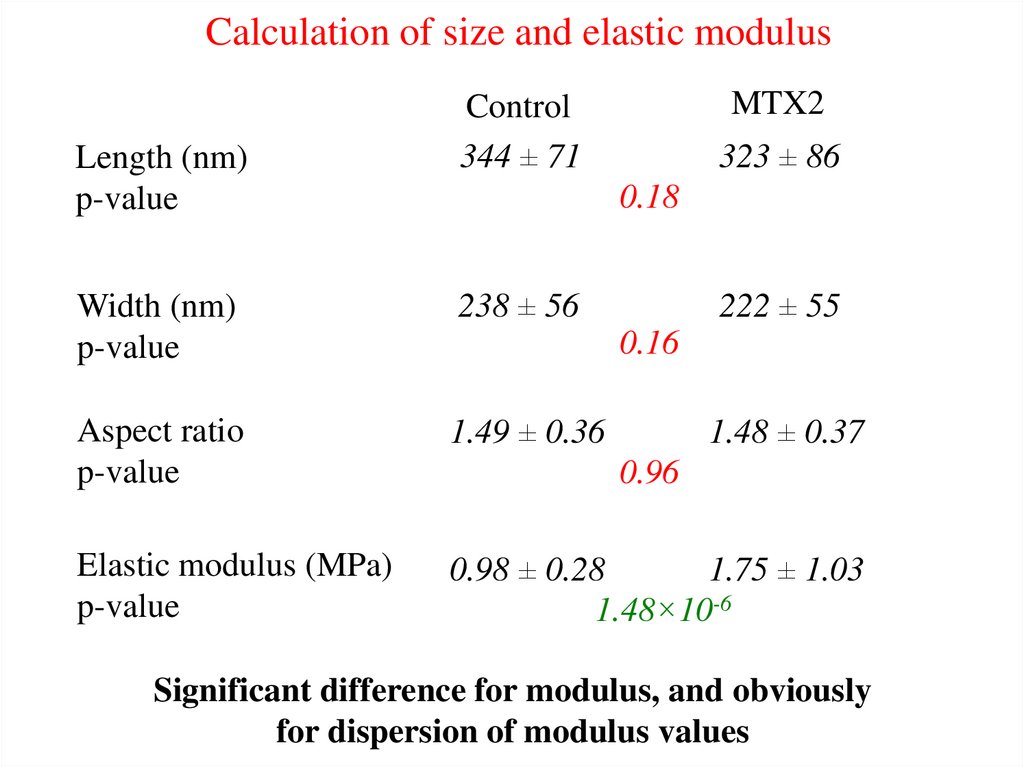
Calculation of size and elastic modulusLength (nm)
p-value
MTX2
Control
344 ± 71
323 ± 86
0.18
Width (nm)
p-value
238 ± 56
222 ± 55
Aspect ratio
p-value
1.49 ± 0.36
Elastic modulus (MPa)
p-value
0.98 ± 0.28
1.75 ± 1.03
1.48×10⁻⁶
0.16
1.48 ± 0.37
0.96
Significant difference for modulus, and obviously
for dispersion of modulus values
5.
C. Elegans mitochondria6.
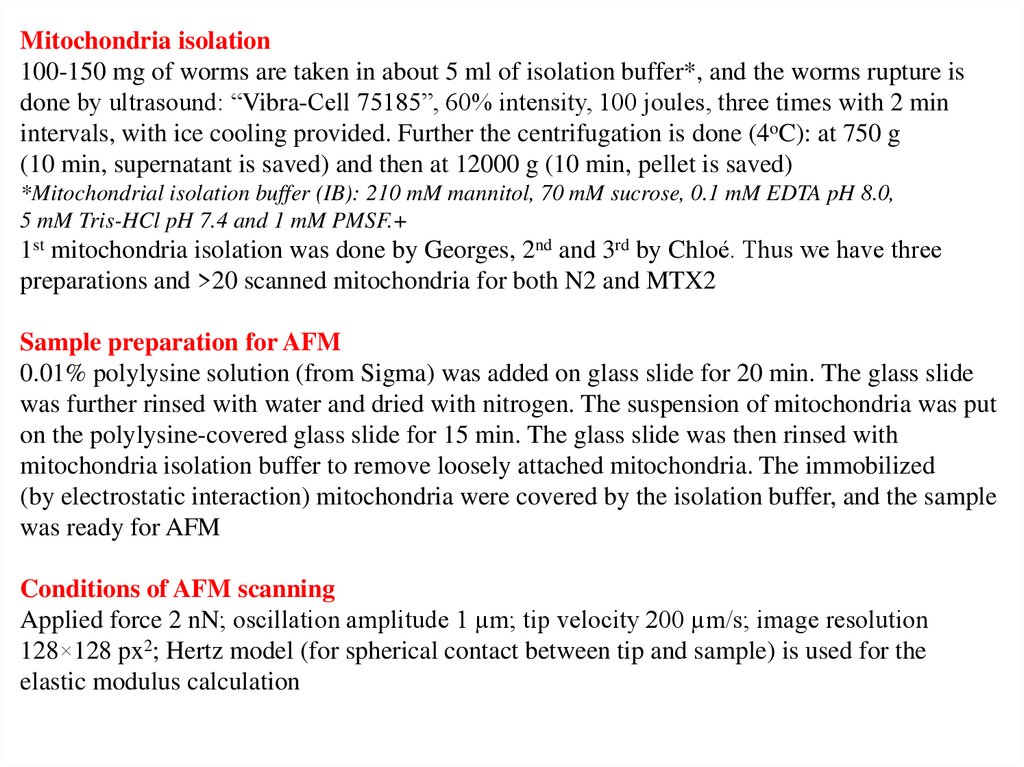
Mitochondria isolation100-150 mg of worms are taken in about 5 ml of isolation buffer*, and the worms rupture is
done by ultrasound: “Vibra-Cell 75185”, 60% intensity, 100 joules, three times with 2 min
intervals, with ice cooling provided. Further the centrifugation is done (4oC): at 750 g
(10 min, supernatant is saved) and then at 12000 g (10 min, pellet is saved)
*Mitochondrial isolation buffer (IB): 210 mM mannitol, 70 mM sucrose, 0.1 mM EDTA pH 8.0,
5 mM Tris-HCl pH 7.4 and 1 mM PMSF.+
1st mitochondria isolation was done by Georges, 2nd and 3rd by Chloé. Thus we have three
preparations and >20 scanned mitochondria for both N2 and MTX2
Sample preparation for AFM
0.01% polylysine solution (from Sigma) was added on glass slide for 20 min. The glass slide
was further rinsed with water and dried with nitrogen. The suspension of mitochondria was put
on the polylysine-covered glass slide for 15 min. The glass slide was then rinsed with
mitochondria isolation buffer to remove loosely attached mitochondria. The immobilized
(by electrostatic interaction) mitochondria were covered by the isolation buffer, and the sample
was ready for AFM
Conditions of AFM scanning
Applied force 2 nN; oscillation amplitude 1 µm; tip velocity 200 µm/s; image resolution
128×128 px2; Hertz model (for spherical contact between tip and sample) is used for the
elastic modulus calculation
7.
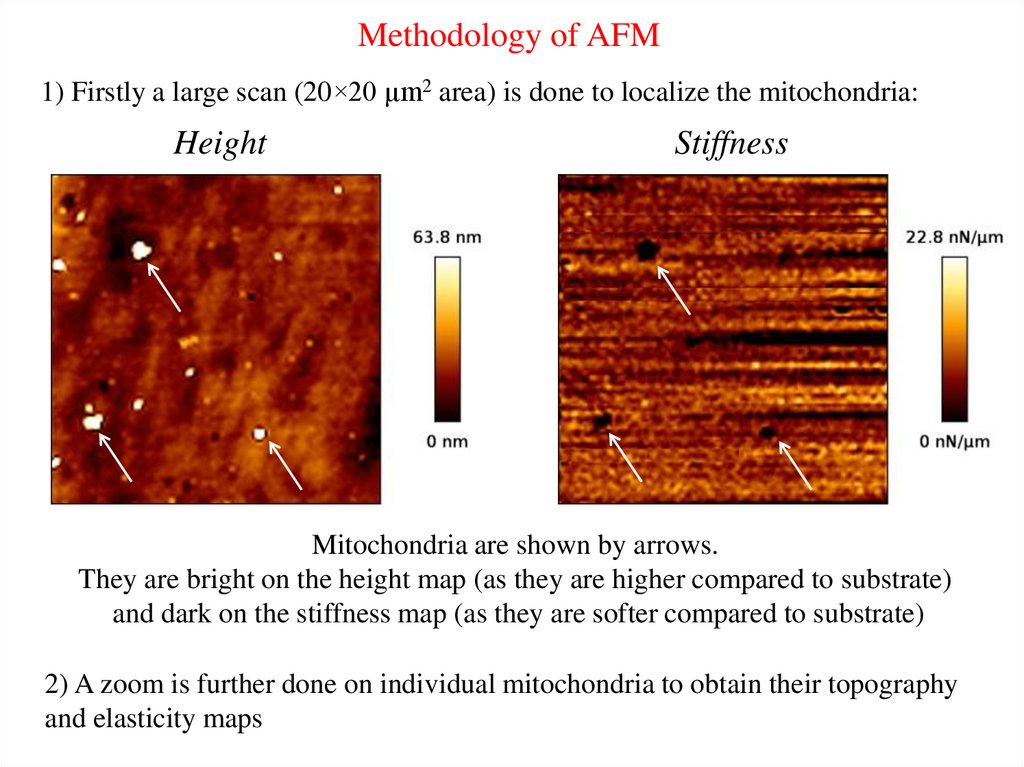
Methodology of AFM1) Firstly a large scan (20×20 µm2 area) is done to localize the mitochondria:
Height
Stiffness
Mitochondria are shown by arrows.
They are bright on the height map (as they are higher compared to substrate)
and dark on the stiffness map (as they are softer compared to substrate)
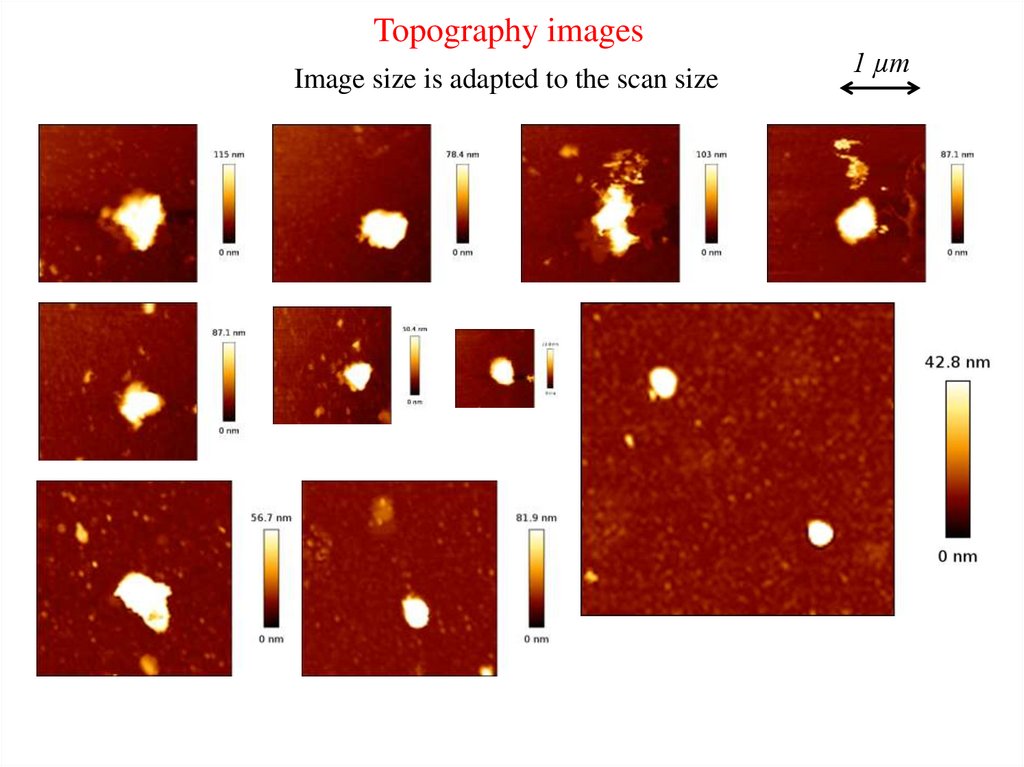
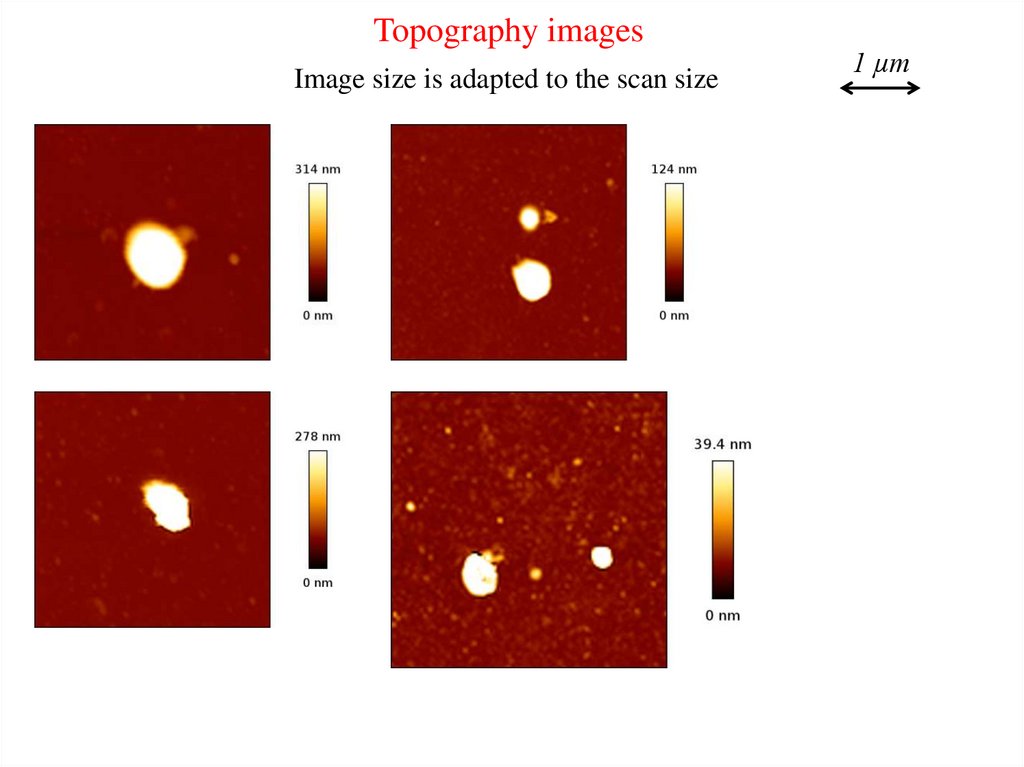
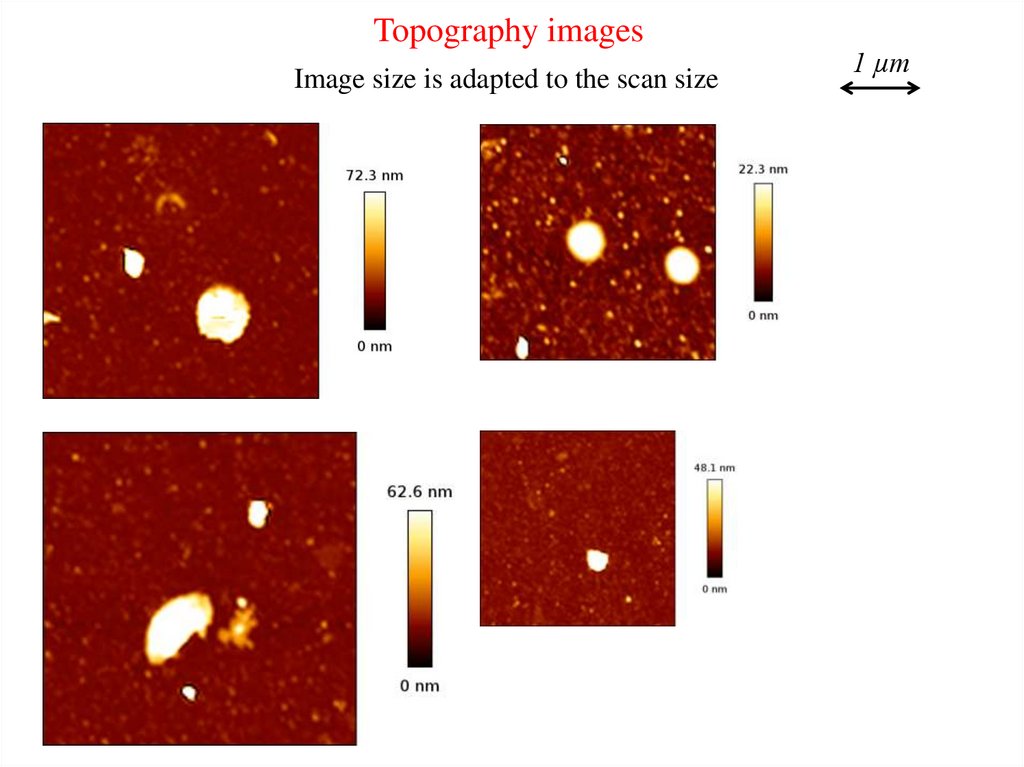
2) A zoom is further done on individual mitochondria to obtain their topography
and elasticity maps
8.
Untreated mitochondria9.
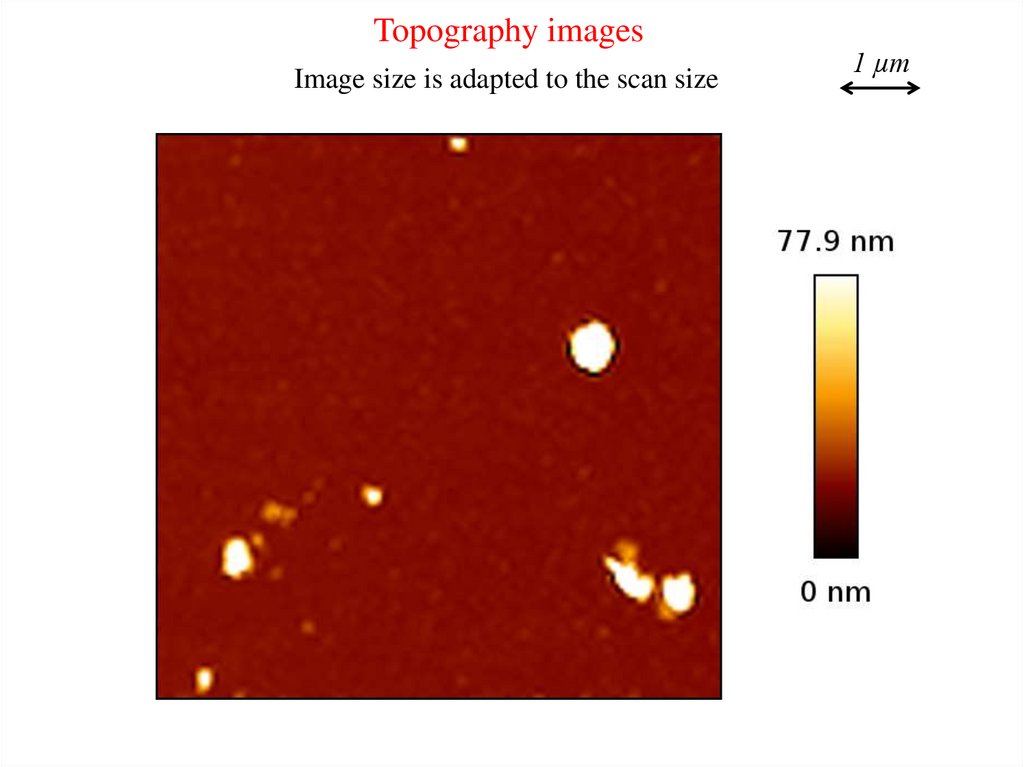
Control N210.
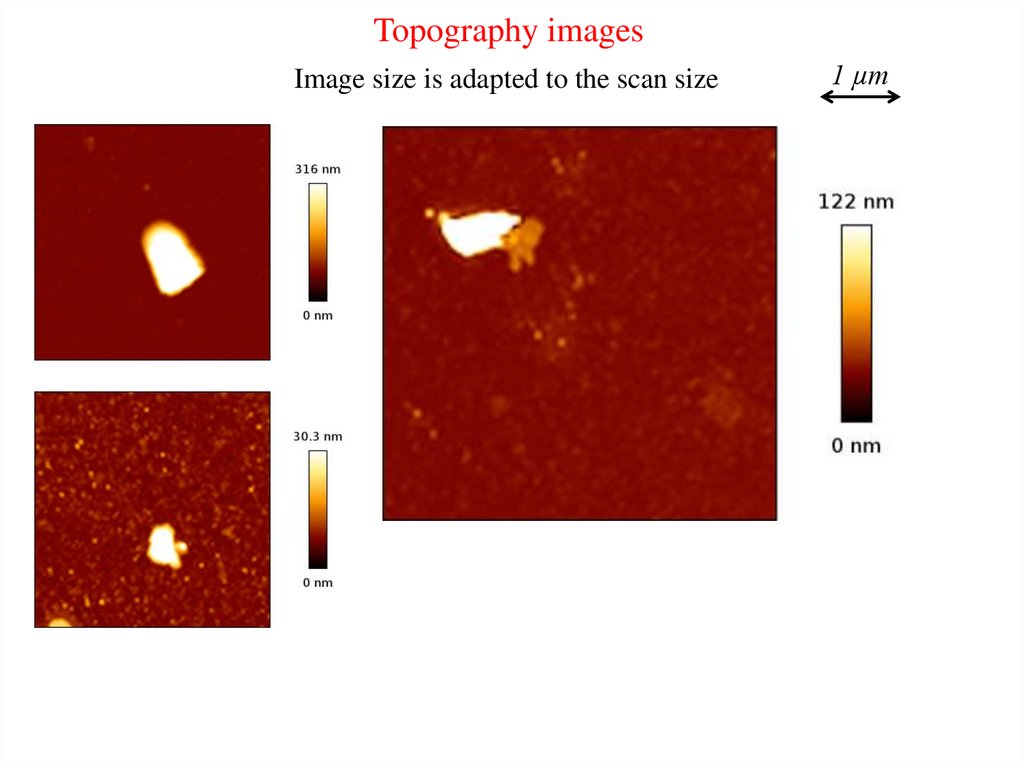
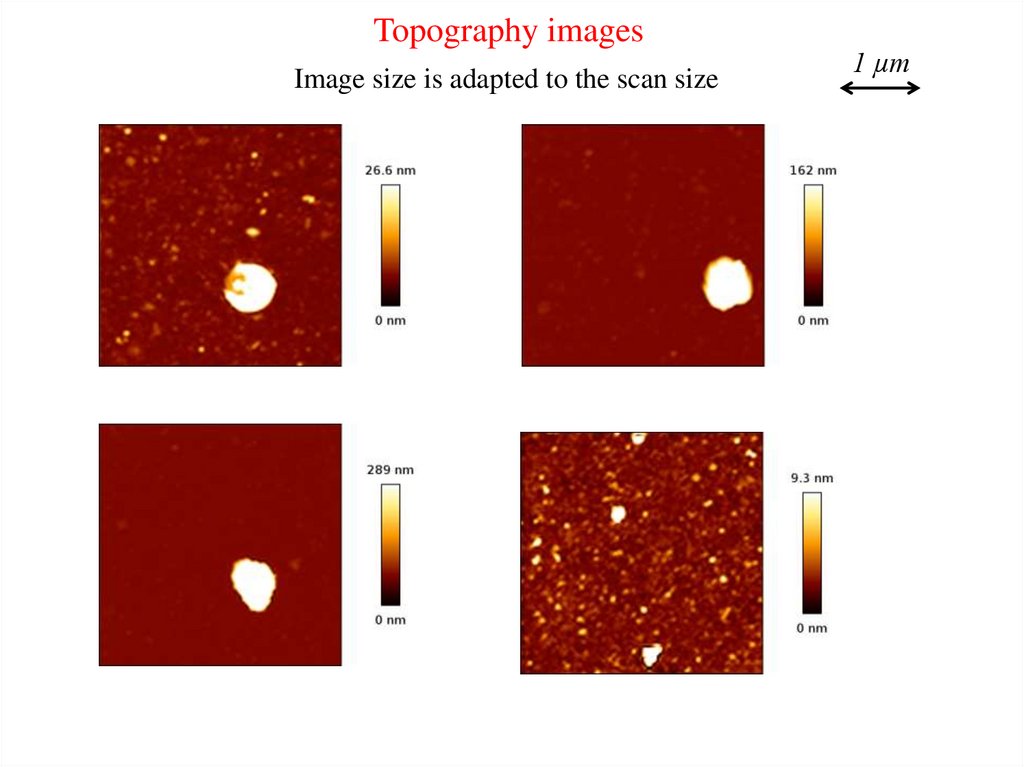
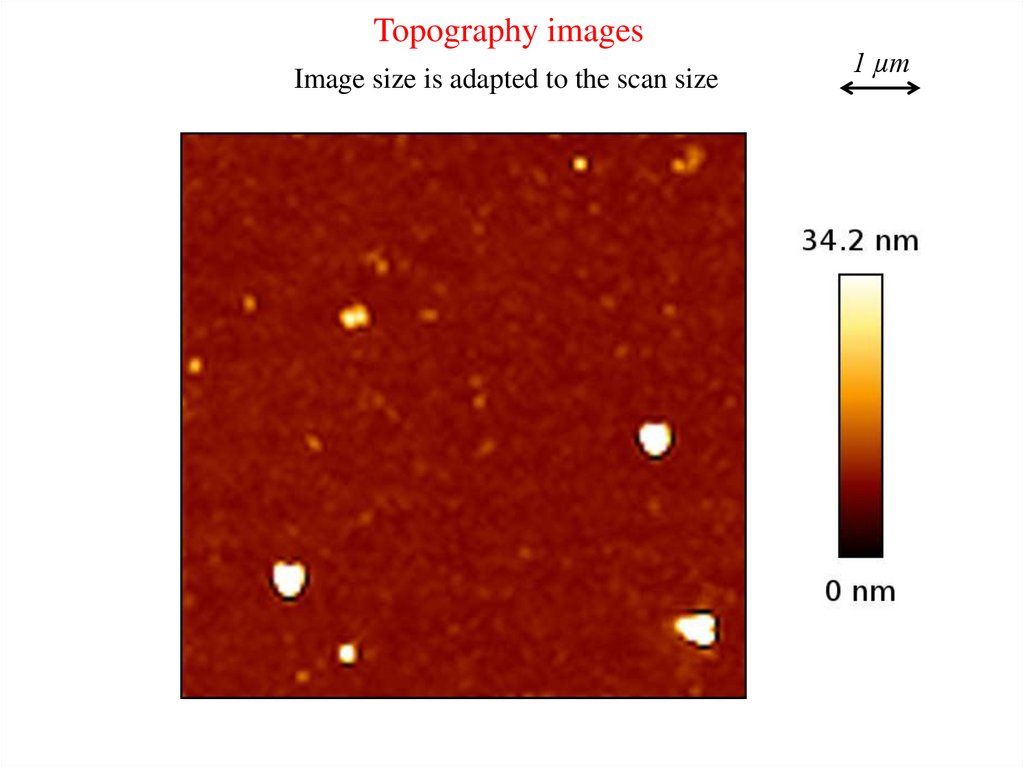
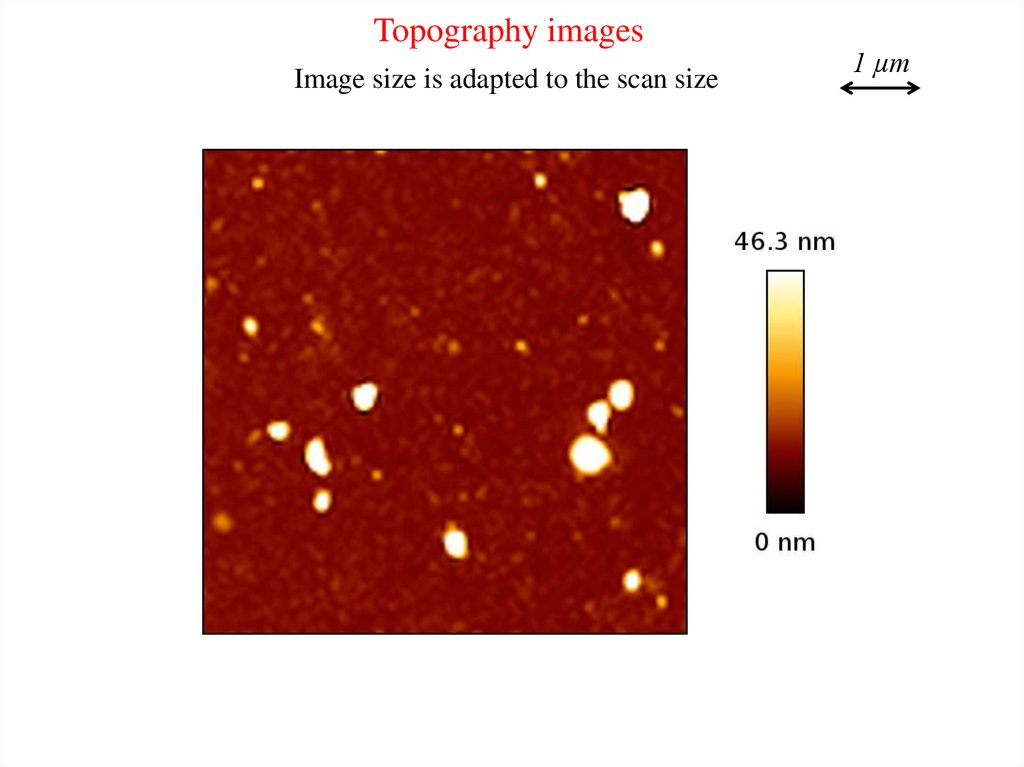
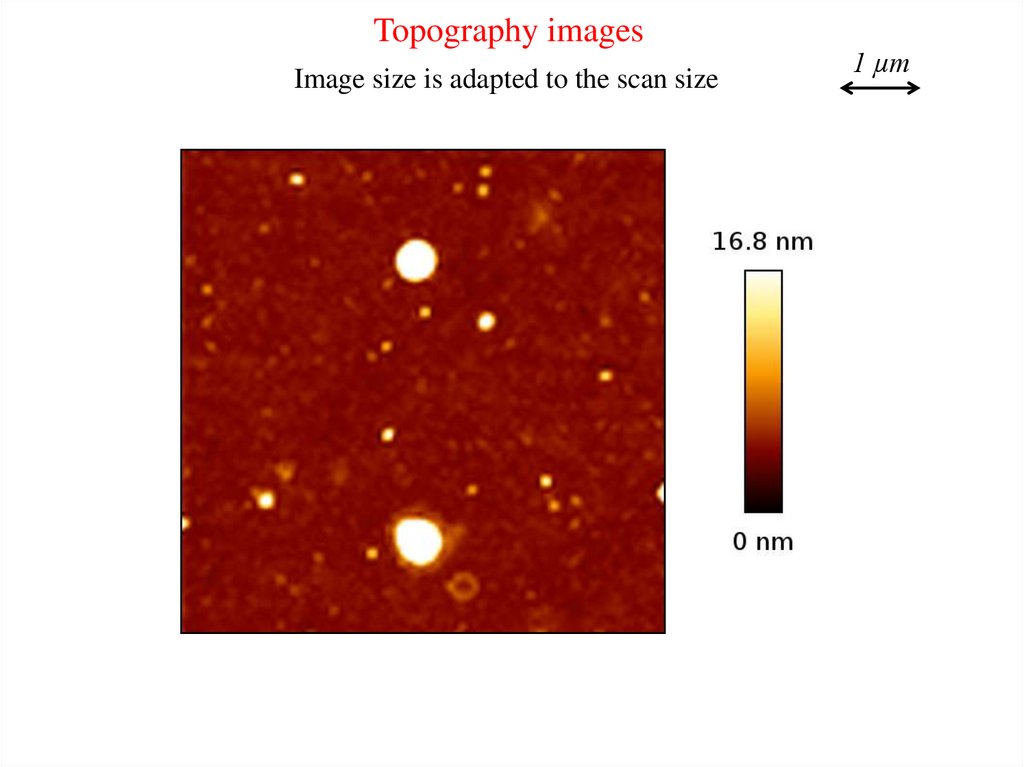
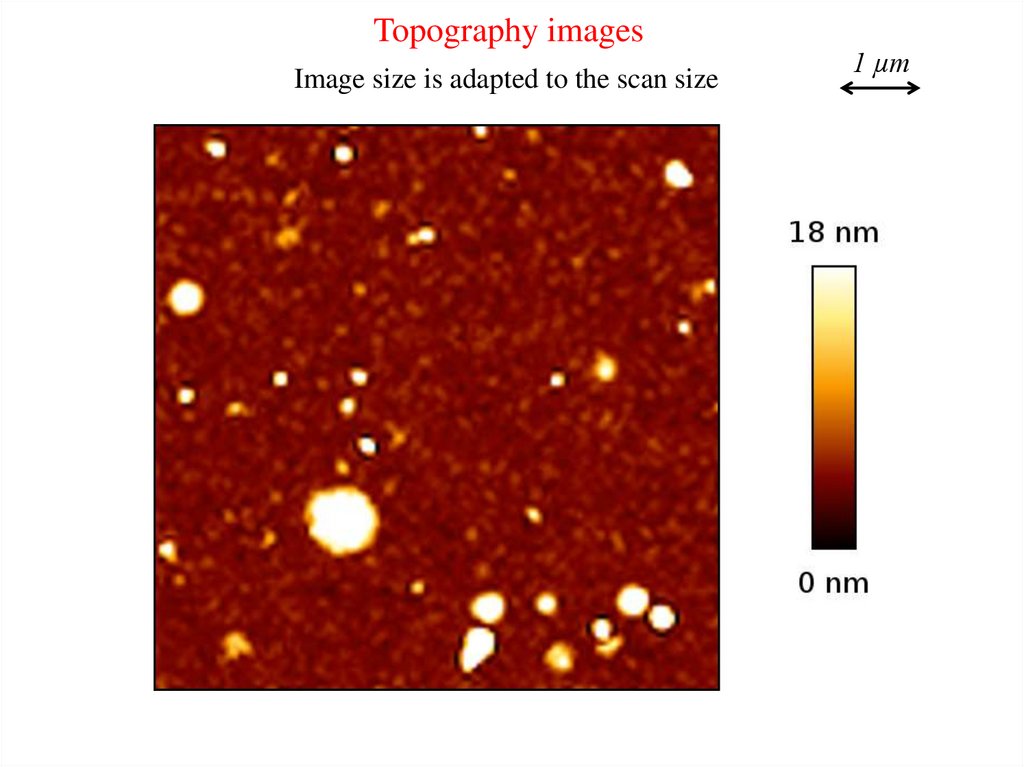
Topography imagesImage size is adapted to the scan size
1 µm
11.
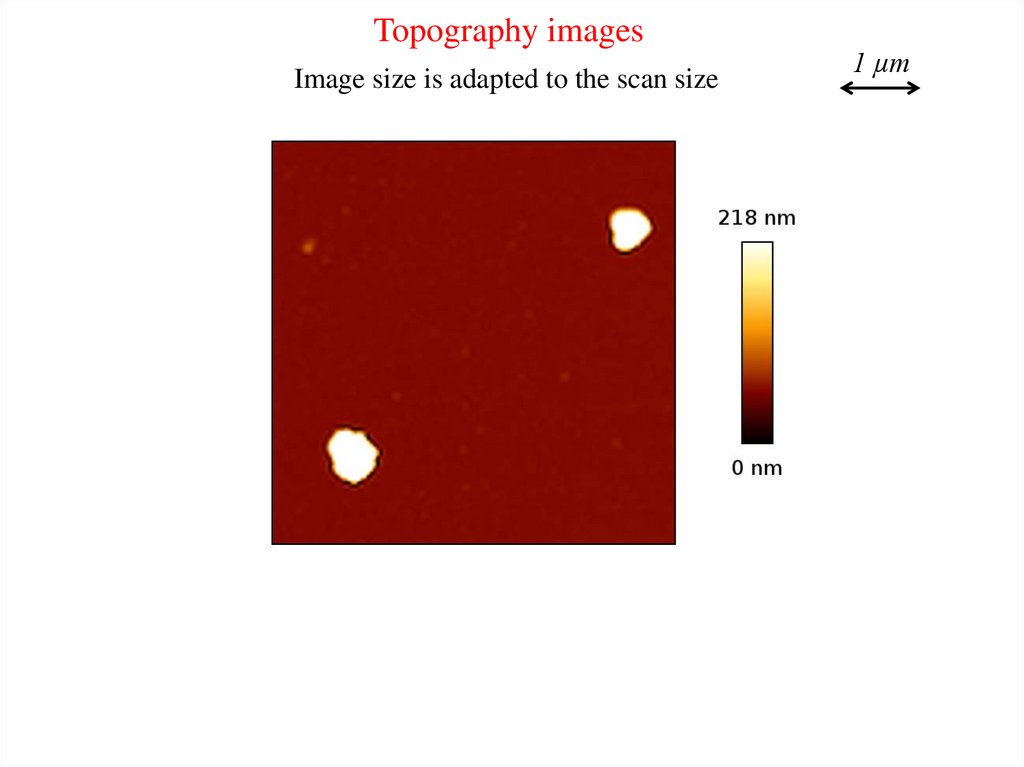
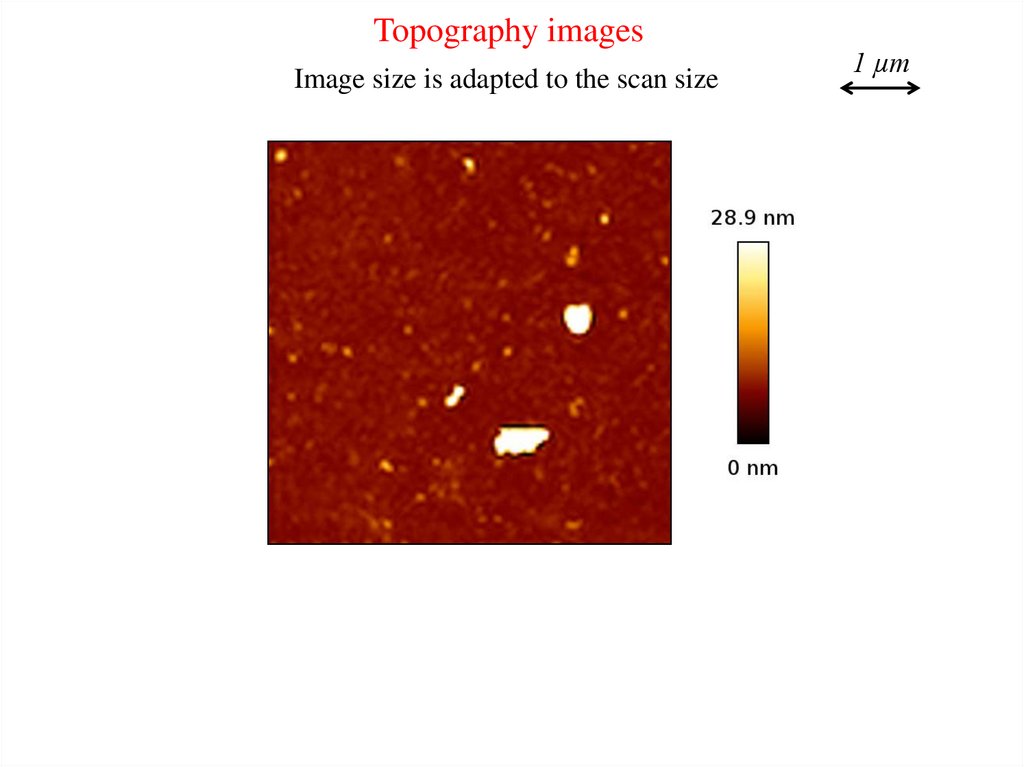
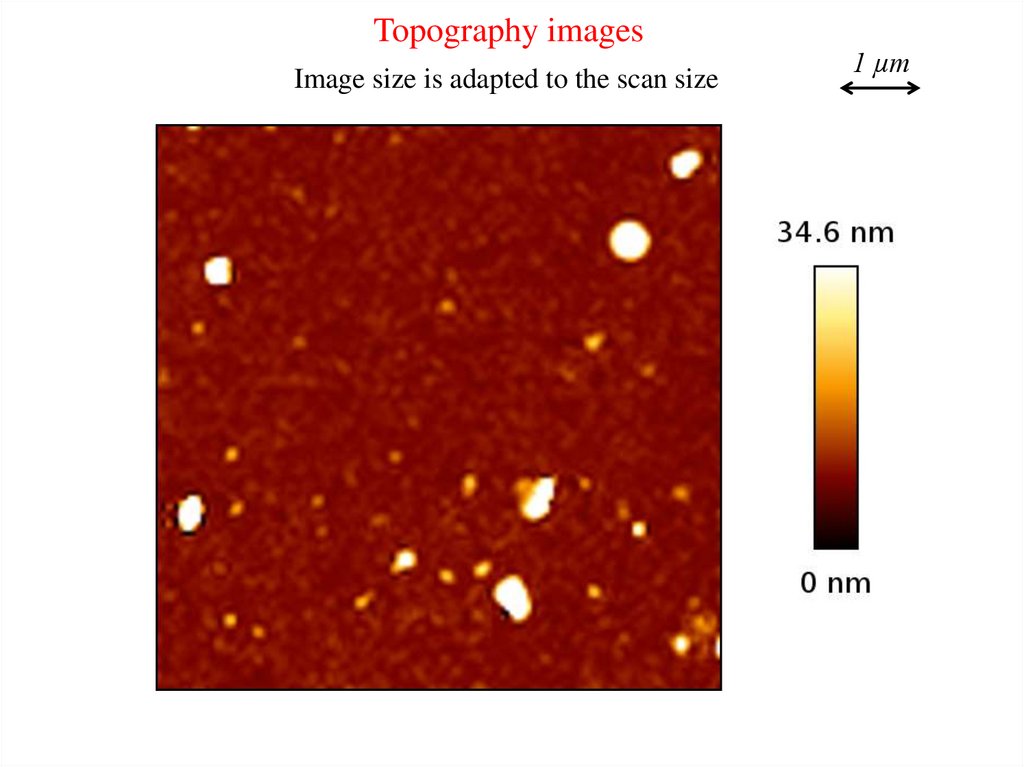
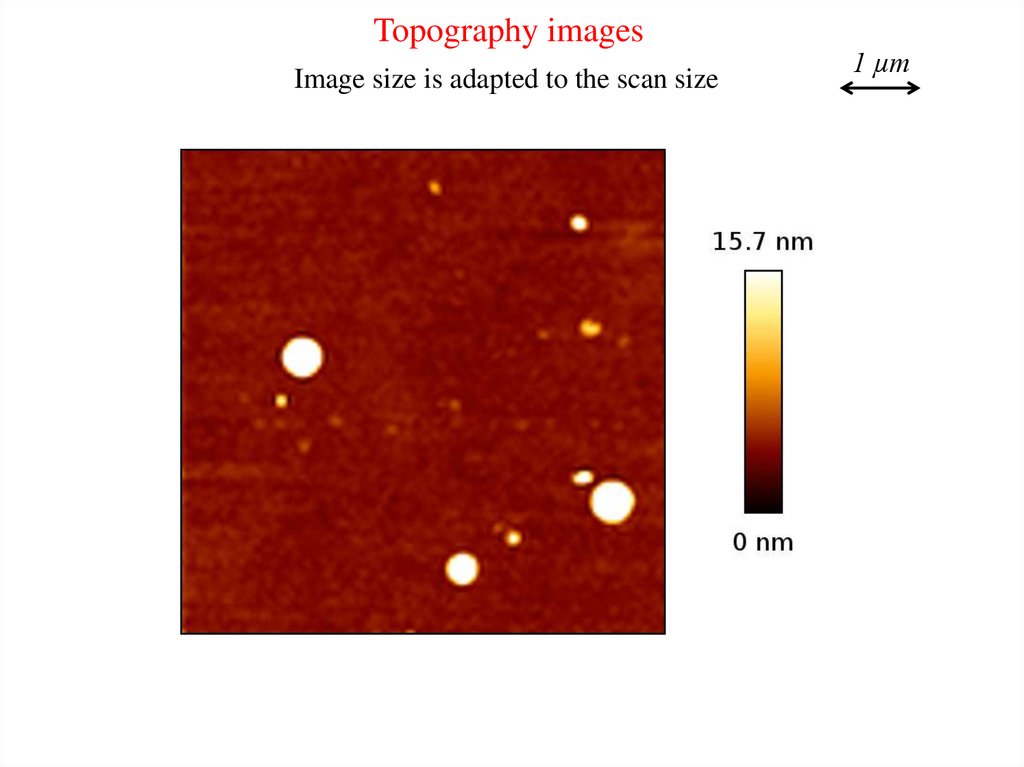
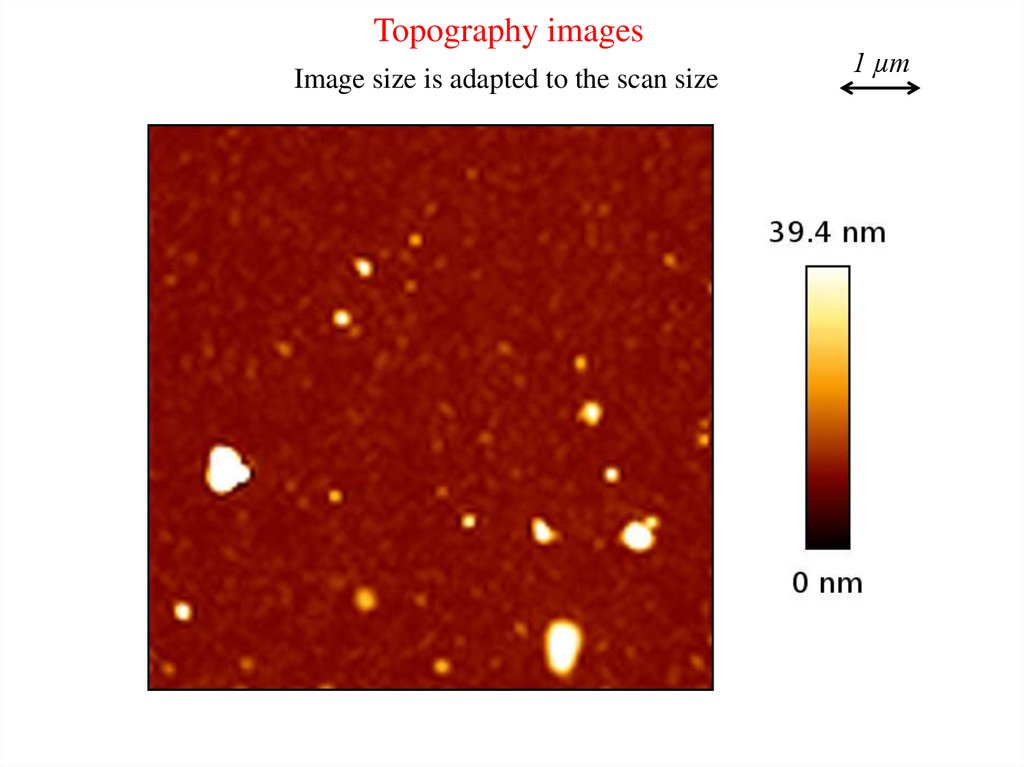
Topography imagesImage size is adapted to the scan size
1 µm
12.
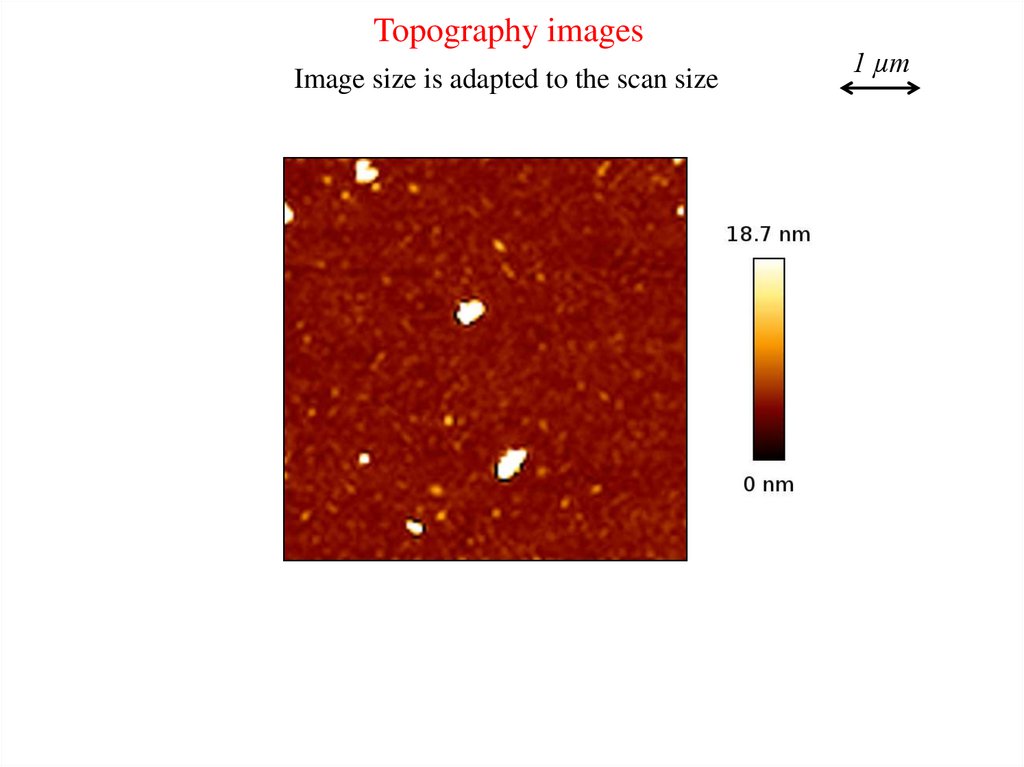
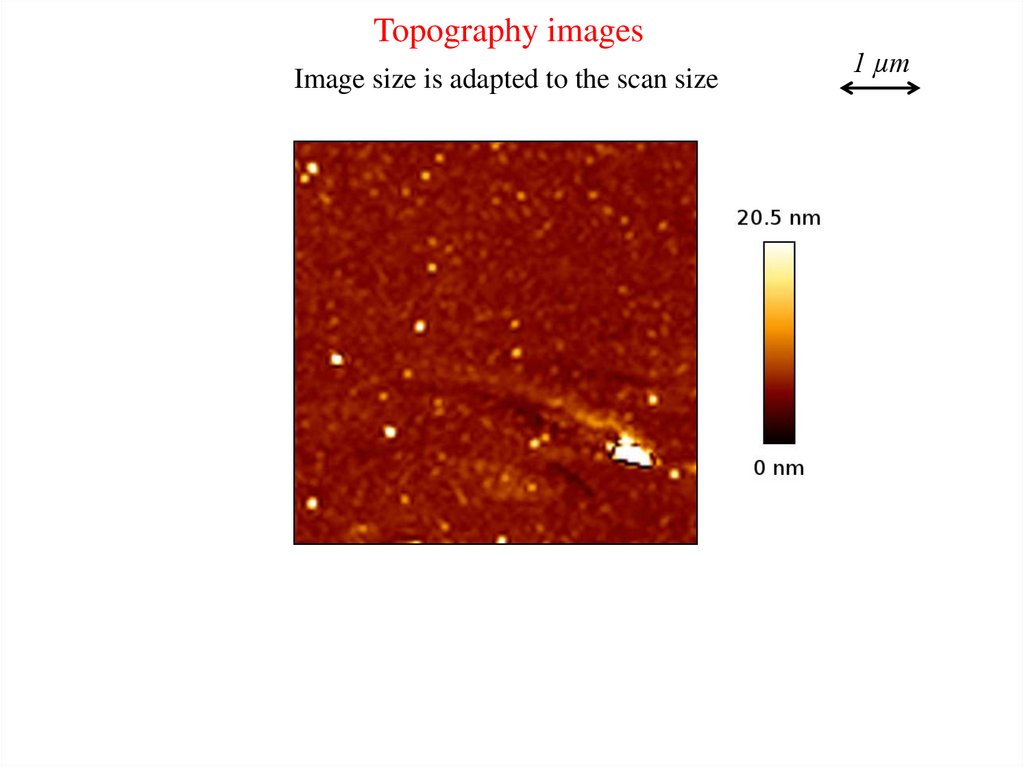
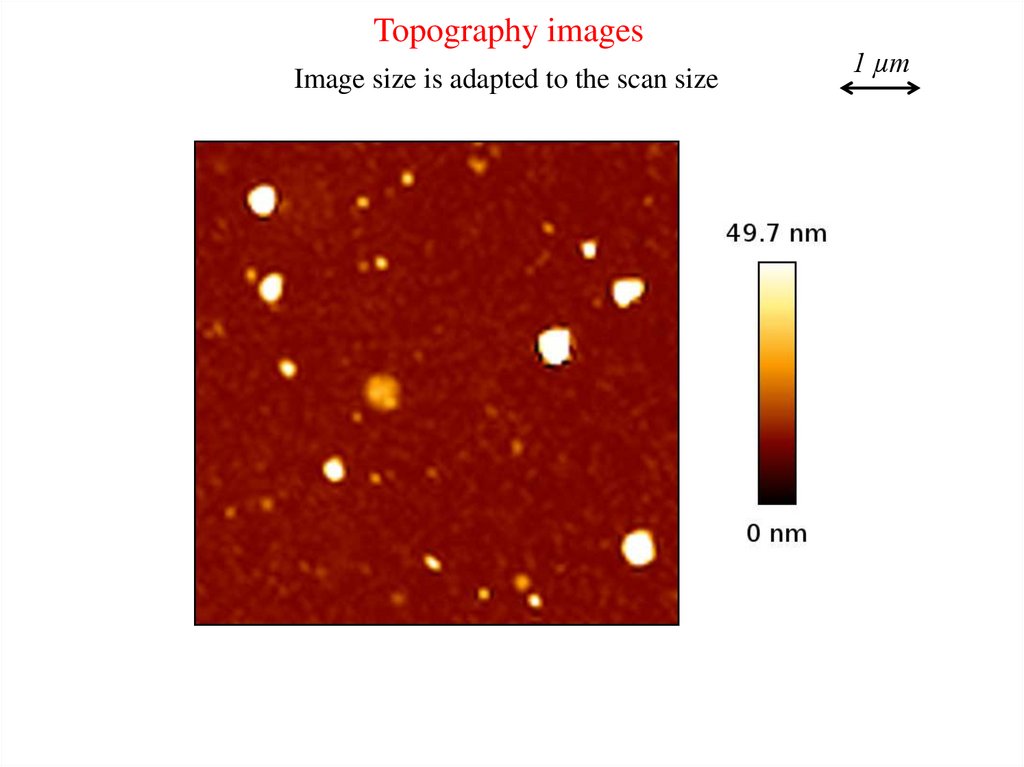
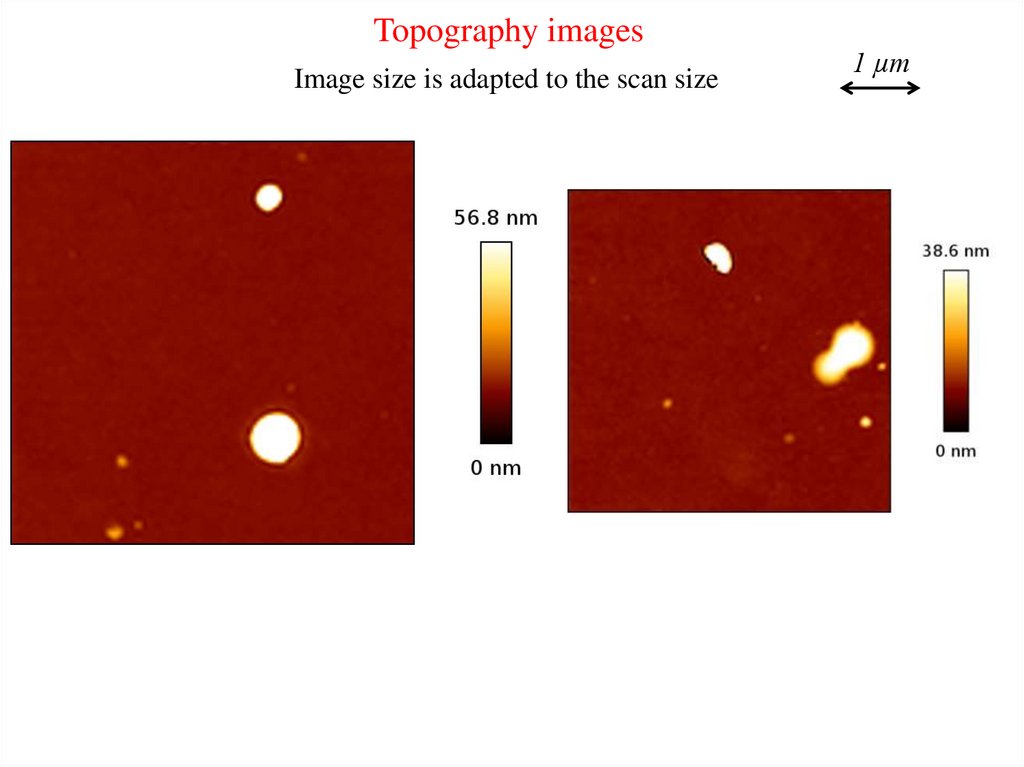
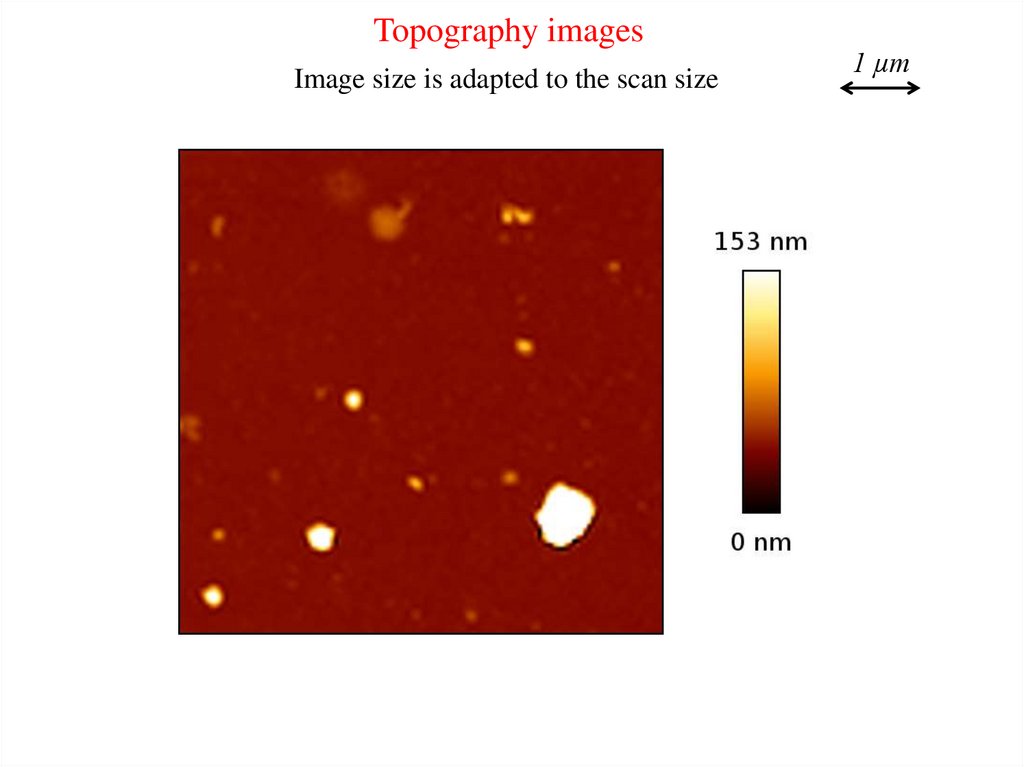
Topography imagesImage size is adapted to the scan size
1 µm
13.
MTX2 mutants14.
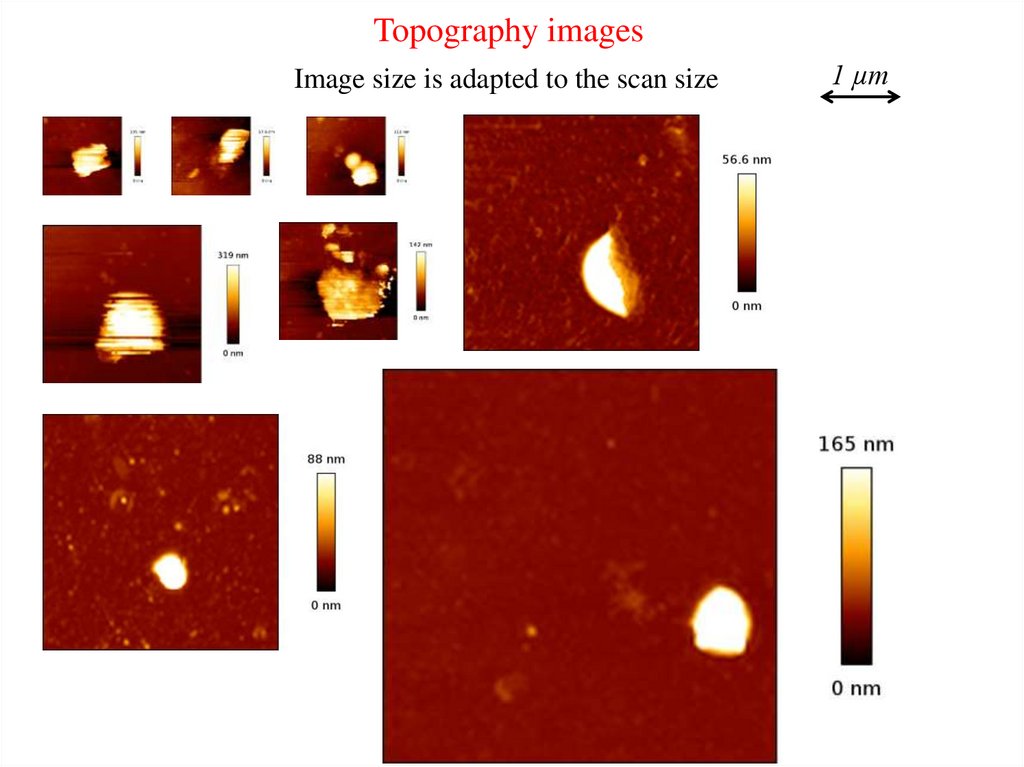
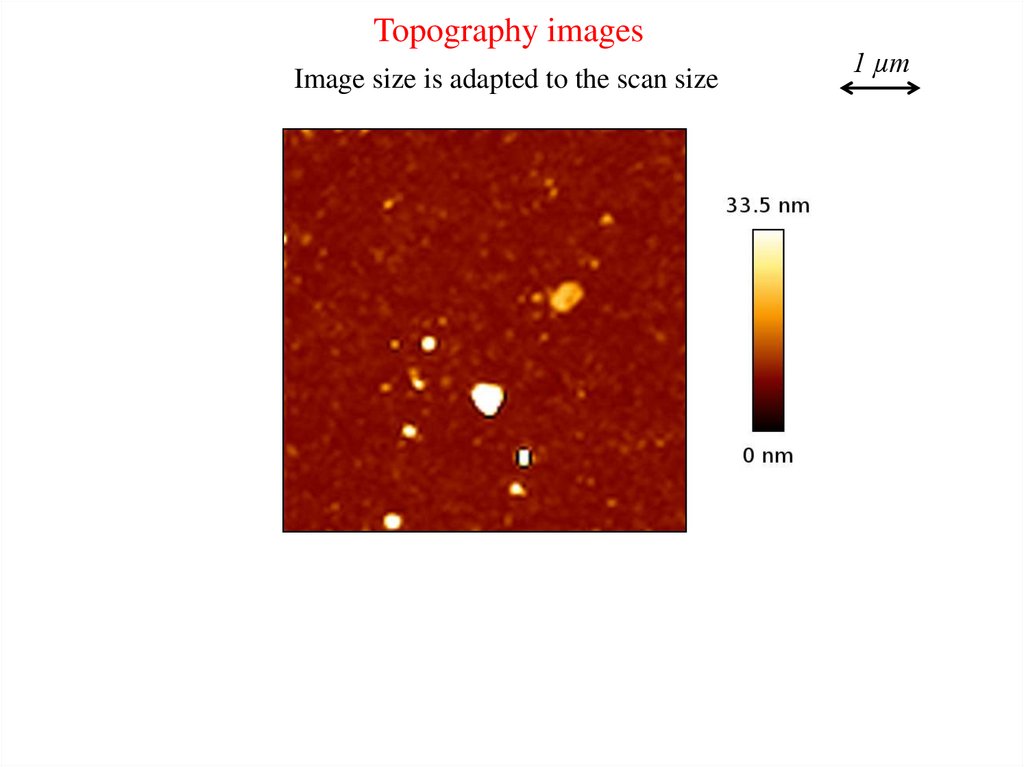
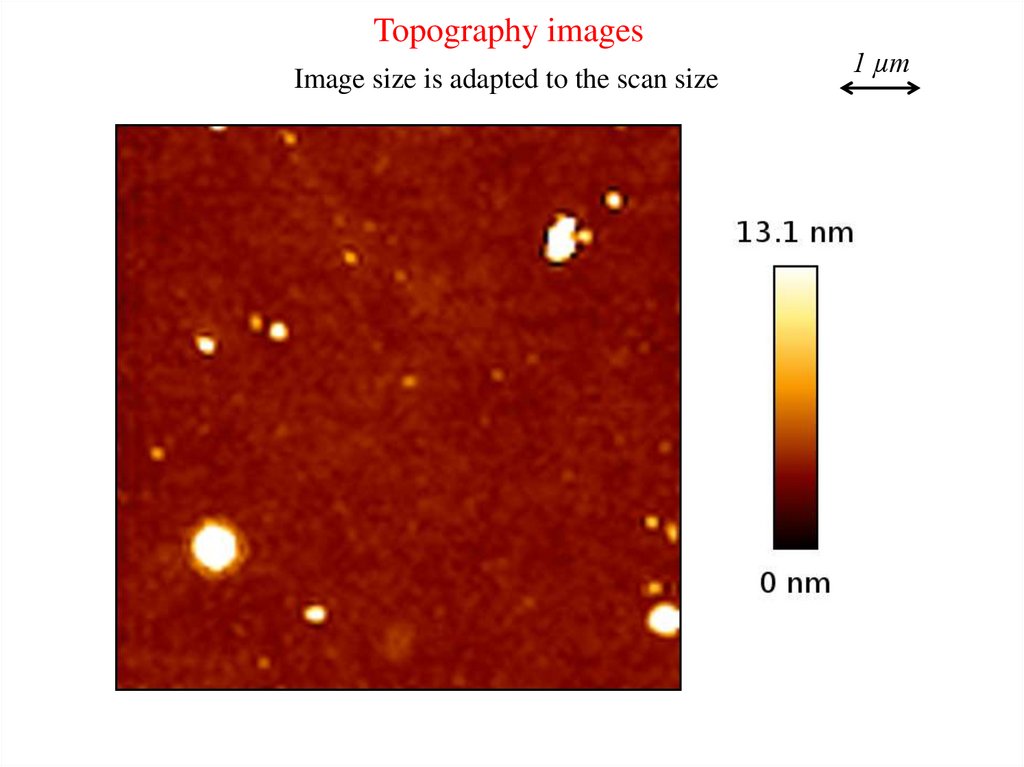
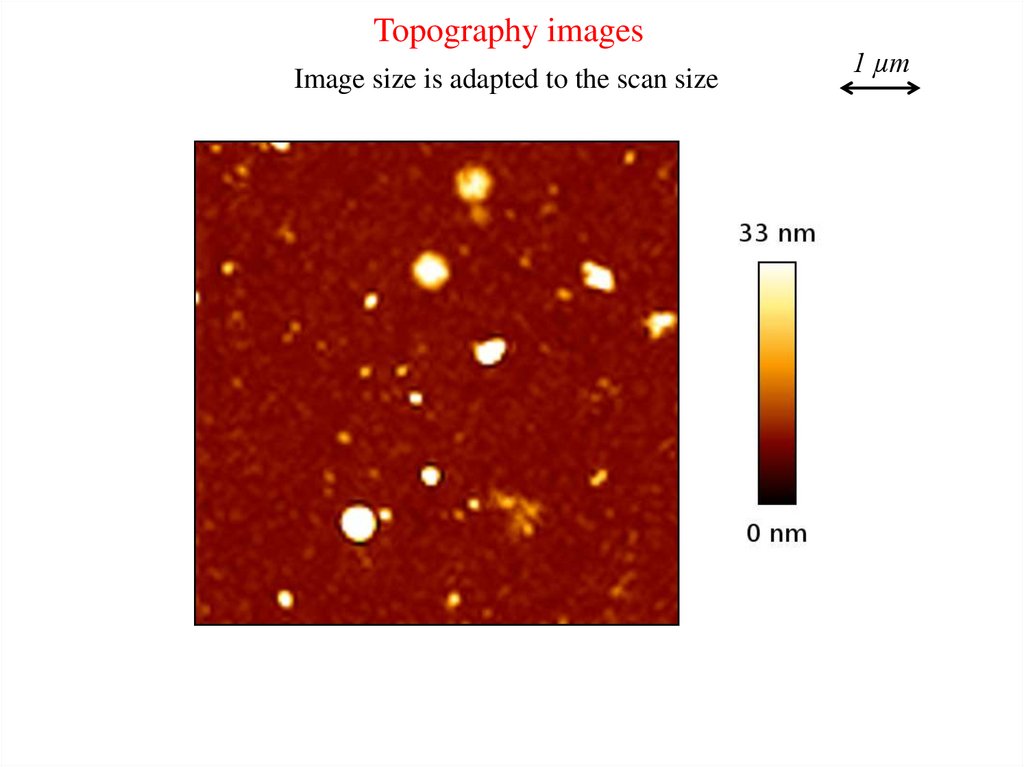
Topography imagesImage size is adapted to the scan size
1 µm
15.
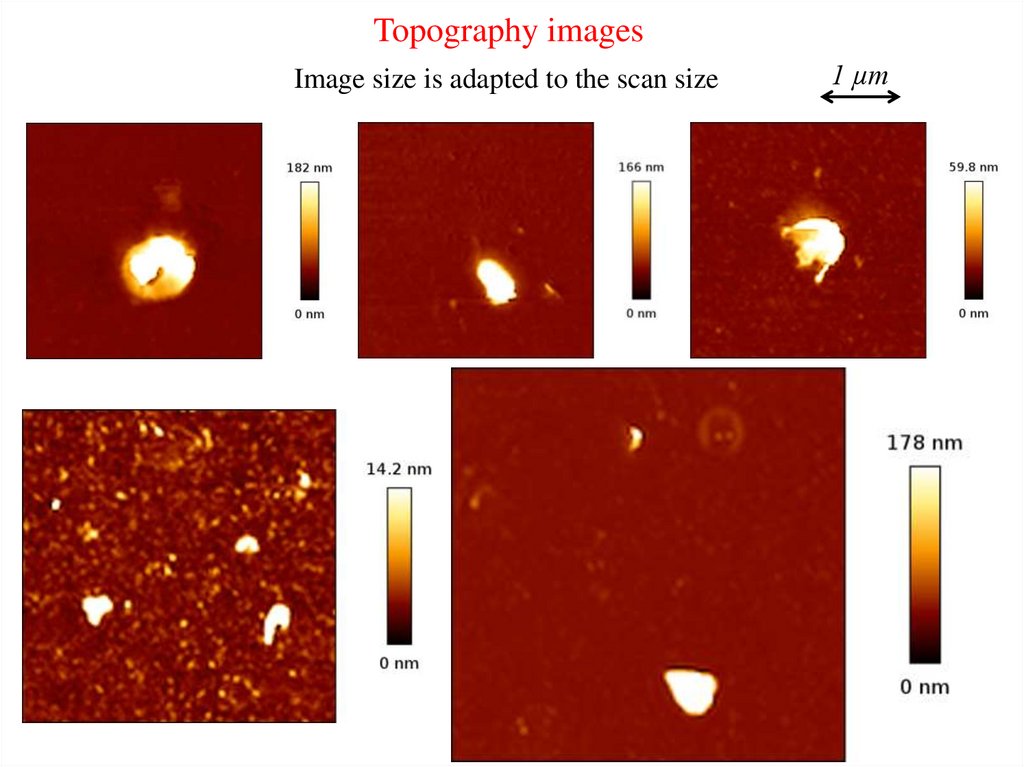
Topography imagesImage size is adapted to the scan size
1 µm
16.
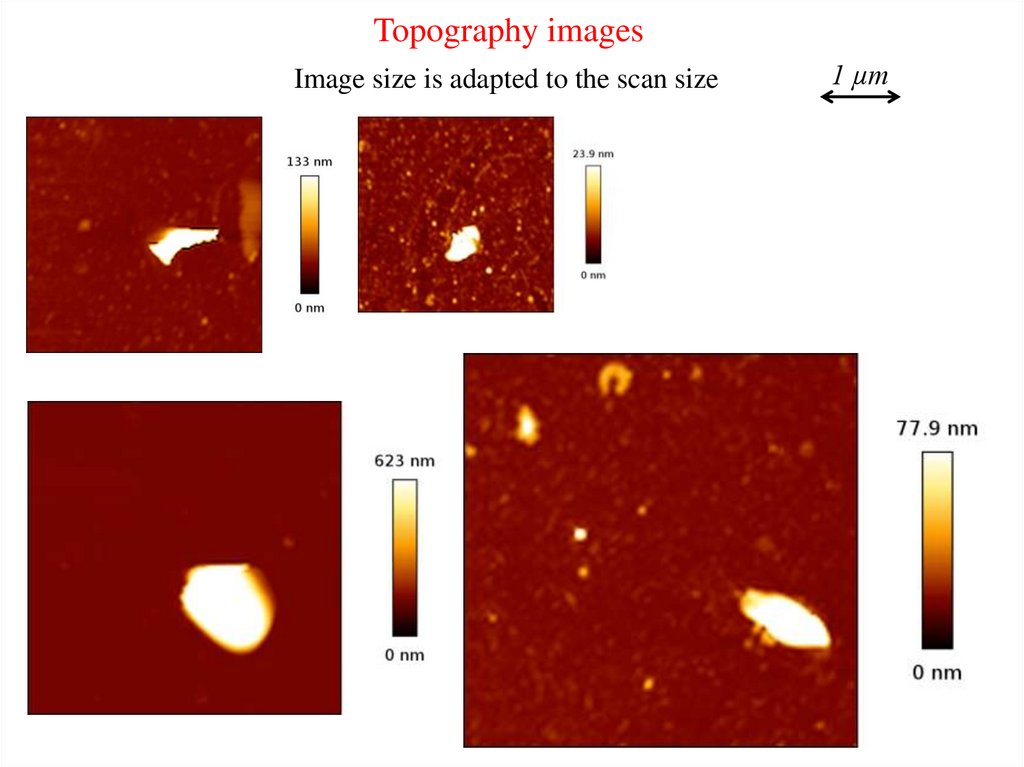
Topography imagesImage size is adapted to the scan size
1 µm
17.
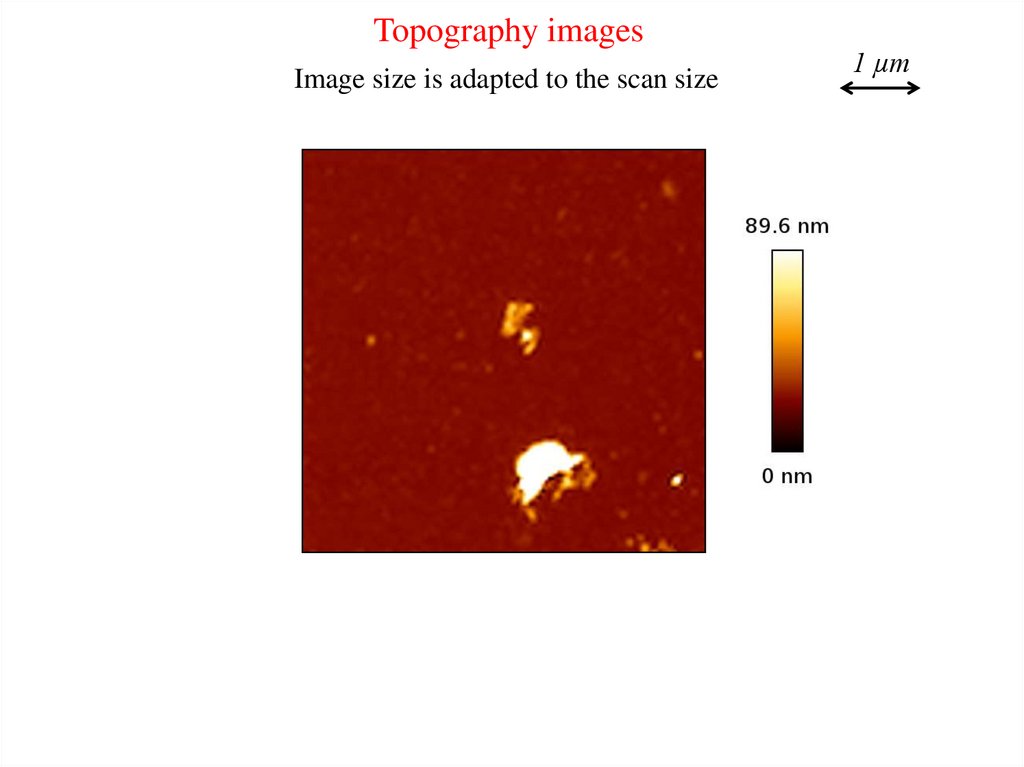
Topography imagesImage size is adapted to the scan size
1 µm
18.
GAS-1 mutants19.
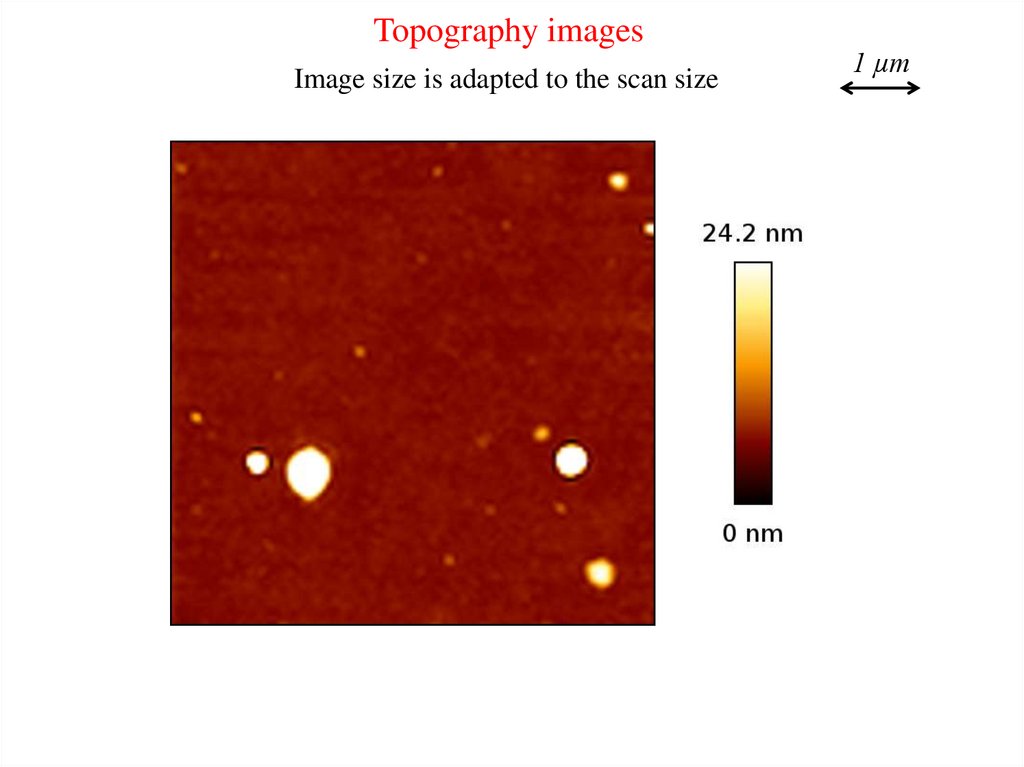
Topography imagesImage size is adapted to the scan size
1 µm
20.
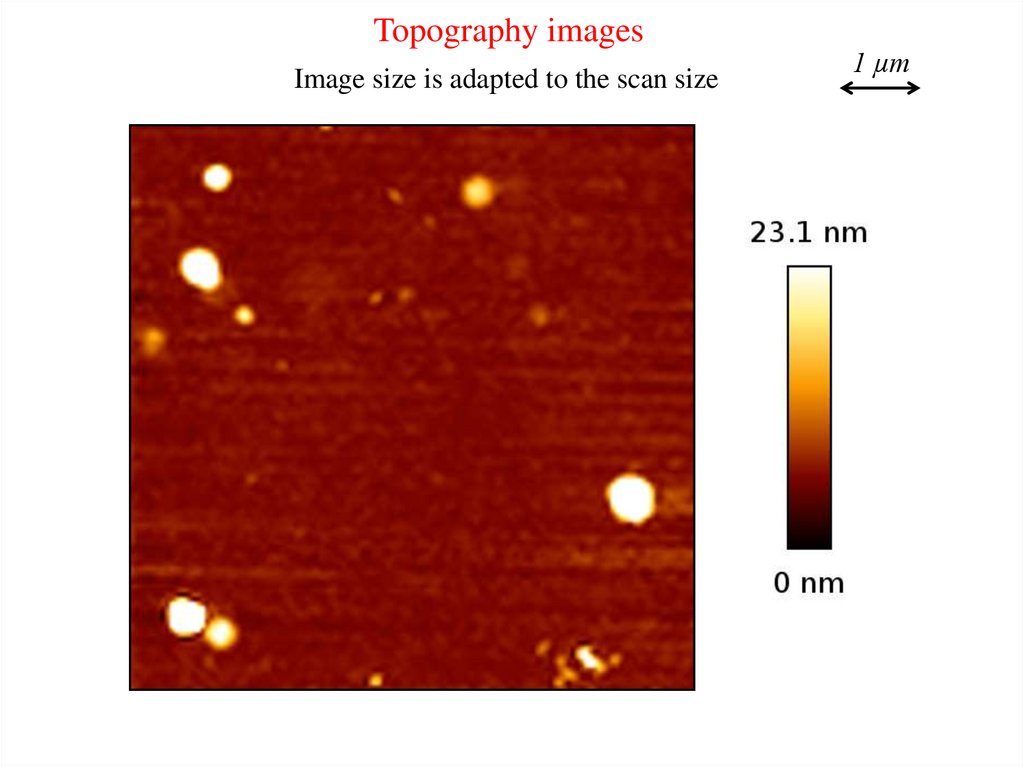
Topography imagesImage size is adapted to the scan size
1 µm
21.
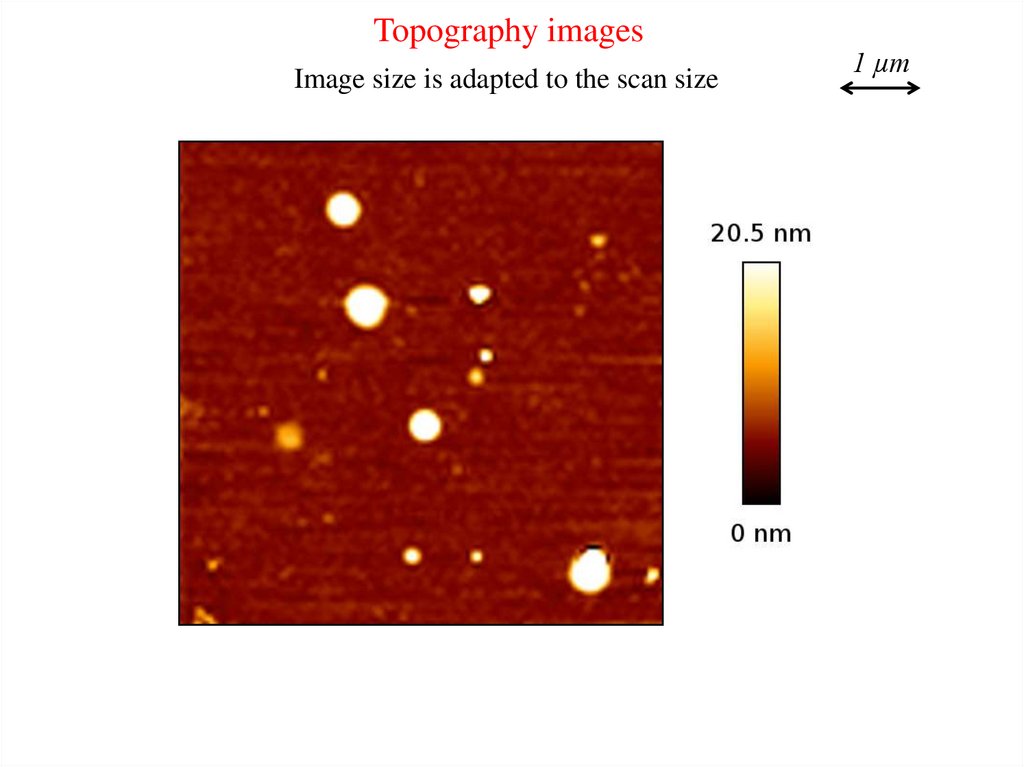
Topography imagesImage size is adapted to the scan size
1 µm
22.
Topography imagesImage size is adapted to the scan size
1 µm
23.
Topography imagesImage size is adapted to the scan size
1 µm
24.
Topography imagesImage size is adapted to the scan size
1 µm
25.
Topography imagesImage size is adapted to the scan size
1 µm
26.
Topography imagesImage size is adapted to the scan size
1 µm
27.
Topography imagesImage size is adapted to the scan size
1 µm
28.
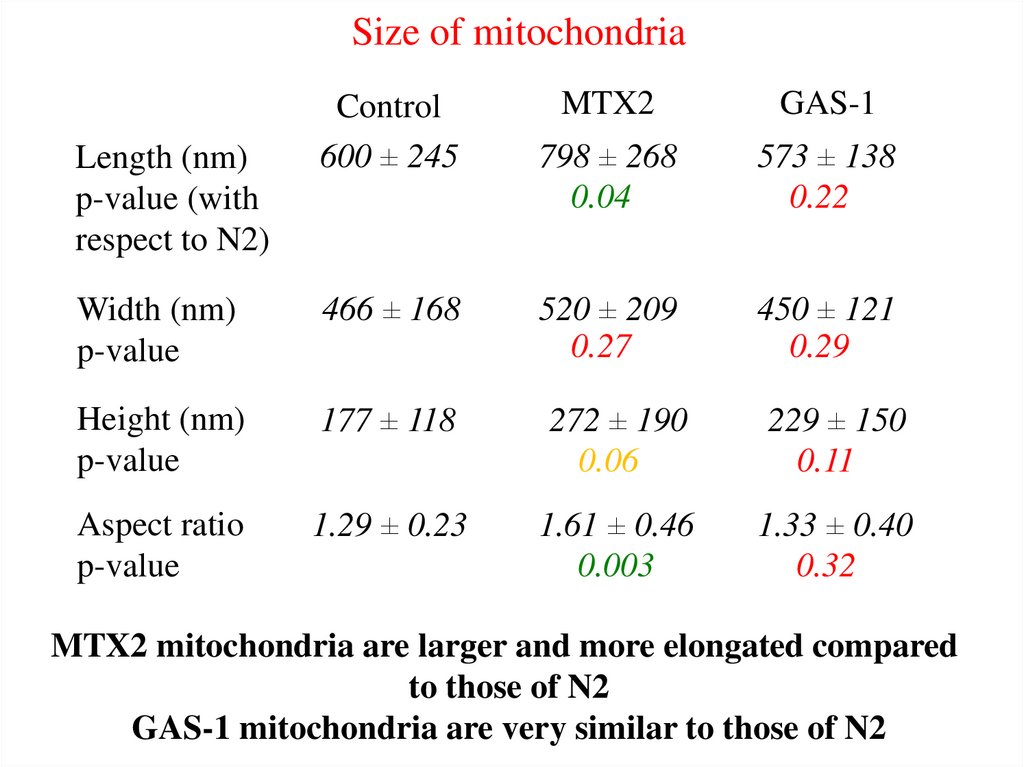
Size of mitochondriaLength (nm)
p-value (with
respect to N2)
Control
600 ± 245
MTX2
GAS-1
798 ± 268
0.04
573 ± 138
0.22
Width (nm)
p-value
466 ± 168
520 ± 209
0.27
450 ± 121
0.29
Height (nm)
p-value
177 ± 118
272 ± 190
0.06
229 ± 150
0.11
Aspect ratio
p-value
1.29 ± 0.23
1.61 ± 0.46
0.003
1.33 ± 0.40
0.32
MTX2 mitochondria are larger and more elongated compared
to those of N2
GAS-1 mitochondria are very similar to those of N2
29.
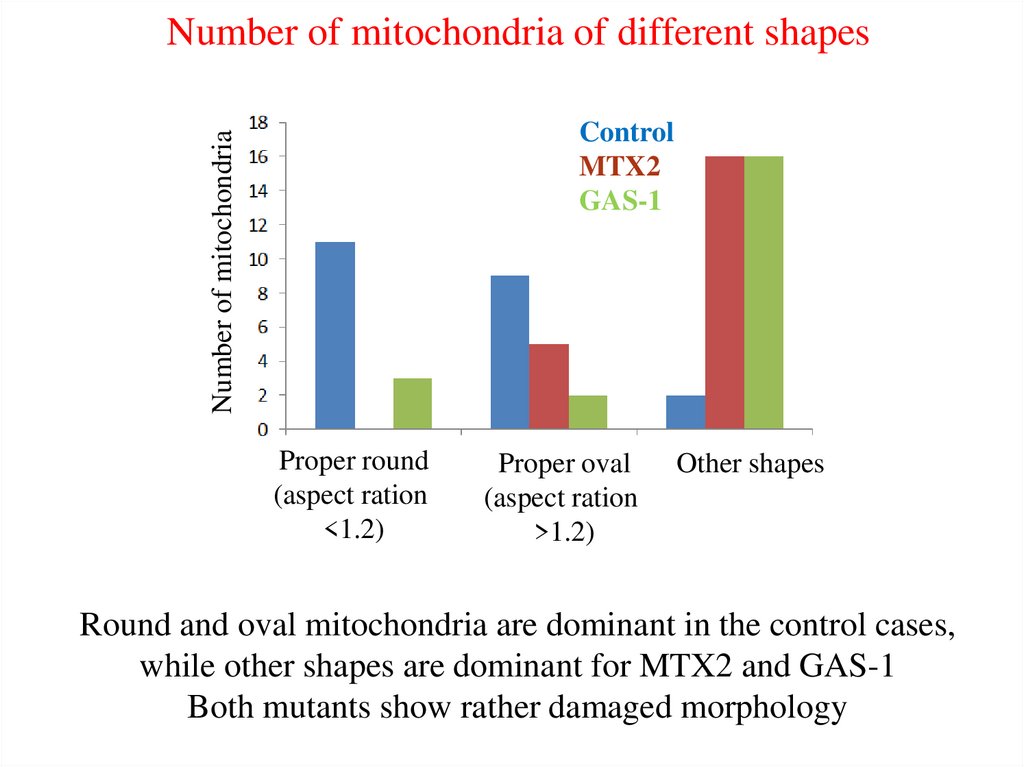
Number of mitochondria of different shapesNumber of mitochondria
Control
MTX2
GAS-1
Proper round
(aspect ration
<1.2)
Proper oval
(aspect ration
>1.2)
Other shapes
Round and oval mitochondria are dominant in the control cases,
while other shapes are dominant for MTX2 and GAS-1
Both mutants show rather damaged morphology
30.
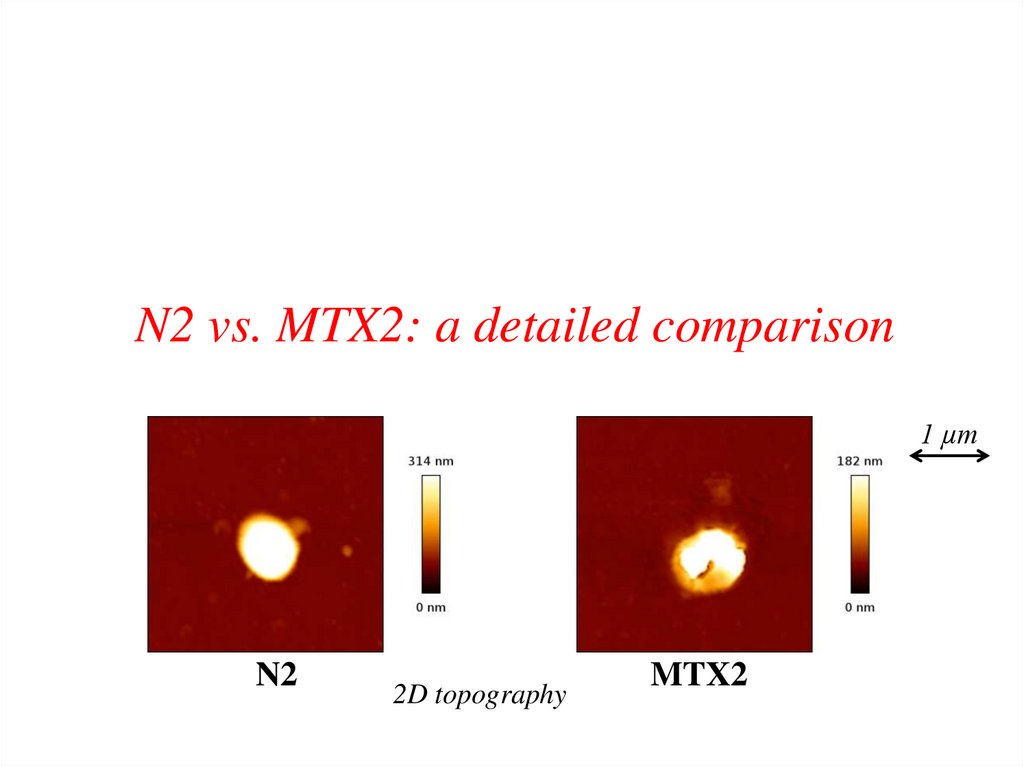
N2 vs. MTX2: a detailed comparison1 µm
N2
2D topography
MTX2
31.
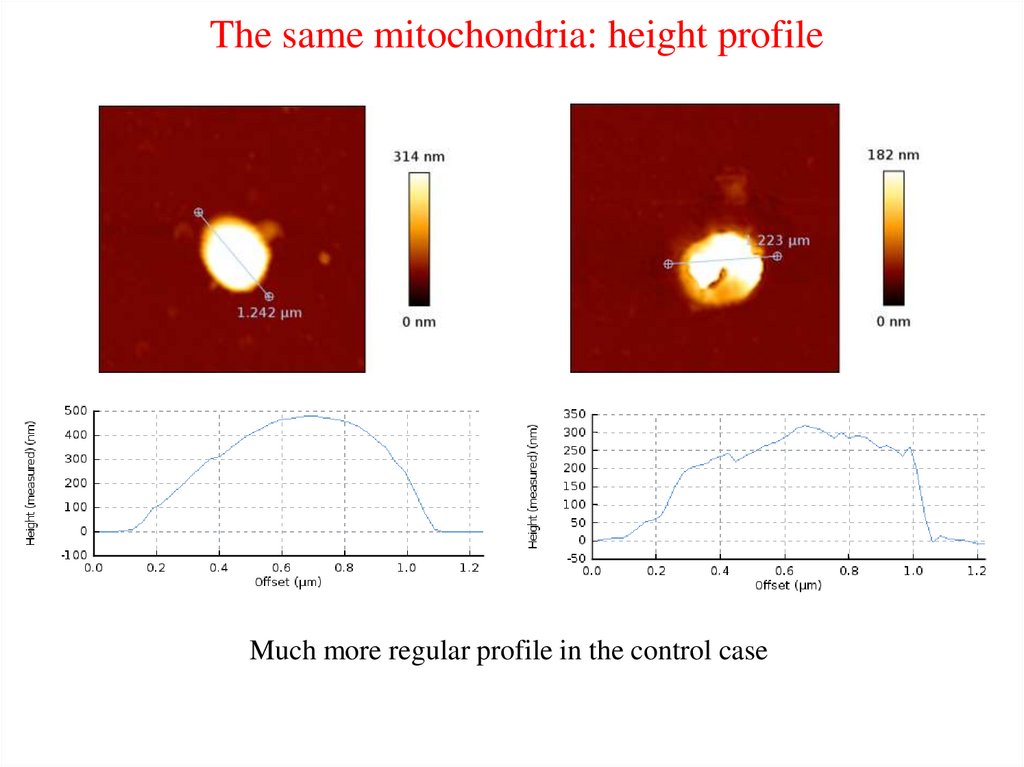
The same mitochondria: height profileMuch more regular profile in the control case
32.
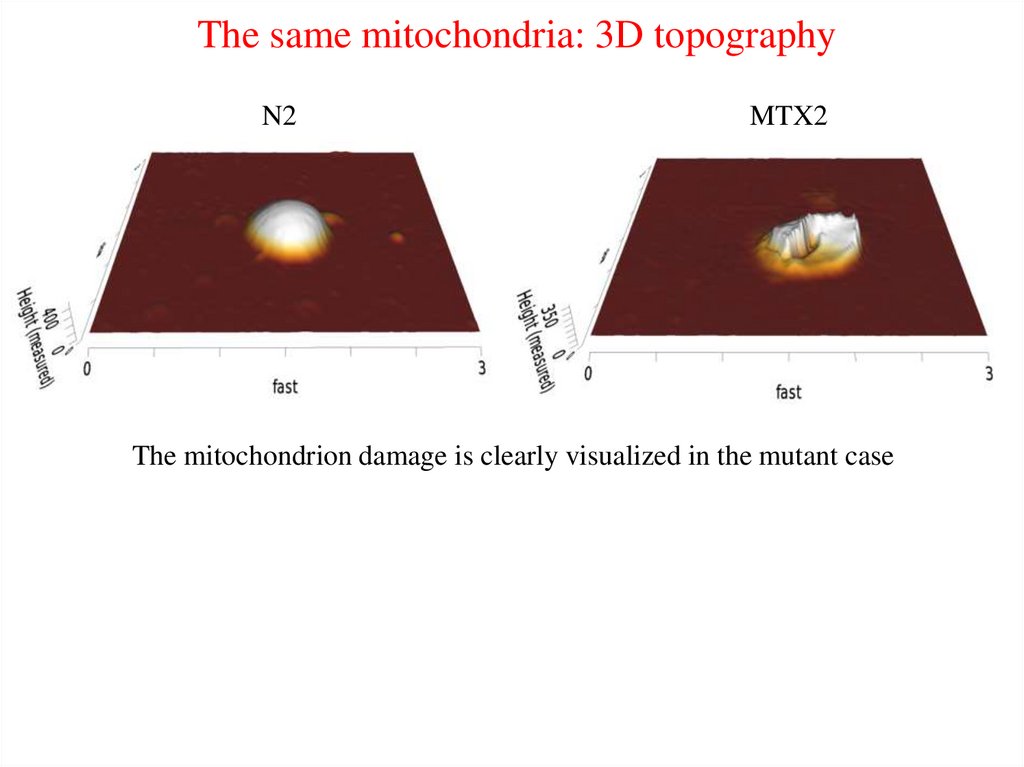
The same mitochondria: 3D topographyN2
MTX2
The mitochondrion damage is clearly visualized in the mutant case
33.
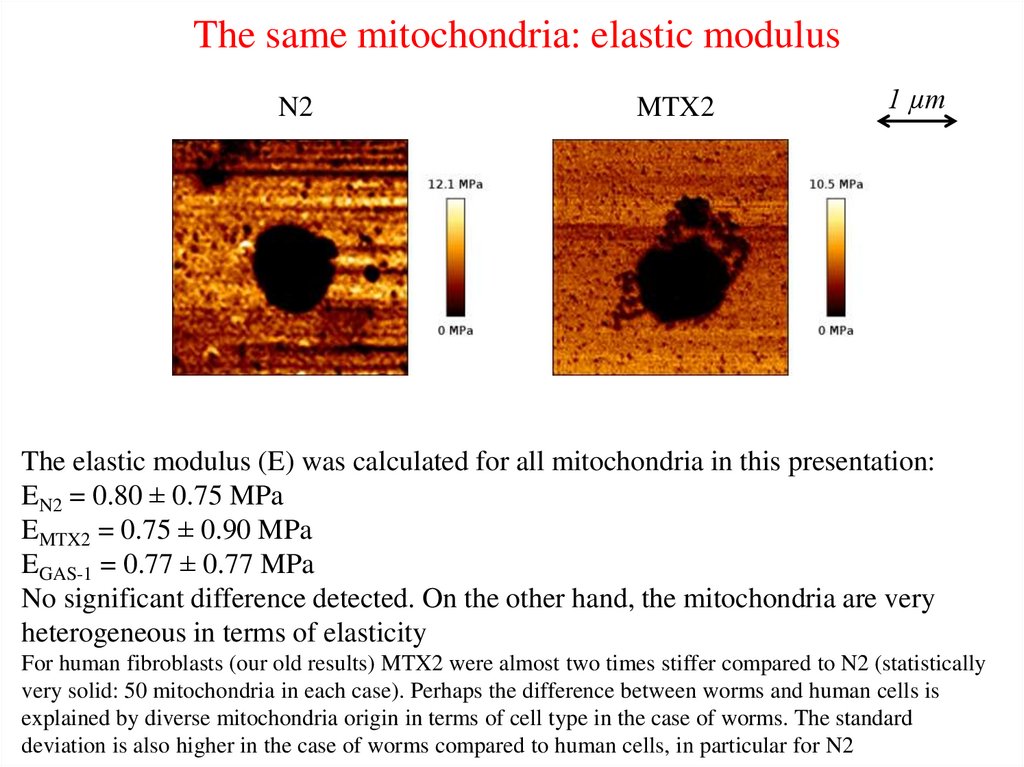
The same mitochondria: elastic modulusN2
MTX2
1 µm
The elastic modulus (E) was calculated for all mitochondria in this presentation:
EN2 = 0.80 ± 0.75 MPa
EMTX2 = 0.75 ± 0.90 MPa
EGAS-1 = 0.77 ± 0.77 MPa
No significant difference detected. On the other hand, the mitochondria are very
heterogeneous in terms of elasticity
For human fibroblasts (our old results) MTX2 were almost two times stiffer compared to N2 (statistically
very solid: 50 mitochondria in each case). Perhaps the difference between worms and human cells is
explained by diverse mitochondria origin in terms of cell type in the case of worms. The standard
deviation is also higher in the case of worms compared to human cells, in particular for N2
34.
ConclusionsMorphology
The morphology is very different for N2 and MTX2. Round and oval mitochondria of
proper shape are mainly observed in the N2 case, while other shapes are dominant
for MTX2. The mutant mitochondria are larger and more elongated
As for GAS-1 mitochondria, their size is close to that of control ones, however
the shape of GAS-1 mitochondria indicates a damaged morphology, like in
the MTX2 case
Elasticity
No significant difference. N2, MTX2 and GAS-1 are all very heterogeneous
As I indicated in the beginning of this study (and I have checked it again), our studies
represent first measurements of elastic modulus of individual mitochondria by AFM
35.
Treatment by methylene blue (MB)36.
Control N237.
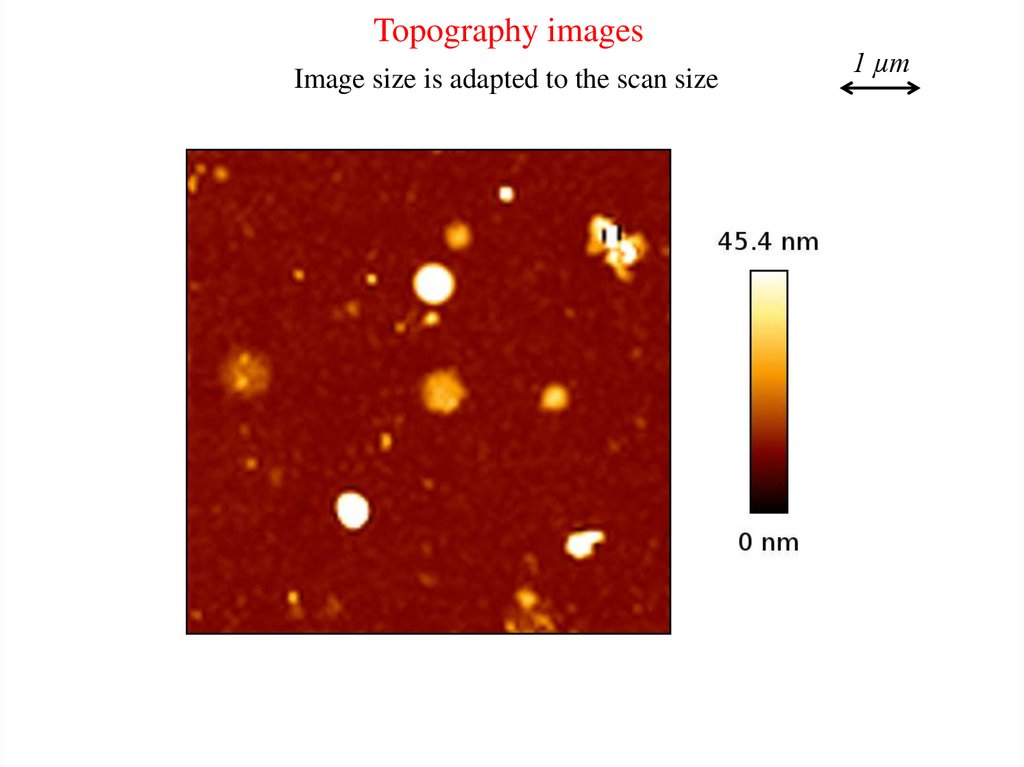
Topography imagesImage size is adapted to the scan size
1 µm
38.
Topography imagesImage size is adapted to the scan size
1 µm
39.
Topography imagesImage size is adapted to the scan size
1 µm
40.
MTX2 mutants41.
Topography imagesImage size is adapted to the scan size
1 µm
42.
Topography imagesImage size is adapted to the scan size
1 µm
43.
Topography imagesImage size is adapted to the scan size
1 µm
44.
Topography imagesImage size is adapted to the scan size
1 µm
45.
Topography imagesImage size is adapted to the scan size
1 µm
46.
Topography imagesImage size is adapted to the scan size
1 µm
47.
Topography imagesImage size is adapted to the scan size
1 µm
48.
GAS-1 mutants49.
Topography imagesImage size is adapted to the scan size
1 µm
50.
Topography imagesImage size is adapted to the scan size
1 µm
51.
Topography imagesImage size is adapted to the scan size
1 µm
52.
Topography imagesImage size is adapted to the scan size
1 µm
53.
Topography imagesImage size is adapted to the scan size
1 µm
54.
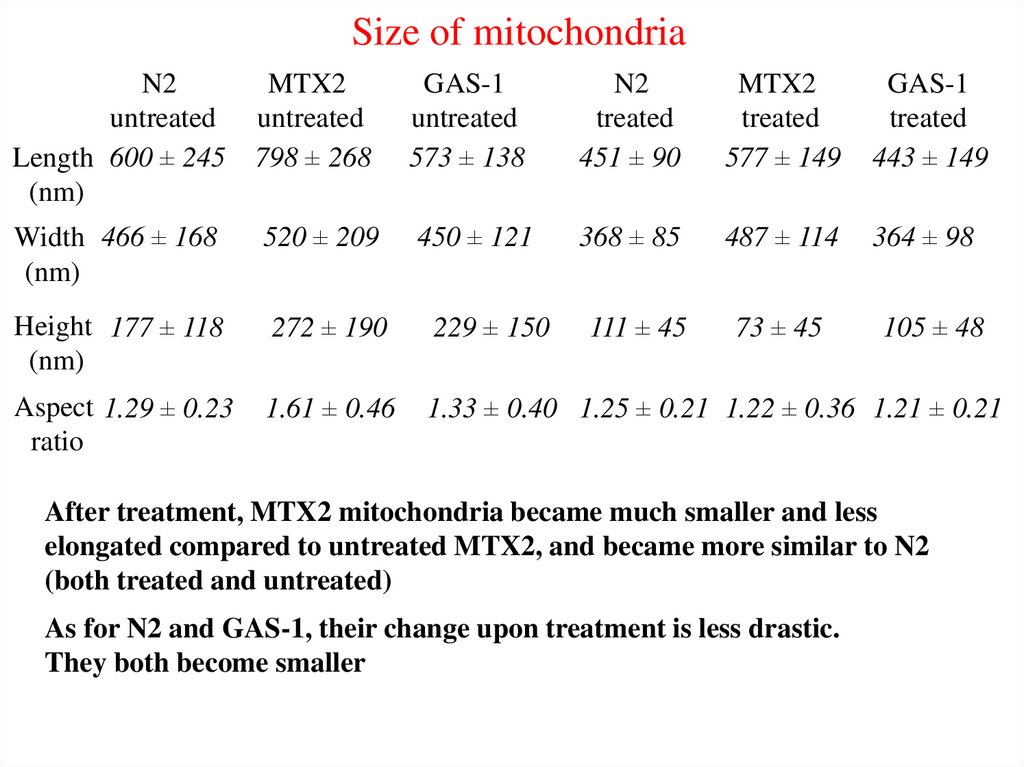
Size of mitochondriaN2
untreated
Length 600 ± 245
(nm)
MTX2
untreated
798 ± 268
GAS-1
untreated
573 ± 138
N2
treated
451 ± 90
MTX2
treated
577 ± 149
GAS-1
treated
443 ± 149
Width 466 ± 168
(nm)
520 ± 209
450 ± 121
368 ± 85
487 ± 114
364 ± 98
Height 177 ± 118
(nm)
272 ± 190
229 ± 150
111 ± 45
73 ± 45
105 ± 48
Aspect 1.29 ± 0.23
ratio
1.61 ± 0.46
1.33 ± 0.40 1.25 ± 0.21 1.22 ± 0.36 1.21 ± 0.21
After treatment, MTX2 mitochondria became much smaller and less
elongated compared to untreated MTX2, and became more similar to N2
(both treated and untreated)
As for N2 and GAS-1, their change upon treatment is less drastic.
They both become smaller
55.
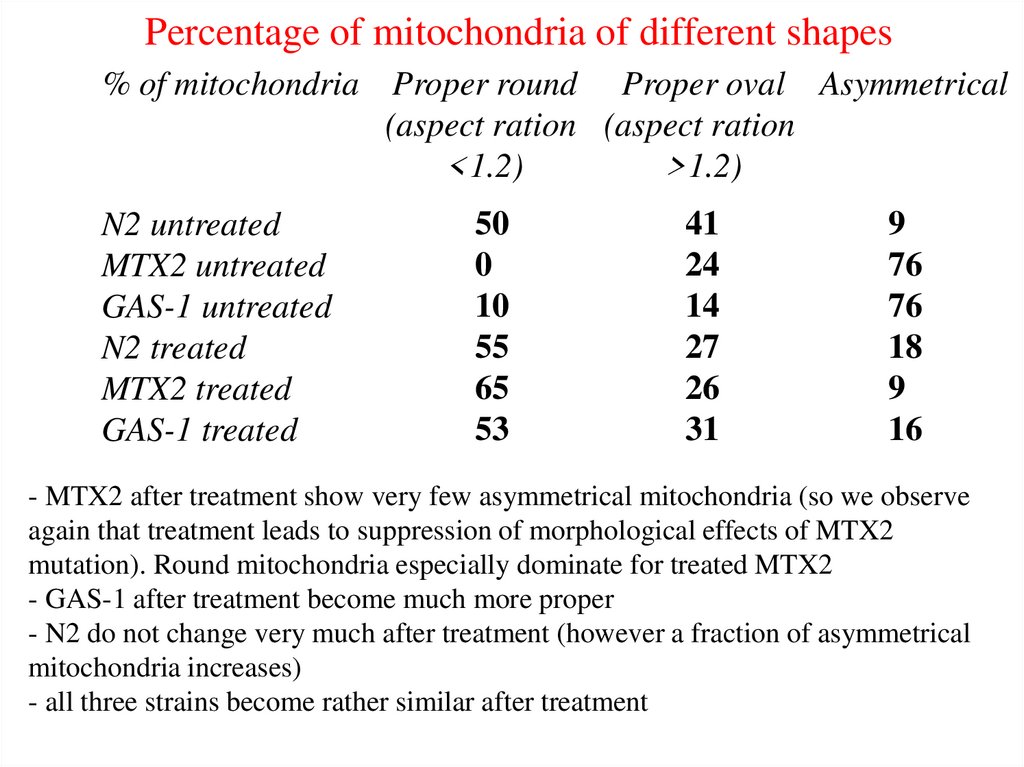
Percentage of mitochondria of different shapes% of mitochondria Proper round Proper oval Asymmetrical
(aspect ration (aspect ration
<1.2)
>1.2)
N2 untreated
MTX2 untreated
GAS-1 untreated
N2 treated
MTX2 treated
GAS-1 treated
50
0
10
55
65
53
41
24
14
27
26
31
9
76
76
18
9
16
- MTX2 after treatment show very few asymmetrical mitochondria (so we observe
again that treatment leads to suppression of morphological effects of MTX2
mutation). Round mitochondria especially dominate for treated MTX2
- GAS-1 after treatment become much more proper
- N2 do not change very much after treatment (however a fraction of asymmetrical
mitochondria increases)
- all three strains become rather similar after treatment
56.
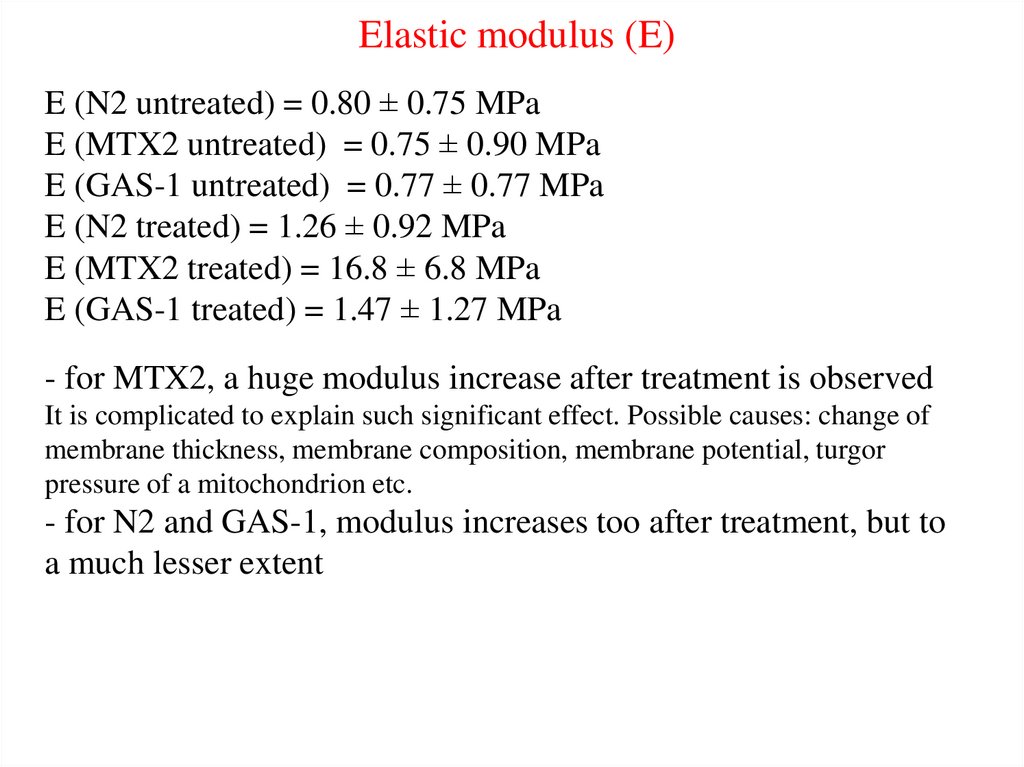
Elastic modulus (E)E (N2 untreated) = 0.80 ± 0.75 MPa
E (MTX2 untreated) = 0.75 ± 0.90 MPa
E (GAS-1 untreated) = 0.77 ± 0.77 MPa
E (N2 treated) = 1.26 ± 0.92 MPa
E (MTX2 treated) = 16.8 ± 6.8 MPa
E (GAS-1 treated) = 1.47 ± 1.27 MPa
- for MTX2, a huge modulus increase after treatment is observed
It is complicated to explain such significant effect. Possible causes: change of
membrane thickness, membrane composition, membrane potential, turgor
pressure of a mitochondrion etc.
- for N2 and GAS-1, modulus increases too after treatment, but to
a much lesser extent
57.
Conclusions for the treatment with methylene blueTreated MTX2 mitochondria become much more similar to
N2 (both treated and untreated) compared to untreated MTX2. In
particular the treatment produces the next effects: mitochondria become
smaller, less elongated, and proper shapes (especially round one) largely
dominate in the population.
A huge increase of elastic modulus after treatment is observed too
For N2 and GAS-1 the effect of treatment is smaller. Mitochondria of
both strains become smaller and stiffer. Also GAS-1 display much more
proper shape after treatment compared to untreated mitochondria
In general we see that MB treatment leads to suppression of the effects
of MTX2 and GAS-1 mutation, which is especially clear in the MTX2
case. The effect of treatment on N2 mitochondria is rather small