Similar presentations:
Introduction to computer graphics
1.
Contacts:+375-29-689-16-58
[email protected]
Ирина-Владимировна
Филитович
Irina Filitovich
2.
Topic 1.1 Introduction tocomputer graphics
Section 1. Computer image processing
in a raster graphics system
3.
1 Basic concepts of vector and raster graphics, theircomparison: disadvantages and advantages, working
methods
2 Image resolution
3 Graphic file formats
4 Color models and modes
4.
1 Basic concepts of vector and raster graphics, theircomparison: disadvantages and advantages, working
methods
5.
1 Basic conceptsComputer graphics is a part of computer science that deals
with both the creation of new and the processing of existing
images using a computer.
6.
Areas of use:● printing,
● three-dimensional modeling and animation,
● in cinema and show business for the production of video
products, in video advertising,
● web design
● professional photography,
● interior design, building facades, landscape design, advertising
installations,
● engineering field,
● scientific field.
7.
1. Name the main areas ofapplication of computer
graphics.
Check yourself:
2. Give examples of the use
of computer graphics in
your specialty.
3. Give examples of the use
of computer graphics in
recent films you have seen.
8.
Types of digital graphicsraster,
vector,
fractal,
three-dimensional graphics.
9.
10.
Vector coding methodThe vector method of encoding pictures is based on encoding
individual objects.
Objects are considered to be simple geometric shapes: square,
ellipse, triangle, etc., as well as straight and curved lines. Each
such element of the picture can be written using mathematical
formulas.
11.
Vector coding methodA complex drawing consists of several simple ones.
Each object can be edited individually or multiple shapes and
lines can be combined into groups.
A photograph cannot be digitized using a vector method,
because there are too many details in any photo, the file will be
large and the realism of the image will be lost.
12.
Vector coding methodMost of the printing layouts and logos are made using the
vector method.
Many vector programs allow you to insert a raster image into a
vector layout.
13.
Vector programs:● CorelDRAW,
● Adobe Illustrator,
● Macromedia Free Hand and others.
14.
3D graphicsThree-dimensional graphics – computer graphics, with the
help of which three-dimensional images or videos are created
by modeling objects in three dimensions.
It is used for modeling interior design, creating threedimensional objects for animation, in designing machine parts
and mechanisms, in computer games, etc.
15.
Fractal graphicsFractal graphics are a rather complex and rarely used method
of electronic painting, based on mathematical models - fractals.
If you have come across video illusions on the Internet, they are
also created using fractal graphics.
16.
Raster graphicsThe Adobe Photoshop graphics editor works primarily with
raster graphics, although it can also handle vector contours.
A raster image consists of pixels - multi-colored squares of the
same size.
17.
Raster graphicsEach pixel has its own color, which can be written in numerical
form.
The primary colors (red, blue, yellow, etc.) in the image are
divided into shades: from light to dark.
Each shade is assigned a numerical value.
18.
Raster graphicsHaving numbered all the cells of the mosaic, the computer
receives a set of pairs of numbers - the first is the pixel number,
the second is the average color shade.
Pictures encoded in this way are called rasters or bitmaps.
Any picture or photo can be unambiguously described in this
way; it is called a method of describing it with an array of
numbers.
19.
Raster graphicsBitmap images require a large amount of memory to store.
Raster images are difficult to scale and even more difficult to
edit.
To enlarge the image, you have to increase the size of the
squares, and then the picture turns out to be stepped.
20.
Raster graphicsTo reduce an image, you have to transform several neighboring
points into one or discard extra points.
As a result, the image is distorted, its small details become
blurred.
21.
Photoshop MinuteTask 1
Raster Graphics
22.
Fragment of the digitized image and color numbersLet's number the colors
using some method.
Each pixel in the picture
began to have a certain
color, indicated by a
number.
23.
Fragment of the digitized image and color numbersLet's go in order and
write down the color
numbers of the
encountered pixels on a
line.
Example line:
1 2 8 3 212 45 67 45 127
4 78 225 34 ...
24.
Raster graphicsThis line is our digitized data.
Now we can compress them and save them to a file.
Raster is a method of representing an image as a collection of
individual dots of different colors or shades.
25.
Each pixel is associated with a value:brightness,
colors,
transparency,
or a combination of these values.
26.
Raster graphicsWithout much loss, raster images can only be reduced, although
with the loss of some image details.
Enlarging raster images results in a beautiful view of enlarged
squares of one color or another that were previously pixels.
27.
Raster graphics programs28.
Advantages and disadvantages● the ability to obtain high-quality photorealistic images in a
different color range,
● high accuracy and wide color range require an increase in
file size for image storage and RAM for processing it,
● loss of image quality when scaling it.
29.
Raster graphicsAdvantag
es
Disadvantag
es
Ways to neutralize shortcomings
File size for storing
created images
Large file
size
• Adequate selection of image
sizes and resolutions
• Selection of formats for saving
Working
with
objects:
Difficulty
isolating
visual
objects
1. Initially place visual objects in
different planes
2. Study the maximum number of
allocation means.
Selecti Easily
on
select part
of a visual
object
30.
Raster graphicsAdvantag
es
Working
with
objects:
Positio
ning
Disadvantages
Ways to neutralize
shortcomings
It is
difficult/impossible
to move a visual
object, incl. to the
exact location on
the canvas.
1. Initially place visual
objects in different planes
2. Use auxiliary elements.
31.
Raster graphicsAdvant
ages
Working
with
objects:
Resizing
(reducing,
increasing)
Disadvantages
Ways to neutralize
shortcomings
Without much loss,
raster objects can only
be made smaller,
although with the loss
of some image details.
Enlargement results in
pixelation
• Resize not the
object, but the
entire image.
• Follow the rules of
collages and
montages.
• Use SmartObject
32.
Raster graphicsAdvantages
Working View scale It is easy to
with
imagine what
objects:
the object will
look like in
real form (at
100% viewing
scale).
Disadvanta
ges
Ways to neutralize
shortcomings
Use the
correct
viewing
scale for
the
appropriate
tasks
• =100% - actual size, judge
the quality of the image.
• >100% - when adjusting
images.
• If the image has a pixel size
greater than the monitor
resolution, then <100% - we
judge the compositional
solution.
33.
Raster graphicsStylistics of
the created
images
Advantages
Disadvantage Ways to neutralize
s
shortcomings
• Drawn elements in the style
of imitation of artistic
techniques (pencil,
watercolor, etc.)
• Photorealistic works.
• Layouts for WEB
Limitation for Use a vector editor
business
and import into a
graphics,
raster editor.
logos,
emblems, etc.
34.
Raster graphicsAdvantages
Scope of application
in practice
• Printing.
• Photo.
• Web.
• Advertising.
• Architecture.
•…
Disadvantages
Ways to neutralize
shortcomings
35.
Photoshop MinuteTask 2
Image Search Sites
36.
Where can I get images?Google search engine:
https://www.google.com/search?q=%D0%BA%D0%B0%D1%80%
D1%82%D0%B8%D0%BD%D0%BA%D0%B8&sca_esv=59015929
0&tbm=isch&sxsrf=AM9HkKlMLLsdn2hkV55vANml3PXmts0b9A:
1702389826883&source=lnms&sa=X&ved=2ahUKEwje5pmniIq
DAxUeQvEDHXYTDncQ_AUoAXoECAIQAw&biw=619&bih=758&d
pr=2
37.
Professional stock platforms● https://unsplash.com/ Stock photos from Unsplash
● https://www.pexels.com/ru-ru/ Stock photos from Pixels
● https://pixabay.com/photos/ Stock photo illustrations and
vector graphics from Pixabay
● https://www.freepik.com/photos Stock photos and vector
graphics from Freepik
● https://www.flaticon.com/ru/ PNG Icons
● https://www.pinterest.ru/ Search for inspiration
38.
Vector graphicsVector graphics represent an image as a set of primitives:
points,
straight lines,
circles,
rectangles,
splines of some order.
39.
Vector graphicsObjects are assigned some attributes:
● line thickness,
● fill color, etc.
The drawing is stored as a set of coordinates, vectors and other
numbers that characterize a set of primitives.
An image in vector format gives you plenty of room for editing.
40.
Vector graphicsNot every image can be represented as a set of primitives.
This method of presentation is good for diagrams, used for
scalable fonts, business graphics, and is widely used for
creating cartoons and simply videos of various contents.
41.
Vector graphics programs42.
Fractal graphicsA fractal is an object whose individual elements inherit the
properties of parent structures.
Since a more detailed description of smaller-scale elements
occurs using a simple algorithm, such an object can be
described with just a few mathematical equations.
43.
Fractal graphicsFractals make it possible to describe entire classes of images,
the detailed description of which requires relatively little
memory.
On the other hand, fractals are poorly applicable to images
outside of these classes.
44.
Fractal graphics programs45.
Three-dimensional graphics (3D)Three-dimensional graphics operate with objects in threedimensional space.
Usually the results are a flat picture, a projection.
46.
Three-dimensional graphics (3D)Three-dimensional computer graphics are widely used in
cinema and computer games.
In 3D computer graphics, all objects are usually represented as
a collection of surfaces or particles.
47.
Three-dimensional graphics (3D)The minimal surface is called a polygon.
Triangles are usually chosen as polygons.
All visual transformations in 3D graphics are controlled by
matrices.
48.
Vector graphicsAdvantag
es
File size for storing
created images
Working with
objects:
Disadvanta
ges
Ways to neutralize
shortcomings
It is difficult
to select
part of a
vector
object
1. Initially build a visual object
from several vector objects
2. Be able to split a vector
object into different vector
objects
Small file
size
Selecti Easily
on
select a
vector
object
49.
Vector graphicsAdvantages
Workin Positioning
g with
objects
:
It's easy to move a vector
object to any point,
including. with given
coordinates
Disadvantage
s
Ways to
neutralize
shortcomings
50.
Vector graphicsWorkin Resizing
g with
(reducing,
objects: increasing)
Advantage
s
Disadvantages
Ways to neutralize
shortcomings
The quality
doesn't
change
Monitor the ratio
of outline
thickness to
object size
Find out the
program’s capabilities
for “adjusting” the
thickness of the
outline to the size of
the object
51.
Vector graphicsWork View
ing
scale
with
objec
ts:
Advantages
Disadvantages
Ways to
neutralize
shortcomings
Quality can be
judged at
different
viewing scales
1. Monitor the ratio of the
contour thickness to the
size of the object when the
viewing scale is greatly
reduced.
1. Monitor the
viewing scale.
2. It is difficult to imagine
what the object will look like
in real life.
2. Use preview.
52.
Vector graphicsStylistics
of the
created
images
Advantages
Disadvantages
Ways to neutralize
shortcomings
• Drawn elements in
cartoon style.
• Business
graphics.
• Logos.
• Symbols,
emblems, etc.
1. Imitation of
artistic techniques
(watercolor, pencil
drawing, etc.).
2. Photorealism.
3. Restriction for
WEB
1. Use a raster editor.
2. Learn the tools of a
vector editor for creating
photorealism (techniques
for simulating volume).
3. Use a raster editor..
53.
Vector graphicsScope of
application in
practice
Advantages
Disadvantages
Ways to neutralize
shortcomings
• Printing.
• Advertising.
• Business graphics
for presentations,
reports, etc.
Restriction for
WEB
Use a raster
editor.
54.
Methods for creating and processing images1. Freehand drawing (with mouse or digitizer), digital
photography, scanning
2. Pixel art is a method where the artist draws an image pixel
by pixel for small images, icons, website pictograms, logos.
3. Rendering (visualization) is the process of automatically
creating an image based on a model specified by the user.
55.
Methods for creating and processing images4. Resizing
5. Cropping – adjusting the image size to the print format.
6. Resampling - recalculation of pixel colors when their number
changes.
When decreasing, you need to combine pixels, and when
increasing, you need to make several pixels out of one.
56.
Methods for creating and processing images7. Filtering – application of some image processing algorithm.
8. Retouching – editing the details of an image (as a rule, this is
manual processing of a photograph associated with deleting,
changing the shape of objects, and painting).
9. Photomontage - combining two or more images into one.
57.
Methods for creating and processing images10. Rasterization is the process of converting vector graphics
into raster graphics.
Such a translation can be done in almost any graphic editor, but
after this you will only be able to manage the image as a single
picture, and not its parts.
58.
Methods for creating and processing images11. Vectorization is the process of converting raster graphics
into vector graphics.
The vectorization problem is a special case of pattern
recognition; there is no universal translation algorithm.
59.
Methods for creating and processing imagesSince the result is rarely perfect, human intervention is required
to correct errors.
Only specialized algorithms have been created in a certain area
(in geographic information systems, using vectorization of aerial
photography, maps of the area are obtained).
60.
Disadvantages of scanned images● too dark,
● too light,
● with indistinguishable details.
61.
Methods for creating and processing imagesThe difference between a bad photograph and a good one is,
first of all, the correct balance of light and shadow.
Professional raster graphics editors contain tools for manual
and automatic image quality improvement
62.
Image quality enhancements:1. Brightness - the amount of white in the image.
The higher the brightness, the brighter the frame becomes.
2. Contrast - the difference between different colors located
next to each other.
The higher the contrast, the sharper the transition from one
color to another.
3. Sharpness (clarity) – the degree of contrast on the contours.
63.
Image quality enhancements:4. Saturation - how rich and bright a particular color looks.
5. Automatic tone correction - corrects errors in lighting and
contrast.
6. Automatic color
7. Automatic contrast and other additional settings (curves,
levels)
64.
2 Image resolution65.
Basic concepts of computer graphics:graphic resolution,
color depth,
color models and modes,
graphic file formats.
66.
Graphic ResolutionThe most important characteristic of a raster image, which
determines the quality of the output to a display device monitor or printer, is graphic resolution.
Graphic resolution determines the number of pixels in one inch,
measured in pixels per inch (ppi).
67.
Graphic ResolutionResolution is the density of pixels in an image.
If a photograph is digitized at 100 ppi, then each inch of the
image contains 100 pixels.
68.
Graphic ResolutionThe higher the graphic resolution, the greater the number of
pixels contained in the image and the better the fine details and
color transitions are conveyed, i.e. higher quality is ensured.
A photograph measuring l x l inch (2.54 x 2.54 cm) with a
resolution of 100 ppi contains 100 horizontal pixels x 100
vertical pixels = 10,000 pixels.
The same photo with a resolution of 200 ppi will contain
200x200 = 40,000 smaller pixels.
69.
Graphic ResolutionSince the linear dimensions of the same image with different
resolutions do not change, the pixel sizes decrease with
increasing resolution.
The more pixels an image contains, the larger its file size.
A photo with a resolution of 200 ppi should be of higher quality
than the same photo with a resolution of 100 ppi.
70.
Graphic ResolutionGraphic resolution is an attribute inherent to any raster
image.
Creating an image in any raster editor begins with setting the
resolution.
In digital photography, graphic resolution is determined by the
resolution of the camera.
When digitizing using a scanner, the resolution is set depending
on the required quality and in accordance with the capabilities
of the device.
71.
Graphic ResolutionWhen editing in Adobe Photoshop, using a higher resolution
than the image was scanned or created at usually does not
improve its quality, since in this case Photoshop does not create
new graphic information, but only redistributes the old data
among more pixels.
72.
The optimal value of the graphic resolution of a rasterimage
The optimal graphic resolution of a raster image is determined
by how it will be used.
For viewing on a computer screen and on a Web page, a low
resolution corresponding to the resolution of a computer
monitor (usually 72 ppi) is sufficient.
If a photo with such a low resolution is printed on a printer, its
quality will be poor due to the large pixel size.
73.
Linear dimensions of the imageLinear dimensions are often determined by the number of
pixels located along horizontal and vertical boundaries.
If there are 300 pixels along the horizontal border of a
photograph, and 200 along the vertical border, then such an
image has dimensions of 300x200 pixels.
74.
Linear dimensions of the imageOften the pixel dimensions of an image are also called
resolution, for example: “a photograph with a resolution of
300x200 pixels.”
We will use the term “resolution”, meaning the number of
pixels per inch.
75.
Linear dimensions of the imageKnowing the size of the image in pixels, it is easy to determine
the total number of pixels by multiplying the horizontal and
vertical dimensions.
A 300x200 image contains 60,000 pixels.
76.
Linear dimensions of the imageIn order to determine its linear dimensions in inches or
centimeters, knowing the dimensions of an image in pixels, you
need to divide the pixel dimensions by the graphic resolution.
77.
Linear dimensions of the imageA photo of 300*200 pixels with a graphic resolution of 100 ppi
will have a size of 300:100 = 3 inches horizontally and 200:100 =
2 inches vertically.
Considering that 1 inch = 2.54 cm, the photo dimensions in
centimeters will be 7.62 x 5.08 cm.
78.
Bitmap File SizeThe size of a raster image file is proportional to the image size,
graphic resolution, and color depth.
The larger the image size, its graphic and color resolution, the
larger its file size.
The image size can be determined by the formula:
F = (A/25,4xB/25,4)xD2xC/8
79.
Bitmap File SizeF = (A/25,4xB/25,4)xD2xC/8,
F - file size without compression in bytes;
A - the width of the original image in mm;
B - the length of the original image in mm;
D - graphic resolution of the image in ppi;
C - color depth in bits.
80.
Bitmap File SizeIf you scan a photograph measuring 10x15 cm with a resolution
of 150 ppi and a color depth of 24 bits, then the digitized image
will occupy = 1,570,000 bytes or = 1.5 megabytes in RAM (1
megabyte = 1024x1024 = 1048,576 bytes).
81.
Bitmap File SizeThe file size of such an image will depend on the format in
which the photo will be saved.
Many file formats allow you to use compression to reduce file
size.
82.
Monitor resolutionThe number of pixels in one inch of screen that a monitor can
display determines the resolution of the monitor.
It depends on the screen size and the current video card
resolution, which can vary from 640x480 to 1800x1440 pixels.
83.
Monitor resolutionThe monitor is configured so that its resolution is 72 pixels per
inch (ppi).
At a low resolution of the video card - 640 x 480 - the screen
pixels will be large, and at a high resolution -1800x 1440 - they
will be very small.
84.
Monitor resolutionWhen a raster image is displayed on a monitor screen, all the
pixels in the image are represented by a specific number of
screen pixels.
Monitor resolution determines the size of the screen image and
should not be confused with graphic resolution, which
measures the density of pixels in the image.
85.
Monitor resolutionA 144 ppi photo on a 72 ppi monitor will be twice its actual size
because only 72 of the 144 pixels can be displayed in each inch
of the screen.
When displayed on a monitor with a resolution of 120 ppi, the
same image will be only slightly larger than the original, since in
this case 120 of the 144 pixels can fit in each inch of the screen.
86.
Monitor resolutionIf you plan to prepare an image for viewing on a computer
screen, then the maximum size of such an image should be
selected based on the minimum possible screen size (in pixels).
If you know in advance that the image will be displayed on the
screen of a 15-inch monitor with a video card resolution of
800x600, then you should limit yourself to 800 x 600 pixels.
87.
Monitor resolutionAt a larger size, to view this image you will have to use scroll
bars or programmatically scale the image before displaying it
on the screen.
Pay special attention to this fact when preparing tasks for
infographics and presentations.
88.
Monitor resolutionIn such cases, the resolution of the monitor, projector, PC video
card and the created presentation material must be consistent.
89.
Printer resolutionThe quality of a printed digital image depends not only on its
graphic resolution and color depth, but also on the resolution
of the printing device - a printer or digital image setter.
90.
Printer resolutionThe resolution of a printing device is measured in dots per inch
(dpi - dots per inch).
This is the number of dots that the device can print on one inch
of page.
The higher this number, the more fine detail can be captured
and therefore the higher the print quality.
91.
Printer resolutionModern laser and inkjet printers are characterized by a
resolution from 300-600 dpi to 2800 dpi and provide good
quality printing of images with a graphic resolution of 100-150
ppi.
Phototypesetting machines (image setters) have a resolution
from 1200 dpi to 5000 dpi and higher, providing high-quality
printing of images with a graphic resolution of 200-300 ppi.
92.
How to tell if you have enough resolution to printThere is a calculator in Photoshop. Command Image > Image
Size.
In the window
that appears,
find the
Resample key
and remove it.
93.
How to tell if you have enough resolution to printWe do not allow Photoshop to resize images in pixels.
In the drop-down
list of units of
measurement, the
Pixels line is not
active.
Print sizes and
resolution are
strictly related.
94.
How to tell if you have enough resolution to printEnter the required horizontal or vertical size and look in the
Resolution field.
It will automatically
display the native
(without
interpolation)
resolution of the
image when printed
at the specified size.
95.
How to tell if you have enough resolution to printThen you just need to compare the resulting value with the
technical requirements of the printing house or print shop.
What if there are no printing house requirements? 300 ppi.
96.
Resolution● Image resolution
● Device resolution (printer, scanner, monitor)
97.
Image ResolutionImage resolution is the number of raster grid points displayed
on a one-inch segment.
Measured in dpi (dots per inch).
Describes how detailed a given image is.
98.
Image ResolutionHigher resolution means higher levels of detail.
Choosing the right resolution for an image depends on what
you are preparing the image for.
99.
Image Resolution● For the Internet, it is enough to set the image resolution to
72 pixels/inch or 96 pixels/inch,
● For printing - 150 pixels/inch, 300 pixels/inch and more.
100.
Device (monitor) resolutionDevice resolution describes the resolution of the image
produced by an output device or input device.
Monitor screen resolution usually refers to the image size in
pixels:
● 800×600,
● 1024×768,
● 1280×1024.
101.
Device (Printer) ResolutionResolution can be expressed as two integers, for example:
1600x1200 — in this case, these numbers indicate the
horizontal and vertical dimensions of the image in pixels.
102.
Device (scanner) resolutionThe resolution of a printer or scanner is usually indicated in DPI:
300 DPI, 600 DPI, 1200 DPI.
103.
Image processingAfter an image is created, it is usually processed.
Processing means changing dimensions and resolution,
cropping, rotating, etc.
104.
Changing Canvas SizesWhen editing parts of an image or changing a compositional
solution, an additional field is often required.
Adding additional areas occurs by increasing the size of the
canvas on which the image is located.
When you open or create a document, the geometric
dimensions of the canvas and the image are the same.
105.
Changing Canvas SizesTo change the canvas size, use the Image/Canvas Size
command.
The canvas is enlarged only by adding empty fields to it, and
reduced by trimming the edges.
The pixel sizes and their contents remain unchanged, so the
structure of the image does not change in any way.
106.
Change the canvas size. Practice1. Before starting work, update the workspace using the
command Window/Workspace/Reset Basic-1.
2. Next, open the image.
3. To determine the canvas size, run the Image/Canvas Size
command.
107.
Canvas Size Dialog Box4. Increase the canvas size.
To do this, in the dialog box,
set new canvas dimensions in
the fields Width = 23 cm and
Height = 18 cm.
108.
Change the canvas size. Practice5 When enlarging the canvas, you must indicate the position of
the old image on the new canvas.
To do this, click in the desired square of the Anchor diagram.
If you click on the central square, fields will be added on all
sides of the image.
And if you click on the top left square, the fields will be added
only to the bottom and right.
109.
Change the canvas size. Practice6 The Relative checkbox allows you to specify incremental
(rather than absolute) width and height values.
7 In the lower field, Canvas extension color, sets the color of
the new part of the canvas being added; the background color
is set by default.
Parameters are set similarly when reducing the canvas size.
110.
Changing image size and resolutionWhen resizing the canvas, the image size changes only by
cropping or adding margins.
Changing the image size occurs with changing the image
structure using the Image/Image Size command.
This dialog box is used to change the resolution and size of the
image.
111.
Image Size Dialog BoxOn the right side of the dialog box, in the Dimensions rollout,
you see the current dimensions of the image in pixels.
112.
Image Size Dialog BoxThen in the Fit to
rollout, you can select
the size of a specific
practical application
template, then its
geometric dimensions
and resolution are
presented.
113.
Image Size Dialog BoxThe unit of measurement can be selected in the adjacent scrolls
on the right.
The left side of the
dialog box displays
a viewing window
for the current
image view.
114.
Changing image size and resolutionIn the upper right corner, below the menu icon, there is a Scale
Styles checkbox, which allows you to scale the styles applied to
the image when you scale the image.
The chain icon provides proportional changes to the width and
height.
When you change one size, all other sizes will be recalculated
automatically.
115.
Changing image size and resolutionThe Resample Image checkbox is decisive when changing the
size or resolution of an image.
When the checkbox is cleared, the number of pixels in the
image does not change, and the size changes only due to the
fact that the pixels themselves become larger or smaller, that is,
only due to a change in resolution.
116.
Changing image size and resolutionWhen the Resample Image checkbox is checked, pixels are
recalculated (interpolation).
The program removes extra pixels or adds new ones to fill the
empty spaces between the new pixels.
117.
Changing image size and resolutionTo find out the details of this procedure, let's perform an
exercise in which we proportionally reduce and then increase
the size of the image again.
118.
Resize the image. Practice1. Let's continue processing the image.
2. Execute the command Image/Image Size.
A dialog box will appear on the screen for changing the
resolution and size of the image.
119.
Resize the image. Practice3. To compare the changes, multiply the image twice with the
Image/Duplicate command.
Selecting the first duplicate
120.
Resize the image. Practice4. In the dialog box, the image file size is a certain number.
Make sure that the chain aspect ratio option and the Resample
Image checkbox are set.
5. Select the image size unit in pixels, enter 10 times smaller in
the Width field (for demonstration purposes).
121.
Resize the image. PracticeAll dimensions have been recalculated, while the resolution
value in the Resolution field remains the same.
The new file size has also changed.
The image file size has been reduced by removing some pixels.
122.
Resize the image. PracticeA tenfold reduction in linear size results in an almost
hundredfold reduction in file size.
Click OK.
123.
Resize the image. Practice6. Let's enlarge the new image to its previous size.
Let's do this in two different recovery modes.
124.
Resize the image. Practice7. Select Image/Image Size again.
In the Width field, return the previous width value.
125.
Resize the image. PracticeIn the Resample Image rollout, select the interpolation method
when increasing the number of pixels in the image: the default
Bicubic method.
OK.
126.
Resize the image. Practice8. The image has increased to its previous size, but its quality
has noticeably decreased compared to the original image and
has become blurry.
9. For the second duplicate image, repeat the resizing
procedures, but select the Nearest Neighbor recovery method.
OK.
10. The image enlarged faster, but the image quality
deteriorated further.
127.
Changing image size and resolutionWhen the number of pixels is reduced, scaling occurs without
much deterioration in quality, since pixels are only removed
from the image according to a certain algorithm.
128.
Changing image size and resolutionThe smallest changes in quality occur when the number of
pixels is proportionally reduced by 25%, 50%, and 75%, where
every fourth pixel, every second pixel, or every three out of four
pixels is dropped.
With other coefficients, some averaging of the colors of
neighboring pixels occurs and the image is smoothed.
129.
Changing image size and resolutionIncreasing the number of pixels is a rather difficult (ambiguous)
operation.
The program must insert new ones between the existing pixels,
somehow calculating their colors.
130.
Interpolation methods:● Automatic – the program selects the best method
depending on the content of the image;
● Preserve Details – enhances image sharpness in areas of
fine detail in the image;
● Preserve Details 2.0 – with this algorithm, detail is not
enhanced, but clarity is not lost when enlarged;
131.
Interpolation methods:● Bicubic Smoother – provides better color smoothing during
interpolation;
● Bicubic Sharper – in this mode, the program averages the
colors of eight neighboring pixels;
● Bicubic – in this mode, the program averages the colors of
eight neighboring pixels, the method is the slowest, but the
most reliable, although even it will not give good results with
a large increase in the number of pixels;
132.
Interpolation methods:● Nearest Neighbor – the new pixel is assigned the color of
one neighboring pixel; the method is the fastest, but less
accurate;
● Bilinear – the colors of four neighboring pixels are
averaged, it works faster, but the result is average.
133.
Changing image size and resolutionYou should avoid increasing the number of pixels in the image,
especially significantly, by several times.
Let's move on to changing the resolution in the mode with
interpolation enabled.
134.
Changing image size and resolutionThe resolution of an image is directly related to the device on
which it will be played.
The problem often arises: how to achieve the same dimensions
on different devices (monitors with different resolutions).
135.
Change the image resolution. Practice1. Reopen the image.
2. Execute the command Image/Image Size.Set the Resample
Image rollout to Bicubic interpolation method in aspect
ratio mode.
136.
Change the image resolution. Practice3. In the Resolution field, enter, for example, 400 pixels/inch
instead of the original 200 pixels/inch.
The number of pixels in the image has doubled in width, and
the file size has almost quadrupled.
4. Click OK.
The image has been enlarged, and at the same viewing scales
the image has become smoother compared to the original.
137.
Bonus task. PracticeFor the image, create 3 more duplicates.
Alternately reducing the linear width width by 4 times for three
duplicates, restore them to their original size using three
different methods.
Arrange all 4 windows using view commands and compare the
quality of recovery methods.
138.
A moment of PhotoshopRaster graphics
139.
3 Graphic file formats140.
Graphic file formatsFile format is the way the file is organized (what information it
contains, where it is located and in what form).
One of the most important characteristics of a graphics file
format is the compression algorithm.
The compression algorithm determines the size of the file on
disk and how much smaller it will be than the information
volume.
141.
Graphic file formatsCompression is the process of presenting information more
efficiently (“squeezing the air” out of data).
Any compression algorithm exploits one or more of the
following properties of graphic data:
● redundancy,
● predictability,
● optionality.
142.
Compression without loss of information. RLEWhen we talk about homogeneous objects, we usually group
them, naming the total number, and not individually (for
example, it is easier to say: “there are 30 people in our class”
than: “in our class there is a person, person, person ...)
Due to repeated bytes in a row.
143.
Compression without loss of information. RLEIf there are several identical pixels in a row in an image, then
each of them is not recorded separately, but only their total
number and color.
8,8,8,8,8,14,14,14,10,10,10,10,10,10,14,14,14
5,8,3,14,6,10,3,14
144.
Compression without loss of information. RLERLE is not always acceptable.
Suitable for compressing pictures and drawings that have many
areas of the same color, and therefore many repeating pixels.
Not suitable for photographs.
145.
Compression without loss of information. Huffmanalgorithm
Developed in 1952 and used as a component in a number of
other compression schemes.
In an image, some colors appear more often and others less
frequently.
Savings can be achieved if frequently occurring colors are
encoded with shorter bit sequences, and rare colors with longer
bit sequences.
146.
Compression without loss of information. Huffmanalgorithm
By using a shorter set of bits for frequently occurring data.
Unlike RLE, the Huffman algorithm does not care whether
identical pixels are in a row or not, only their total number in
the image is important.
147.
Compression without loss of information. Huffmanalgorithm
But, if colors appear at almost the same frequency, then
compression will not produce any results.
Not suitable for photographs.
148.
Compression without loss of information. LZW (LempelZiv-Welch)Developed in 1978 by Israelis Lempel and Ziv and later refined
in the USA.
Based on replacing repeated byte strings with shorter
codes.
149.
Compression without loss of information. LZW (LempelZiv-Welch)Best for compressing data in indexed color, halftone, or
monochrome mode (there are many repeating chains).
The fewer colors, the better the compression.
Not suitable for photographs.
150.
Lossy compression. JPEG compressionBased on discarding unimportant information.
Based on some features of information perception by the
human eye.
151.
Peculiarities of information perception by the human eye1. A person pays more attention to large details of the image,
small ones of 1-2 pixels in size are not perceived unless you
specifically look closely.
When viewed at a certain distance, neighboring pixels generally
merge with each other.
152.
Peculiarities of information perception by the human eye2. A person perceives brightness more accurately than color.
Savings can be achieved by discarding some of the color
information but retaining the brightness information.
Best Format for Photos
153.
Raster graphics file formatsRe-compression after JPEG, for example with the Huffman
algorithm or LZW, is used only if necessary (the image will
deteriorate when printed).
The extension is used to determine the file format.
154.
ExtensionPCX RLE (drawings)
BMP Designed for Windows OS (office format). No compression
GIF
LZW compression. Storing images in indexed color mode (no more
than 256), for transferring images to the Internet, for creating simple
videos and banners on websites.
155.
ExtensionJPEG, JPG, JPEG compression. For photographs and illustrations on the
JPE
Internet, PC memory, and digital cameras. This format is
recognized as the most optimal solution in the quality-file
size balance.
PNG
LZ77. Designed specifically for the Internet (full-color images
with a transparent background, the color depth of PNG files
can be any, up to 48 bits). Does not support animation
156.
ExtensionTIF
F
LZW (no information loss occurs). An ideal format for printing, where
great attention is paid to the quality of raster images. The image is
stored layer by layer. TIFF is the best choice when importing raster
graphics into vector programs and publishing systems. The entire
range of color models is available to him from monochrome to RGB,
CMYK.
ICO For storing icons in Windows OS. Since icons are small in size,
there is no compression.
PS
D
Adobe Photoshop's own format. Allows you to save an image layer
by layer. No compression.
157.
EPS formatThe EPS (Encapsulated PostScript) format is a universal format,
supported by most vector and raster editors, as well as layout
programs.
Vector drawings are converted to this format before layout.
The format allows you to save both vector and raster graphics.
158.
PDF formatThe PDF (Portable Document Format) format was developed by
Adobe for electronic distribution of documents, is a universal
format, and is used as the native format of the Adobe Acrobat
reactor.
Supports raster and vector graphics, used in prepress.
159.
GIF formatThe GIF (Graphic Interchange Format) format is a raster format
widely used on the Internet.
The number of colors is limited to 256, allowing you to store
several frames in one file to create GIF animation.
160.
Формат RAWThe RAW format is designed to save raster images without
losing data.
Many professional digital cameras save lossy frames in the
negligible JPEG format without losing any color information in
the TIFF format.
161.
Формат RAWThe RAW format saves data captured in its original form by the
digital camera matrix, but it takes up several times less memory
compared to the TIFF format.
162.
Raster graphics file formats. CalculationsWhen storing an image in normal uncompressed form, each
pixel is allocated the same number of bits, depending on the
mode used.
For example, to encode 8 colors, 3 bits are enough.
To store an 8-color image measuring 100x200 pixels,
100x200x3= 60000 bits=7500 bytes will be required.
The 100x200 pixel image was compressed using a Huffman
algorithm based on color frequency.
163.
ColorOccurrence
frequency
Chain length
Bit string
Pink
9631
1
0
Yellow
3286
3
100
Black
1957
3
101
Green
1785
4
1100
Red
1470
4
1101
Blue
873
4
1110
White
627
5
11110
Gray
371
5
11111
164.
Raster graphics file formats. CalculationsTotal pixels in the image 100x200=20000
Pay attention to the bit strings: no one string matches exactly
the beginning of another.
In a continuous stream of bits, it is always possible to
determine which chain we are dealing with and where it ends.
165.
Raster graphics file formats. CalculationsTo estimate the volume of an image encoded in this way, you
need to multiply the frequency of occurrence of each color by
the length of its bit chain, and then add up all the results
obtained.
9631x1+3286x3+1957x3+1785x4+1470x4+873x4+627x5+371x5
=46862 bits = 5858 bytes.
166.
3 Graphic file formats. Part 2167.
Graphic file formats▷BMP
▷EPS
▷FLA
▷PSD
▷CDR
▷SWF
▷TIFF
▷CMX
▷MAX
▷GIF
▷AI
▷3DS
▷JPEG
▷EMF
▷ICO
▷PNG
▷WMF
168.
BMP▷BMP (or DIB - device-independent bitmap) - format for storing
graphic images.
▷Coordinates of image points and color values for each of them
are stored.
The file size, even with a relatively low resolution, is too large.
169.
BMP▷Used by many graphical applications running in the Windows
environment.
▷Ensures high quality of saved raster images, fast processing of
those that are small in size.
170.
BMP▷Supports color formats: black and white, grayscale, indexed
(palette) colors and RGB.
▷Allows adjustment of color depth and information
compression.
Does not allow saving alpha channels and embedding a color
profile.
171.
PSD▷PSD - raster file format (full name - Photoshop, extension psd).
It is a proprietary format of Adobe Photoshop raster graphics
programs.
▷Allows you to save information about layers, channels and
vector paths of a raster Photoshop document, as well as
frames.
172.
PSD▷Supports any color formats.
▷Serves for storing multilayer images created in these programs
for the purpose of their subsequent processing.
▷Can be used in many graphics applications.
173.
TIFF● TIFF - raster file format (full name - Tagged Image File
Format, extension - tiff).
● It is the most common raster format, available for use by
almost all existing graphics applications.
174.
TIFF● Supports color formats:
○ black and white,
○ shades of gray,
○ indexed (palette) colors,
○ RGB,
○ CMYK and
○ Lab.
175.
TIFF● For each of these formats, with the exception of the first,
alpha channels are preserved.
● It is possible to save vector contours, compress the saved
information, and also embed a color profile into the file.
176.
GIF▷GIF - raster file format (full name - Graphics Interchange
Format, extension - gif).
▷ Is one of three raster formats used on the Web (GIF, JPEG and
PNG).
▷Provides high image quality in a small file size thanks to the
use of tabular color formats and an effective way of
compressing information.
177.
GIF▷Allows the transfer of completely transparent areas of the
image, as well as the alternating mode, in which the image is
quickly loaded over the network with a gradual increase in its
quality.
▷An improved version of this format (GIF89a) allows you to
create video clip files.
▷Supported by almost all modern graphics programs.
178.
JPEG● JPEG - raster file format (full name - Joint Photographic
Experts Group, extension - jpg).
● Is one of three raster formats used on the Web (GIF, JPEG
and PNG).
● Differs from other raster formats in an effective way of
compressing graphic information by removing from the file
that part of it that does not have a noticeable effect on
image quality.
179.
JPEG● Supports color formats:
○ shades of gray,
○ RGB and
○ CMYK.
180.
JPEG● Allows you to smoothly adjust the level of compression of
information in the file, as well as use the interleaving mode,
which provides a gradual increase in image quality when
downloading it over the network.
● Does not allow transparent areas to be preserved in the
image and does not support alpha channels.
181.
PNG● PNG - raster file format (full name - Portable Network
Graphic, extension - png).
● Is one of three raster formats used on the Web (GIF, JPEG
and PNG).
● There are two varieties of this format:
○ PNG-8 and
○ PNG-24,
which differ from each other in the following properties.
182.
PNGThe PNG-8 format is based on the use of a tabular color palette
that allows adjustment of color samples, and provides the
transfer of completely transparent areas (like the GIF format).
The PNG-24 format supports the transfer of any transparent
areas.
For both of these formats, an interleaving mode is provided,
which is implemented when downloading a file over the
network
183.
EPS▷ EPS - vector file format (full name - Encapsulated PostScript,
extension - eps).
▷ Based on the PostScript programming language.
▷ Allows you to save any graphic and text information in a file
for the purpose of transferring it to other applications or
printing.
184.
EPS▷ This format is widely used by many graphics and publishing
applications due to its hardware independence and high quality
of printed images
185.
EPS allows the possibility of saving two versions ofimages in a file:
1) a postscript image, encoded in the PostScript language and
containing complete information about the graphic and text
objects of the document;
2) a raster copy of this image, displayed on the screen in the
absence of a PostScript interpreter program used to display its
original copy.
186.
CDR▷CDR - vector file format (full name - CorelDRAW, extension cdr).
▷Used for storing and transferring graphic documents (with
vector, raster and text information) created in the vector
graphics program CorelDRAW.
▷Has several varieties, determined by program versions.
187.
СМХ▷СМХ - vector file format (full name - Corel Presentation
Exchange, extension - cmx).
▷Is a metafile format that supports: vector, raster and text
information, as well as RGB, CMYK and Pantone colors.
▷ Designed for saving documents created in CorelDRAW for the
purpose of their subsequent transfer to other applications of
the Corel package.
188.
AI▷AI - vector file format (full name - Adobe Illustrator, extension ai).
▷Developed by Adobe Systems Incorporated for use on
Windows and Macintosh.
▷Designed for storing graphic documents created in the vector
graphics program Adobe Illustrator, as well as for transferring
these documents to other applications.
189.
EMF▷EMF - vector file format (full name - Enhanced Metafile Format,
extension - emf).
▷ Is an improved version of the WMF vector format used in
Windows.
190.
EMF▷Supports vector and raster graphics, as well as RGB colors.
▷Unlike the WMF format, it provides improved quality of
transfer of fills and strokes of vector graphics objects, as well as
a smaller file size.
191.
WMF▷WMF - vector file format (full name - Windows Metafile,
extension - wmf).
▷Designed for saving graphic and text information for the
purpose of transferring it to various applications running in the
Windows environment.
192.
WMF▷Has a number of disadvantages compared to the vector EMF
format, which is its improved version (especially with regard to
raster and text information).
193.
FLA*▷FLA - vector file format (full name - Flash document, extension
- fla).
▷Designed to save and transfer basic information about the
text, graphic, sound and script content of a flash video, while
maintaining the ability to edit it.
* Currently, the format is not relevant due to flash technology
that has lost its relevance.
194.
SWF▷SWF - vector file format (full name - Shockwave Flash,
extension - swf).
▷Represents a compressed version of the fla file.
It is this version of the flash movie that is displayed on Web
pages.
▷Provides small file sizes.
195.
MAX▷MAX - vector file format (extension - max).
▷Designed for saving and transferring three-dimensional scenes
created in the 3d studio max program.
196.
3DS▷3DS - vector file format (full name - 3D Studio (DOS), extension
- 3DS).
▷Designed for saving and transferring 3D scenes between
different 3D editors, as well as between their versions.
197.
ICOICO is a format for storing icon files in Microsoft Windows.
The ICO format is similar to the CUR (Windows cursors) format
for storing cursors.
The difference lies in the numerical value of one field in the
header structure, and the interpretation of the values of the
other two fields of the same structure.
198.
ICOOne ICO file contains one or more icons, the size and color of
each of which can be set separately.
The icon size can be any, but the most common are square
icons with a side of 16, 32 and 48 pixels.
199.
ICOIcons with sizes of 24, 40, 60, 72, 92, 108, 128 pixels are also
used.
Since Windows 98/2000, the format supports embedding JPEG
and PNG images, but usually icon data is stored uncompressed
200.
ICOIcons come in natural color (True Color, 32-bit color depth),
High Color (16-bit color depth), or with a fixed palette (of two
hundred and fifty-six, sixteen, or just two colors).
In this case, the number corresponding to each pixel does not
indicate the color, but the color number in the palette
201.
ICOIn terms of their structure, the images in the ICO file are closest
to BMP, but fundamentally differ from them in the presence of
an additional image - a mask applied to the background using
the bitwise “AND” operation, which allows for (full) transparency
of the image.
202.
ICOSubsequent XOR overlaying of the main image can even
produce "inverse" pixels in places where the background was
not masked
203.
ICO32-bit icons are supported - each pixel has 24-bit color and an
8-bit alpha channel, allowing for 256 levels of partial
transparency.
Using an alpha channel, you can display icons with smooth
(blurred) edges and shadows that blend with any background;
the mask is ignored in this case.
204.
A moment of Photoshop205.
A moment of Photoshop. Raster graphics formats:● BMP (Windows Device
Independent Bitmap)
● PCX (Soft Publisher's
Paintbrush)
● GIF (Graphics
Interchange Format)
● PNG (Portable Network
Graphics
● JPEG (Joint Photographic
Experts Group)
● TIFF (Tag Image File
Format)
● PSD (Adobe Photoshop)
206.
4 Color models and modes. Part 1207.
The relationship between light and colorLight is electromagnetic waves of a certain length emitted by an
object or reflected from the surface of an object (white light is a
combination of all wavelengths of the visible spectrum).
What we see is the light reflected from an object by a light
source or the light source itself.
208.
The relationship between light and colorColor is a form of light energy transmitted in the form of waves
(light has the property of causing human visual sensations, and
this is color).
Some waves cannot be seen by the human eye (infrared light
has a wavelength that is too long, X-rays has a wavelength that
is too short).
Between them is the spectrum visible to the human eye.
209.
The relationship between light and colorColor is a changeable phenomenon (physical characteristics of
a person, daylight and artificial lighting, light source, material,
environment).
Colors according to temperature can be divided into three
groups:
● warm (green, red, pink, yellow, beige, etc.),
● cold (blue, indigo, violet),
● neutral (black, white).
210.
Color models and modesColor is a very important and complex characteristic of an
image.
An image can be:
● black and white (that is, contain only two colors: white and
black),
● halftone (that is, contain different shades of the same color)
and
● color.
211.
Color models and modesColor is a very complex phenomenon; it has both a physical and
psychophysiological nature.
The color of an object depends not only on the object itself, but
also on the light source illuminating the object and on the
human vision system.
Moreover, some objects reflect light (board, paper), while
others transmit it (glass, water).
212.
The field of computer graphics consists of three areas:1) Image synthesis (computer graphics)
2) Extracting information from images and videos (computer
vision)
3) Image and video processing
213.
Computer graphics are used in many industries:● in the field of entertainment (augmented reality, computer
games, special effects, cinema, animation),
● in the field of security (road monitoring),
● in robotics,
● medicine,
● in production
● etc.
214.
Image Processing BasicsDigital halftone image (black and white) is an NxM matrix,
the elements of which are the brightness values of light
measured on a two-dimensional rectangular grid.
Since the processes in a computer are discrete, therefore the
images are also discrete.
215.
Image Processing BasicsThe size of a single value is typically one byte (or eight bits) and
takes values ∈ [0, 255].
Nowadays, larger sizes (10-16 bits) are sometimes used, for
example, in the work of photographers or photo artists.
216.
Image Processing BasicsColor is a psychological (physiological) property of human vision
that arises when observing objects and light, and not a physical
characteristic of objects and light.
The same object can be lit in different ways, causing that object
to take on different color values.
217.
Image Processing BasicsColor is the result of the interaction between light, the scene,
and the observer's visual system.
Human perception of light is studied by the sciences of
photometry and colorimetry.
Any light source can be described by a spectrum: the amount of
energy emitted per unit time for each wavelength in the range
380-720 nm
218.
Spectrum of sunlightThe x-axis indicates
the wavelength, and
the y-axis indicates
the relative sensitivity.
219.
Image Processing BasicsDepending on the method of formation in nature, emitted and
reflected colors are distinguished:
● light sources (sun, light bulb, etc.) emit light.
The eyes perceive this light as colored;
220.
Image Processing BasicsDepending on the method of formation in nature, emitted and
reflected colors are distinguished:
● light is reflected and absorbed when hitting the surface of
non-luminous objects.
The eyes perceive reflected radiation as the color of objects.
221.
Image Processing BasicsColor is a form of light energy transmitted in the form of
electromagnetic waves.
The human eye can perceive color waves with wavelengths
from 380 to 780 nm (a nanometer is one billionth of a meter, a
unit of measurement for the length of light waves).
222.
Image Processing BasicsIf the wavelengths of the light flux are 700 nm, the light is
perceived as red.
If the wavelengths are concentrated at the lower edge of the
visible spectrum (around 400 nm), the light is perceived as blue.
223.
Image Processing BasicsIf the wavelengths are concentrated in the middle of the visible
spectrum (about 550 nm), then the light is perceived as green.
These colors - red, green and blue - are called primary colors;
when they are mixed, white is formed.
224.
Image Processing BasicsTo describe color accurately enough, it is necessary to know the
intensity value for each individual wavelength, which is a large
amount of information that is not processed by the human eye
or brain.
225.
Image Processing BasicsLight reflected from objects exists in the form of a continuous
spectrum.
However, in order to separate it into individual colors, you need
a tool - the human eye, a monitor screen or a computer.
226.
The structure of the retina. Photoreceptors227.
In the eye, this is done by:● special photoreceptors,
● cones (measuring color) and
● rods (measuring light intensity, brightness).
228.
The structure of the retina. PhotoreceptorsThere are three types of cones that better perceive colors from
the blue, green or red spectrum.
The RGB model is based on this principle, in which color for
color reproduction is encoded using three basic colors (red red, green - green and blue - blue, respectively).
229.
Image Processing BasicsLight waves enter the retina of the eye, where they are
perceived by light-sensitive receptors that transmit signals to
the brain, where the sensation of color is formed.
This sensation depends on the wavelength and intensity of the
radiation.
Wavelength produces the sensation of color or chroma, and
intensity determines its brightness.
230.
Image Processing BasicsLight intensity is a measure of the energy of light affecting the
eye, and brightness is a measure of the eye's perception of this
impact.
The description of color can be based on the composition of
any color based on primary colors or on concepts such as
lightness, saturation, hue.
231.
Color models and modesA color image can be in a different color model.
To choose the optimal color model or color mode, you need to
have an understanding of the basics of color formation in
computer graphics.
The color of a pixel in a bitmap is determined by its bit depth.
232.
Bit color depthBit depth refers to how many bits of memory are allocated to
store the color information of each pixel.
The greater the color depth, the more shades can be displayed.
So, in a monochrome black and white image, only one bit is
allocated for each pixel: 21 - the color can be either black or
white.
233.
Bit color depthA halftone image uses 8-bit color depth and is capable of
conveying 28, or 256, shades of color, from white to black.
Color images require even more memory.
Depending on the color model, each pixel requires 28×28×28,
that is, 24 bits, for the RGB and HLS models, and 28×4, that is, 32
bits, for the CMYK color model (8 bits for each primary color).
234.
Bit color depthIf the graphics are intended for screen viewing, a significant role
begins to play how many colors the display monitor itself is
capable of transmitting, and this depends on the size of the
computer’s video memory in which the screen image is stored.
235.
Bit color depthCurrent versions of Adobe Photoshop allow you to work with
images in which the pixel bit depth can be 16 and 32 bits.
Increasing pixel bit depth results in larger file sizes, but such
images provide more tonal levels.
236.
Color depthEach pixel in a digital image has a specific color.
Thanks to this, we see a realistic image.
237.
Color depthVarious amounts of information can be used to convey the
color of a pixel.
The larger it is, the wider the range of transmitted shades and
the higher the accuracy of their reproduction.
Accordingly, the higher the image quality.
238.
Color depthThe quantity that determines the number of bits of color
information per pixel is called color depth or bit resolution.
If the bit resolution is equal to one, then each pixel can transmit
only 21 = 2 colors (the computer uses the binary number
system), black and white.
239.
Color depthIf the color depth is 8 bits, then each pixel can have 28 = 256
color shades.
If the color depth of the image is 24 bits, then each pixel can
take on 224 = 16.7 million shades.
240.
Color depthThe color depth is set in the range from 8 to 48 bits.
24-bit images containing 16.7 million color shades accurately
and realistically convey the colors of the surrounding world.
Single-bit, i.e. two-color images were used at the dawn of
computer graphics, when, due to low power, the computer
could not process a large amount of information.
241.
Color depthOver time, graphics became two-bit (4 colors), four-bit (16
colors) and eight-bit (256 colors).
Single-bit images, called a bitmap, are still used today where
color-tone transitions are not required.
242.
Color depthUsing a color model, you can write a color as a set of numbers.
The numbers, in turn, are encoded in the computer as a set of
bits (0 or 1).
243.
Color depthThe more bits, the more colors can be encoded.
Color depth (I) – the number of bits allocated to record the
color of one pixel (bit/t).
Maximum number of colors in the palette N= 21
244.
Maximum number of colorsI
N
1
2
2
4
4
16
8
256
16
65536
24
16777216
32
4294967296
245.
Color depthDepending on the color depth, the following image modes are
distinguished (using the example of Adobe Photoshop)
246.
Picture ModesModes
Color depth bit/t
monochrome
1
Indexed
8
Halftone
8
Grayscale
8
True Color
24
CMYK
32
RGB
24
247.
Test yourself248.
Test yourself1. What is the minimum color depth required to encode 20
colors (5 bit/t response), 10 colors, 100 colors?
249.
Test yourself2. What color in CMYK mode is encoded by the sequence (255,
0, 255, 0)?
The blue and yellow components have the maximum intensity.
Cyan ink absorbs red light, yellow ink absorbs blue, leaving only
green.
R red
G green
B blue
C cian
M magenta
Y yellow
250.
Test yourself3. How is red coded in CMYK?
To get red you need to take the maximum amount of purple (M)
and yellow (Y).
The sequence will be like this (0, 255, 255, 0)
R
red
G
green
B
blue
C
cian
M
magenta
Y
yellow
251.
Test yourself4. How is CMYK coded for white and black?
A white sheet of paper is white in itself; you don’t need to do
anything to get white (0, 0, 0, 0).
There is a separate component for black in CMYK (0, 0, 0, 255).
252.
Mixing colorsThe human eye is not capable of reacting differently to all
combinations of light rays that strike its surface because the
retina has only three types of cone cells that perceive color.
For example, in relatively low light, a person sees yellow if a
small portion of rays from the yellow region of the spectrum
enters the eye.
253.
Mixing colorsBut the eye reacts in the same way to certain mixtures of red
and green rays.
White sunlight consists of all the rays of the spectrum, but good
white light can also be obtained by mixing rays of only two
wavelengths - from the red and blue-green parts of the
spectrum.
254.
Mixing colorsEach color perceived by the eye can correspond to a huge
number of combinations of wavelengths; moreover, a limited
number of colored light rays with a given wavelength can
produce almost any color when mixed in different proportions.
255.
Mixing colorsThis is a fact of paramount importance for printers and
designers, since almost all modern methods of reproducing
color on a monitor and paper are based on it.
256.
Mixing colorsFor example, brown comes from mixing a dull green ray with a
slightly brighter red and little or no blue.
If you increase the brightness of all three rays, the brown will
lighten and turn into yellow-red.
257.
Mixing colorsWith this additive mixing, the saturated red, blue and green
colors are called "primary".
When two primary colors are mixed, a “complementary” color is
obtained.
258.
Mixing colorsFor example, if green is added to red in increasing proportions,
very rich yellow-red, yellow, yellow-green and green tones are
obtained.
If blue is added to green in increasing proportions, it will result
in deep blue-green tones.
Mixing blue with varying amounts of red will produce rich
shades of purple.
259.
Mixing colorsWhen a third primary color is added to such an additional color,
the resulting mixture begins to approach white (that is, the
trunk of the Munsell color tree).
These unsaturated colors are called "tertiary".
260.
Mixing colorsAdding the main rays of the
spectrum where they intersect
produces new colors.
261.
Mixing colorsColors formed by mixing two of the
three primary colors - red, green
and blue - are called
complementary colors and include
magenta, cyan and yellow, which
can be seen in the figure.
262.
Mixing colorsWhen all three main rays are mixed
in equal proportions, white light
appears.
263.
Mixing colorsAdditive color mixing was used in photography back in the 60s
of the 19th century by physicist James Clark Maxwell.
He recorded the brightness of the object's red, green, and blue
rays on separate black-and-white negatives, each of which
perceived rays of only one color.
264.
Mixing colorsHe then converted them into transparencies and projected
each onto a screen using rays of the appropriate color, taking
care that the images matched exactly.
The observer's eye reacted to the mixing of light rays reflected
from the screen in much the same way as to the subject.
265.
Mixing colorsSuch additive color reproduction is not used today because it is
inconvenient to obtain separate images and accurately combine
them during projection.
But fractional color reproduction, which is based in part on a
form of additive mixing, provided the first commercial success
of color photography and is now used in color television.
266.
Mixing colorsIf an observer looks at a distant image composed of multicolored dots, he does not distinguish between these dots, and
the colors merge.
The perception of the color of a small part of such a picture
depends on the relative number, size and brightness of the
dots of each color in this part.
Thus, mixing red and green dots of the same size and number
will cause the appearance of yellow.
267.
Mixing colorsThe Autochrome method, which the Lumière brothers sold back
in 1907, is based on the principle of fractional reproduction.
Their photographs consisted of black and white photo
transparencies covered with a transparent layer of starch
grains, colored red, blue and green with equal numbers of
grains.
268.
Mixing colorsThey created a mosaic of dots, the brightness of which
depended on the density of the image.
The color television image also consists of luminous red, blue
and green dots or streaks.
269.
Mixing colorsColor printing uses a grid of small dots, centered so that some
of them intersect with each other, and some are located next to
each other.
These dots are printed in black and three other colors.
270.
Mixing colorsHowever, these colors are different: yellow (reflecting red and
green rays), purple (reflecting red and green rays) and cyan
(reflecting blue and green rays).
To understand why the choice fell on the colors mentioned, it is
necessary to understand the reproduction of color based on
subtraction.
All objects owe their color to the subtraction of other spectral
rays from the light incident on them.
271.
Getting colors based on subtractionRed paint emits predominantly
red light because it absorbs most
of the blue and green rays of light,
leaving it to reflect the red rays.
272.
Mixing colorsIf you mix this paint with another, then each will still subtract
the required share of rays, and the mixture will reflect even less
light.
Therefore, when red paint is mixed with green, the red color
pigment absorbs a lot of green and blue rays, and the green
pigment also subtracts blue rays and also most of the red ones.
The result is a dark color, but it is not gray.
273.
Mixing colorsThe color of the rays reflected by unmixed red and green paints
is far from pure.
It consists of color bands that partially intersect.
Red paint will probably reflect a significant amount of yellow
rays, while green paint will probably reflect a lot of both yellow
and blue rays.
274.
Mixing colorsBoth components will reflect a certain amount of yellow rays
and the mixture will acquire a dark yellow color, that is, brown.
This is called subtractive color mixing.
275.
Mixing colorsIf you mix red paint with yellow, you will obviously get an
orange color, since both components actively reflect rays only
at that wavelength.
Mixing yellow and blue usually produces a dull green, and the
same thing happens when combining a yellow filter with a blue
one, although theoretically these two colors subtract the
primary colors from the light output.
276.
Mixing colorsWhen mixing by subtraction, the colors are always darkened,
since such a mixture necessarily contains less light than any of
its components.
This was one of the reasons why the Impressionists painted
with dots and strokes of bright spectral colors, rather than
mixing paints.
277.
Mixing colorsThe intersecting dyes that make up the colors on the paper
need to contain red, blue and green—the primary colors—but
they shouldn't be too dark.
Therefore, cyan, magenta and yellow dyes are used in printing.
278.
Mixing colorsBlue absorbs red rays and transmits blue and green ones;
Magenta absorbs greens and transmits reds and blues, while
yellow absorbs blues and transmits reds and greens.
Where cyan and magenta intersect, blue is formed, and so on.
279.
Mixing colorsYellow, cyan and magenta are the main complementary colors,
since each of them contains equal shares of the two main rays
of the spectrum and each is able to subtract a third primary
color from the luminous flux.
280.
Color modelsWith the development of computer graphics and typography,
the need arose to express “color madness” artificially.
A color model is color information stored as numbers in a
computer.
281.
Color modelsAny color is reproduced by mixing the base colors in different
proportions, so to record a specific color in numerical form, you
only need to indicate the proportion of each of the base colors.
In addition to basic colors, other parameters are used:
illumination, hue, saturation and brightness.
282.
Color modelsConversion from one
color model to another
is carried out in graphics
programs.
You can adjust color
levels from 0 to 255.
283.
Color modelsDepending on the application, different color models have been
created:
● additive,
● subtractive and
● perceptual.
Additive models include the RGB color model, subtractive
models include the CMYK model, and perceptual models
include the HSB model.
284.
RGB (Red, Green, Blue)Represents emitted light.
Describes color as a mixture of three basic colors:
● red,
● green and
● blue.
This model is used to reproduce the spectrum of light visible to
the human eye.
285.
RGB (Red, Green, Blue)Black is the absence of any color, white is a
mixture of three basic colors.
To create different colors, you need to add
different levels of primary colors.
The RGB model is used when displaying
information on a monitor or TV screen.
286.
Color modelsMonitors use the RGB color model, which is based on three
basic colors:
● Red,
● Green and
● Blue.
The absence of all colors in this model gives black, and the
presence - white
287.
CMYIt is reflected light that behaves according to different laws than
emitted light
The sheet of paper itself is white, and the colors applied to it
block the reflection of certain waves.
The CMY model is the opposite of the RGB model.
288.
CMYIf you mix the base colors of the RGB model, you can get the
base colors of the CMY model, which is used in printing inks,
photo dyes, and color toner for printers.
By mixing base colors, we subtract certain colors from the white
light reflected by the sheet of paper.
289.
Результат сложенияAddition of basic RGB
colors
Addition result: CMY base
color
Red + green
Yellow
Red + blue
Magenta
Green + blue
Cyan
290.
CMYKSame model as CMY, but with black added.
CMY inks always create a bit of impurity, and different types of
paper create different levels of brightness when they absorb
the ink.
Mixing 100% CMY ink levels results in a dirty brown color
instead of black.
In printing, pure black is required.
291.
CMYKIn printing, the CMYK color model is most often used, based on
four basic colors:
Cyan,
Magenta,
Yellow and
Black.
292.
CMYKIn this model, the absence of all colors implies white, the
presence - black.
A mixture of primary colors in equal proportions produces
secondary colors for the corresponding models.
293.
Primary and secondary colors of RGB and CMYK models294.
Primary and secondary colors of RGB and CMYK modelsCMYK and RGB palettes have different color gamuts (ranges of
colors) that can be reproduced.
The color gamut of the RGB palette is much wider than that of
the CMYK palette.
Therefore, some colors that you see on your monitor screen
can only be approximately reproduced on a printer.
295.
LABLAB uses the concept of Luminance contained in the L channel.
Channel A stores information about Tones from green to
magenta, information about Tones from cyan to yellow is
stored in channel B.
It has been adopted as an international color standard by the
International Commission on Illumination
296.
LABThe advantage of this model is its independence from the
method of color production; its measurement system can
describe both print colors and colors emitted by the monitor.
An application of the LAB model is sharpening.
297.
LABWhen increasing the sharpness of RGB images, spots of
extraneous colors may appear and an unjustified increase in
color saturation; in the LAB model, you can sharpen only the
brightness channel, but the image colors will not change.
298.
LABThis universal model allows you to get almost any color
accessible to the human eye.
Its colors look exactly the same on the monitor and on the
printer.
The Adobe Photoshop editor uses this model to translate an
image from one model to another.
299.
HSB (HSV, HSL)HSB (HSV, HSL) - color is decomposed into
three components:
● hue,
● saturation and
● brightness / value.
Basic colors match the RGB color model.
300.
HSB (HSV, HSL)You can't work directly with images in this
model in Photoshop, but you can create
colors using HSB.
Many people constantly use the HSL color
model when working in MS Office.
301.
Perceptual models HSB and HLSIn these models, color is determined by three parameters:
● Hue,
● Saturation and
● Brightness or Lightness.
Hue indicates the position of a color on the color wheel.
302.
Perceptual models HSB and HLSSaturation reflects its intensity.
The higher the saturation, the more saturated the color
becomes.
The smaller it is, the more faded and gray it becomes.
303.
Perceptual models HSB and HLSBrightness reflects the amount of light passing through a
transparent color object in the HLS system, and the amount of
black in the color for the HSB model.
The higher the brightness, the closer the color is to white; The
smaller it is, the darker the color.
At minimum brightness it turns black.
304.
Color channelsWhen each pixel is allocated 24 or 32 bits, they are divided into
three or four groups of 8 bits each.
Bits of one group make up a channel; with an 8-bit color depth,
an image can contain 256 shades of color, from white to black.
Each channel is a monochrome halftone image, and the final
full-color image is composed of three to four halftone images.
305.
Color channelsEach color model has its own channels.
For example, in the RGB model, one channel describes the red
component, the second - the green and the third - the blue
component of the color.
The CMYK model has four channels: cyan, magenta, yellow and
black.
The Lab model has three channels, one of them describes the
brightness L, and the other two describe the variables a and b.
306.
Color channelsBy default, black and white, grayscale, duplex, and indexed
palette images have only one channel, RGB and Lab images
have three channels, and CMYK images have four channels.
However, you can create additional channels in the form of
alpha channels, which are necessary for storing complex
selections in documents.
307.
Channels Palette308.
Channel paletteTo view an image in different channels and to work with
channels, use the Channels palette.
To display it on the screen, execute the command
Window/Channels.
309.
Channel paletteIn the left column of the palette there is a channel visibility
indicator in the form of an icon with an image of an eye.
By default, all channels are turned on, and you see a full-color
image with all the channels mixed together.
310.
Channel paletteYou can view an image in one, two or more channels.
To return to showing all channels, click in the visibility indicator
on the top line with the name of the color model (RGB, CMYK,
Lab).
To make one channel active, you need to click on the line with
its name.
311.
Channel paletteSelect the Red channel and you may see only a gray halftone
instead of a red-tone image.
To restore normal color perception, you need to run the
following command Edit / Preferences and on the Interface
tab check the box Show Channels inColor.
312.
Channel paletteHowever, this is not always convenient, since working with color
halftone images is much more difficult: details are less visible
and the eyes get tired faster.
When viewing two or more channels, the image will always
appear in color due to color mixing.
313.
Channel paletteBy selecting channels one at a time, you can adjust them
independently of each other.
You can grayscale not a full-color image, but only one channel if
it looks better than the full-color image after grayscale.
Information about other channels will be lost.
314.
Color ModesColor modes are the implementation of a color model within a
specific graphics editor.
To convert an image to a different color model, use the
Image/Mode command and then select the desired mode in
the submenu.
315.
Color Modes● Bitmap (Black and white) – black and white image;
● Grayscale – halftone image, or image in gray scale;
● Duotone (Duplex) – duplex, that is, a halftone image to
which one more color is added (although you can also
choose a four-color option here)
316.
Color ModesIndexed Color – indexed colors;
RGB Color – RGB mode;
CMYK Color – CMYK mode;
Lab Color – Lab mode;
Multichannel – multichannel mode, when each channel
exists separately, without mixing.
317.
Color ModesIf the command is grayed out, it means the current mode is not
available.
For example, a color image cannot be converted to black and
white; it must first be converted to grayscale.
Some commands are executed with acknowledgment of color
loss information.
318.
Color ModesWhile transferring from the RGB palette to Lab and back does
not lead to loss of color information, the same cannot be said
about transferring from RGB or from Lab to CMYK.
319.
Color ModesThe color gamut of the CMYK palette is much smaller, and, in
addition, it depends on specific models of printers or
phototypesets.
You will notice how bright colors will fade, and some shades
may change.
Therefore, it is preferable to convert to this palette before
printing.
320.
Color modes. Practice1. Refresh the workspace using the Window/ Workspace/
Reset Basic-1 command.
2. Open a document.
3. Duplicate the image using the Image/Duplicate command
and place it next to the original image.
321.
Color modes. Practice4. Click on the duplicate title and open the Channels palette.
This image is in the RGB model, therefore, it contains three
channels.
5. View the contents of each channel.
Then turn on the color channels in pairs in order to obtain an
image in the tones of the secondary colors: yellow, blue and
violet.
322.
Color modes. Practice6. Turn on all channels.
To convert an image to the CMYK color model, use the
following command: Image/Mode/CMYK Color; you may notice
a dulling of the yellow tones.
You can compare the colors of the duplicate and the original.
323.
Color modes. Practice7. In the CMYK color model, an image consists of four channels.
One more channel has been added.
324.
Color modes. Practice8. View the contents of each channel.
Then turn on the color channels in pairs in order to obtain an
image in tones of the secondary colors in this model: red, blue
and green.
9. Turn on all channels.
Convert the image to the Lab Color color model by executing
the command Image/Mode/Lab Color.
325.
Color modes. Practice10. Review the contents of each channel and their pairings.
The Lightness channel contains only brightness information,
channels a and b contain different color ranges of the color
wheel.
Three channels.
326.
Color modes. Practice11. Go back through the History palette to the CMYK Color line.
Convert the image to the Multichannel color model using the
Image/Mode/Multichannel command.
The image consists of four independent channels
327.
Color modes. Practice12. Return to the Open line of the History palette.
Convert the image from the RGB color model to the
Multichannel color model in the same way.
328.
Color modes. PracticeThe image consists of three independent channels (colors from
the CMY model), the file size is again independent of the
number of channels.
Notice how the shade of the background color has changed.
329.
Conversion to halftone modes. Practice1. Open a document
2. Open the Channels palette.
Let's convert this image from the RGB model to a halftone
Grayscale using the Image/Mode/Grayscale command.
330.
Conversion to halftone modes. Practice3. After executing the command, the program will need your
consent to lose color information.
After confirmation, you will find only one gray channel in the
channel palette.
The file size has decreased.
The threefold decrease is due to a decrease in the number of
channels.
331.
Conversion to halftone modes. Practice4. Convert the image to duplex mode using the Image/ Mode/
Duotone command.
5. In the dialog box, in the Type rollout, you can select the
number of color inks (up to four Quadtones) and to the left of
the proofing window, adjust the duplex curve.
332.
Conversion to halftone modes. Practice6. One channel will appear in the channel palette with the name
of the selected number of colors.
The file size has not changed and does not depend on the
number of colors.
333.
Conversion to halftone modes. Practice7. This model is used to prepare an image for poster printing;
usually, in practice, no more than two colors are used.
Increasing the amount of dye results in a resulting brown color.
334.
Conversion to halftone modes. Practice8. Using the Monotone mode in the Type rollout, you can tint
gray images or photographs with one color
335.
Indexed colorsColor depth characterizes the amount of memory for each
pixel.
336.
Indexed colorsEach color, when shown on the display, is divided into three
components:
● R - red,
● G - green and
● B - blue.
Pixel color information is divided into three channels, that is,
into parts that reflect the brightness of each component.
337.
Indexed colorsIn the early days of computer technology, displays that were
unable to display more than 256 colors were used, but there
was another way to store color information: indexed colors.
338.
Indexed colorsIn this mode, for each pixel only its index, or number in a
palette of 256 colors, common to the entire graphic file, is
stored.
When exporting to this model, the colors present in the original
full-color image are selected, which allows you to achieve
completely normal color rendition
339.
Indexed colorsFile size is significantly reduced when using indexed colors.
Although the need to use this method disappeared with the
disappearance of old displays, the Internet appeared, and in
connection with this, it became necessary to reduce file sizes to
a minimum in order to reduce the time of their transfer over
the network.
340.
Indexed colorsYou can convert a grayscale image or an RGB image into
indexed colors.
341.
Indexed colorsWhen converting a color
image, a dialog box appears
in which you define the
conversion parameters.
342.
Indexed colorsIf the image has more than 256 colors, then some of them are
discarded during conversion.
343.
Photoshop uses a variety of palettes to choose from:Local,
Exact,
Uniform,
Custom,
Adaptive,
System (Windows, Mac OS).
344.
Indexed colorsBy selecting the Custom
type in this rollout, you will
be able to manually edit the
palette in the Color Table
dialog box, selectively
replacing some colors with
others or selecting one of
the standard palettes
345.
Indexed colorsThis table is called by the
command Image/ Mode/
Color Table.
346.
Indexed colorsIn the Table rollout, you can select one of the standard indexed
palettes:
● Black Body - a set of colors emitted when a black body is
heated,
● Grayscale,
● Spectrum - spectrum of sunlight,
● System – two standard system scales for Windows and
Macintosh.
347.
Indexed colorsTo change the color manually, click on the corresponding
square, select the desired color in the Color Picker window.
When indexing a color image, you can simultaneously convert it
to gray scale and replace it with a scale that transitions between
any two colors.
348.
Indexed colorsAs an exercise, let's convert an RGB image to a grayscale
grayscale image, and then tone it by replacing the grayscale
with shades of other colors.
349.
Indexed colors. Practice1. Open an image.
2. Duplicate the image. For a duplicate, run the command
Image/Mode/Grayscale. The image will become a gray
halftone, but we will try to restore those colors.
350.
Indexed colors. Practice3. Convert it to an indexed scale using the Image/ Mode/
Indexed Color command.
351.
Indexed colors. Practice4. Call up the color table using the Image/Mode/Color Table
command.
The table consists of 256 colors (squares).
Click on the top left color square and drag the pointer to the
opposite corner of the table, thereby selecting all the squares.
352.
Indexed colors. Practice5. The Color Picker window will then appear on the screen to
select two new colors.
First you have to replace the top color, which is black.
353.
Indexed colors. PracticeClick, for example, in the dark orange part of the narrow vertical
spectral scale, then in the left square box, click on any dark red
shade.
OK.
The image will be filled with a single color.
354.
Indexed colors. Practice6. Now in the same window, select the final transition color.
Select a light yellow color in the left square box.
OK.
7. If you have the Preview checkbox checked, the image will
immediately change to shades of orange-red, becoming tinted.
8. Compare the resulting image with the original, this way you
can tone any gray image.
355.
Indexed colors. Practice 2Tint the image based on the standard Black Body indexed color
table from the Table rollout, and also try a combination of dark
blue and yellow (or any other combination of your choice) in a
custom palette.
356.
Monochrome imageOnly the grayscale image can be converted to monochrome
black and white, which reduces the file size significantly.
Halftone images are printed using a halftone screen, i.e., gray
tones in raster printing are transmitted only using black ink.
357.
Monochrome imageThe entire image is divided into square raster cells consisting of
several pixels.
The darker the tone, the more black pixels there are in the
raster cell, and vice versa.
358.
Monochrome imageThe cells are arranged in lines inclined at a certain angle.
These lines are called raster lines.
Black pixels can be grouped within a cell in the form of lines,
circles, diamonds, etc., forming a raster dot.
The shape of this point can also be selected when setting up the
raster.
359.
Monochrome imageTo convert a gray image to black and white, you need to run the
command Image/Mode/Bitmap.
The dialog box specifies the conversion parameters.
360.
Convert to Monochrome Dialog BoxIn the Output
rollout of the
Resolution
section, enter the
resolution of the
final output device.
361.
In the Method rollout, you select the conversion method:● 50% Threshold – all pixels whose brightness exceeds 50%
become white, the rest become black;
● Pattern Dither – black and white pixels in a raster cell are
arranged in the form of a standard geometric pattern;
● Diffusion Dither – black and white pixels in the raster
pattern are located randomly;
362.
In the Method rollout, you select the conversion method:● Halftone Screen – this mode provides ample opportunities
for customizing raster parameters: lineature, tilt angle,
raster dot shape;
● Custom Pattern – select a ready-made raster pattern.
363.
Convert to monochrome image. Practice1. Open an image.
2. Convert it to gray scale with the Image/Mode/Grayscale
command.
3. Run the command Image/Mode/Bitmap to convert to black
and white, this will reduce the file size by several orders of
magnitude due to the one-bit depth.
364.
Convert to monochrome image. Practice4. In the Output rollout under Resolution, enter the resolution
of the destination output device, for example 100 dpi (pixels per
inch).
The higher the resolution, the better the quality of the
monochrome image.
5. In the Method rollout, select the Diffusion Dither method.
OK.
365.
Convert to monochrome image. Practice6. Return to the gray image in the History palette by clicking on
the Grayscale line.
During conversions, the document window size will change
7. Convert the gray image to monochrome again, but using a
halftone raster.
366.
Convert to monochrome image. Practice8. Run the command Image/Mode/Bitmap again.
In the Method rollout, first select Pattern Dither, then Custom
Pattern and 50% Threshold.
367.
Convert to monochrome image. PracticeAfter each transformation in the History palette, we return to
the gray image by clicking on the Grayscale line.
368.
Convert to monochrome image. Practice9. Call the dialog box again and select the Halftone Screen
method.
In the dialog box, in the Frequency rollout, enter the raster
lineature, that is, the number of raster elements per inch, set it
to 50 lines/inch.
The greater the difference between resolution and lineature,
the more shades a monochrome image can convey.
369.
Convert to monochrome image. Practice10. In the Angle field, leave the angle at 45°.
This is the standard angle of inclination of raster lines.
370.
Convert to monochrome image. Practice11. In the Shape rollout, select the shape of the raster dot.
You can choose: Round, Diamond, Ellipse, Line, Square,
Cross.
Select Line.
OK.
371.
Convert to monochrome image. Practice12. If you look at the resulting image at 200% or 400% scale, you
will see how the raster is structured.
You will see lines at 45° angles.
13. Parameters: resolution 100 dpi, Halftone Screen method,
Frequency 10, angle 25°, Cross.
372.
Convert to monochrome image. Practice 2Convert a portrait to black and white using Halftone Screen
mode with Frequency of 20 lines/inch, 30° line angle and
different dot shapes.
373.
Color management systemsThe situation when designers and printers have to work in
different color spaces leads to errors in color rendering at the
stage of transition from one color model to another.
An alternative to this approach is to use a hardwareindependent color management system (CMS).
374.
Color management systemsThe essence of a CMS is that, regardless of software, color is
transferred from one processing stage to another without
distortion.
Ensures visible color space consistency across all peripherals
and applications running on the system.
375.
Color management systemsNative CMS support on the Macintosh platform (CMS ColorSync)
has long been the platform's choice among graphics
professionals.
376.
Color management systemsThe CMS must take into account that all output devices have a
fixed range of reproduced colors and tones, called the color
gamut.
377.
Color management systemsThe color gamut is limited to the most saturated colors that the
device has to work with, i.e. its primary colors.
It is impossible to obtain a more saturated red color on a
monitor screen than that of its phosphor, or a more saturated
green color when printed on a printer than as a result of mixing
cyan and yellow inks.
378.
Color management systemsThe color gamut area is smaller than the color gamut of almost
any color model.
The second problem that a CMS must solve is that input devices
do not have a color gamut, since there is no sharp boundary
between the colors they perceive and those they do not
perceive, no matter what they capture.
379.
Color management systemsAlthough input devices do not have a color gamut, they do have
a fixed dynamic range — the range of brightness levels at
which the devices are capable of operating.
380.
Color management systemsBelow a certain level of darkness, the scanner or digital camera
is no longer able to distinguish brightness levels and returns a
value of zero, indicating darkness.
Above a certain brightness level, input devices are unable to
detect changes in brightness, which is quite rare in scanners
and all too common in digital cameras.
381.
Color management systemsInput devices have a wider dynamic range than output devices.
An additional difficulty for a CMS is that the color schemes of
different devices do not match.
382.
Color management systemsTo address these issues, device profiles have been developed
to describe the difference in color representation between a
device and a specific color model.
The device profile contains information about three parameters
that describe the operating mode of the device.
383.
Parameters describing the operating mode of the device:● Color range - color and brightness of dyes (primary colors);
● Dynamic range - color and brightness of white and black
points;
● Characteristics of tone reproduction of dyes.
384.
Color management systemsMost professional and semi-professional equipment comes
with profiles.
These profiles are usually universal for a specific model, and not
for your specific product, so it is necessary to configure the
device parameters in accordance with some standard calibration.
385.
Color management systemsReference values for describing the characteristics of color
reproduction are established by the International Color
Consortium (ICC - International Color Consortium), created in
1993.
386.
Color management systemsCMSs typically include calibration facilities, i.e., a means of
tuning a specific instance to meet the requirements of an ICC
profile.
Calibration tools can be hardware-software or purely software.
387.
Color management systemsThere is no ideal CMS that is equally suitable for all devices,
works equally on all platforms and software.
The most successful can be considered CMS implemented at
the operating system level.
The Windows operating system uses a CMS known as Windows
Color System (WCS).
388.
Color management systemsOf the CMSs that are external to operating systems, the most
widely used are programs from companies that have long been
working in the field of color photography, printing, and digital
graphic technologies:
● Agfa Foto Tune,
● Kodak DayStar Color Match.
389.
Color management systemsThere are two alternatives: constant calibration of peripheral
equipment or the use of special color atlases.
The first way is quite expensive and requires the participation
of specialists.
390.
Color management systemsA color atlas is a collection of pre-formed standardized shades
of colors, compiled into an ordered table, which can be used
directly as needed.
Pantone atlases are widely used.
391.
4 Color models and modes.Part 2
Representing colors in a computer
392.
Color modelsRGB color system,
CMYK color system,
HSB color rendering system,
LAB color rendering system,
Grayscale color system.
393.
RGB color systemThis model got its name from
the first letters of English words:
● Red,
● Green,
● Blue.
394.
RGB color systemAny color in the RGB model is
formed by adding in various
proportions three basic colors:
● red,
● green and
● blue.
395.
RGB color systemThe monitor and scanner
operate in the RGB color model.
396.
Description of color in RGBColor is defined
by three values
ranging from 0 to
255.
397.
Description of color in RGBEach value
corresponds to
one of the basic
colors and
indicates its
content in this
color.
398.
Description of color in RGBThe values are
written in the
order:
● red component,
● green
component,
● blue
component.
399.
Practice. Describe the colors:Black,
White,
Red,
Green,
Yellow,
Light gray.
400.
CMYK color systemThis model was named after the
first letters of English words:
● Cyan,
● Magenta,
● Yellow.
But this model also includes pure
black color (letter K in the model
name).
401.
CMYK color systemAny color in the CMYK model is
formed by subtracting in different
proportions three basic colors:
● Cyan,
● Magenta,
● Yellow.
These colors are basic.
Printers use the CMYK color model.
402.
Description of color in CMYKColor is
determined by
three values
ranging from 0 to
100%.
403.
Description of color in CMYKEach value
corresponds to
one of the basic
colors and
indicates its
content in this
color.
404.
The values are written in the order:● Cyan,
● Magenta,
● Yellow
components.
405.
Practice. Describe the colors:Black,
White,
Magenta,
Green,
Yellow,
Grayscale.
406.
HSB color systemHSV (Hue, Saturation, Value)
or
HSB (Hue, Saturation, Brightness) —
color model,
407.
The color coordinates are:● Hue - color tone.
Varies from 0-360°, but is sometimes reduced to the range 0100 or 0-1.
408.
The color coordinates are:● Saturation.
Varies between 0-100 or 0-1.
The higher this parameter, the “purer” the color, so this
parameter is called color purity.
And the closer this parameter is to zero, the closer the color is
to neutral gray.
409.
The color coordinates are:● Value or Brightness.
Set in the range 0—100 and 0—1.
410.
HSB color systemWhat all these models have in common is that they are based
on an attempt to copy the perception of color by the human
eye.
These models are convenient to use when choosing colors.
411.
LAB color rendering systemA relatively new model with a
number of significant advantages.
Combines the best properties of
CMYK, RGB, HSB models.
412.
LAB color rendering systemThe LAB model is suitable for
both four-color transparent ink
printing and screen display,
providing excellent screen quality
and color reproduction.
413.
LAB color rendering systemIt is not hardware dependent.
This model has a wide color
range compared to others.
414.
LAB color rendering systemThe figure shows the
characteristics of the color range
coverage of various color models.
415.
LAB color rendering systemThis color model is used in many
programs as an intermediate
option when converting one color
model to another.
416.
Description of color in LABColor in LAB is determined by three
parameters:
● Lightness (L)
Two chromatic components:
● а — the parameter changes from
green (–128) to purple (127),
● b — the setting changes from
blue (–128) to yellow (127).
417.
Description of color in LABThe values of parameters a and b
are specified by numbers from –
128 to 127.
Lightness varies from 0 to 100%.
The maximum lightness value
corresponds to the maximum
color brightness and vice versa.
418.
Grayscale color system● This color model is designed to work with halftone images.
● This model uses 256 shades of gray and one color channel
(black).
419.
Palettes● Default palettes,
● PANTONE system palettes.
420.
Default palettesIt is more convenient and easier to use the default palettes built
into professional graphic editors:
● Default CMYK — for printing,
● Default RGB — for screen presentations.
421.
PANTONE system palettesThe colors in this palette
are used to prepare
images for subsequent
printing.
422.
PANTONE system palettesAfter color separation,
you will get an image
that most accurately
conveys the shades
created in the graphics
editor.
423.
4 Color models and modes.Part 3
Working with color
424.
Working with colorI. Color selection,
II. Color management.
425.
I. Color selection426.
General conceptsThere are two types of color in Adobe
Photoshop:
● Foreground,
● Background.
427.
General concepts● The background color is selected for fills,
and the working color is selected for
brushes.
But not always.
In order not to get confused for now, we will
consider it this way, but adjusted for
exceptions.
428.
General concepts● In the Tools panel you can see what color
is set for each type of color.
429.
Color selection. Method 1In the Swatches palette, clicking
on the desired color sets the
working color (Foreground), and
clicking while holding down the
Ctrl key sets the background
color (Background).
430.
Color selection. Method 2In the Tools panel, clicking on the
top square will allow you to select
a working color, and on the
bottom - a background color
using the Color Picker dialog
box.
431.
Color Picker – manual color selection432.
Color Picker – precise color setting433.
Test yourself• In what case is it necessary to
specify a numerical value?
434.
Test yourself• In what case is it necessary
to specify a numerical value?
Always.
When you know the numerical
value of a color.
435.
Test yourself• In which case should I enter
RGB color parameters, and in
which CMYK?
436.
Test yourself• In which case should I enter
RGB color parameters, and in
which CMYK?
For printing we set colors in
CMYK, for web we set colors in
RGB.
437.
Color Picker – manual color selection438.
Test yourself• When should you respond
to these warnings?
439.
When should you respond to these warnings?If you select colors from the
palette manually, rather than
specifying them with digital
values, then if the document is
intended for:
• printing, the colors used
should not be outside the
CMYK palette.
This means you are
responding to a print warning.
440.
When should you respond to these warnings?If you select colors from the
palette manually, rather than
specifying them with digital
values, then if the document is
intended for:
• web or screen presentations,
the colors used should not be
outside the RGB palette.
This means you are responding
to a warning for the web.
441.
Test yourself• In what case is it necessary to
ensure that there are no
warnings about going beyond
the CMYK and RGB palettes?
442.
Test yourself• In what case is it necessary to
ensure that there are no
warnings about going beyond
the CMYK and RGB palettes?
When we select corporate colors
that will be used for both print
and web and should look
identical.
443.
Color LibrariesThis window
appears when you
navigate to spot
color libraries.
Working with this
window is similar
to working with
the Color Picker.
444.
Selecting colors from images• If we need to select the color that is in the image, then we
need to use the Eyedropper Tool.
• Clicking on the image with the Eyedropper Tool will set the
working color, and Alt-clicking will set the background color
445.
II. Color management446.
Background and foreground colormanagement
• The background and working colors
specified in the Tools palette can be swapped.
To do this, you can use either the arrow
button or the X key.
447.
Background and foreground colormanagement
• To set the default colors: desktop – black,
and background – white, you need to use the
squares button on the Tools palette or the D
key.
448.
Swatches palette – adding colorsThe Swatches palette is
convenient not only for
choosing colors, but also for
storing them.
449.
To add new colors:1. Set the working color to the
desired color value.
2. In the Swatches palette, use
the tool to add a color to the
palette.
450.
451.
Creating your own paletteIt is useful to use your own palettes when
working.
452.
Creating your own palette:1. Select and open an image that matches
the palette you are creating.
2. Delete color swatches from the
Swatches palette (Alt + click on the
swatch to be deleted).
3. Use the Eyedropper Tool to select a
working color from the image.
453.
Creating your own palette:4. Click on an empty space in the Swatches
palette - a dialog box for creating a sample
will appear.
Enter a name for the pattern.
OK.
454.
Creating your own palette:5. Fill the entire palette in the same way.
6. Save the created palette.
7. Another time, all you have to do is load
the created palette.
455.
Color panel• You can use the Color
palette to select colors.
• Working with it is
similar to working with
a palette
456.
Color panel: Color wheel forcolor selection
This tool allows you to
automatically select harmonious
color combinations.
457.
Color circleA circle has two main parameters - hue
and saturation.
Hue is measured in degrees: 0 and 360°
correspond to the color red, and the
countdown starts from there.
Saturation refers to the apparent
brightness, or intensity, of a color.
458.
Color circleIt is more convenient to describe the
features of the color wheel using a circle
divided into six equal segments.
This approach is associated with the RGB
color model, which is based on three
primary colors - red, green and blue.
459.
Color circleThe colors red, green and blue are called
the primary colors.
Yellow, cyan and magenta complementary or complementary
colors.
460.
Color circle. Peculiarities:● colors located opposite each other are contrasting;
● when adding any shade to an image, the level of its
contrasting color is automatically reduced.
461.
Color circle. Peculiarities:● any color can be obtained by mixing colors close to it.
● decreasing or adding a shade of any color leads to a
decrease or increase in the level of colors that are next to it.
462.
A moment of Photoshop463.
Color modelsRGB (Red, Green, Blue - red, green, blue) additive color model.
CMYK: Cyan, Magenta, Yellow, Key color subtractive color scheme.
464.
A moment of PhotoshopAdobe Photoshop Settings
465.
A moment of PhotoshopHow to Improve an Image Using Levels
466.
A moment of PhotoshopHow to Improve Color in an Image Using Vibrance
467.
A moment of PhotoshopHow to change one color in an image
468.
A moment of PhotoshopHow to change certain colors
469.
A moment of PhotoshopHow to make an image black and white
470.
A moment of PhotoshopAdjustment Layers






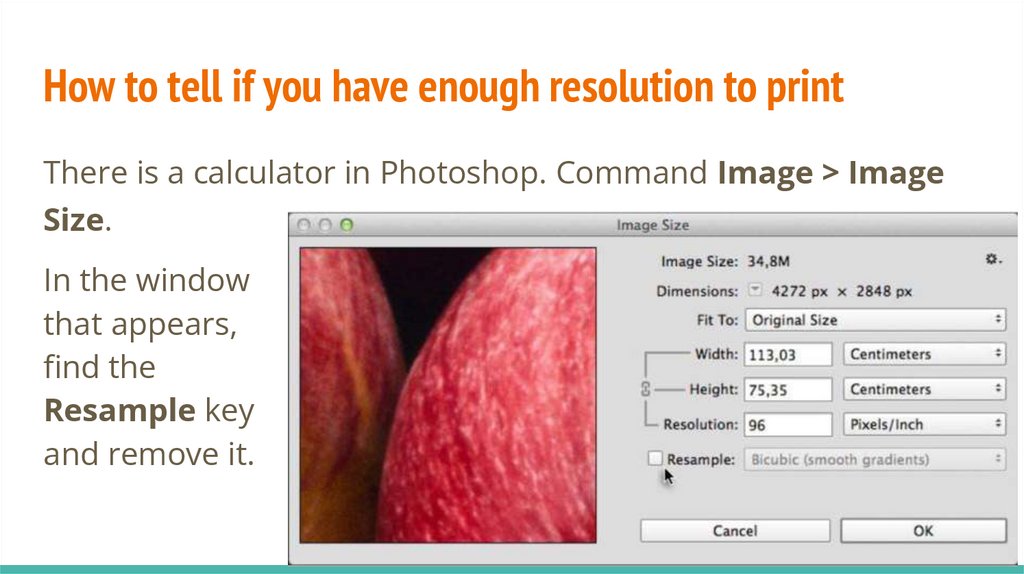
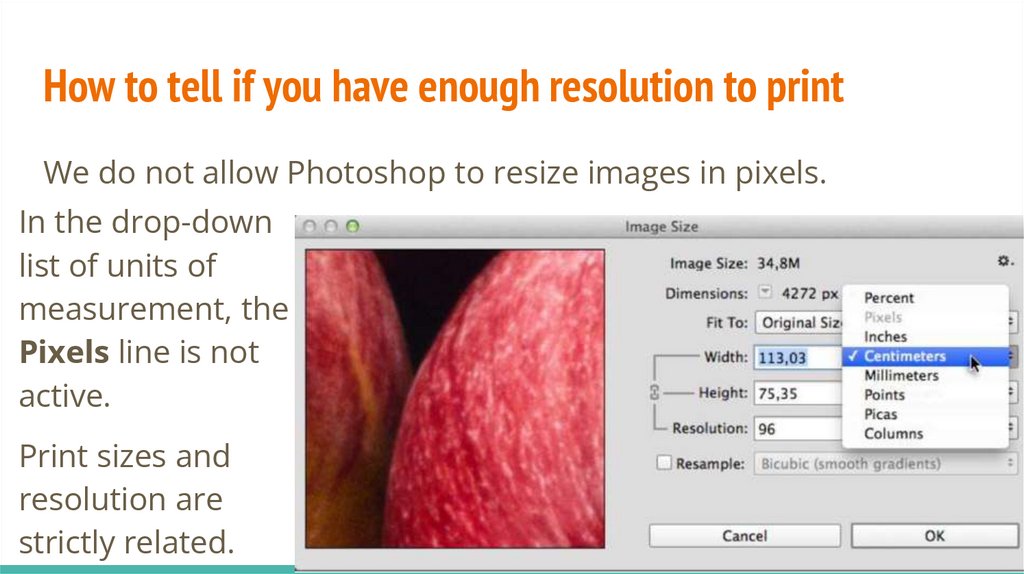
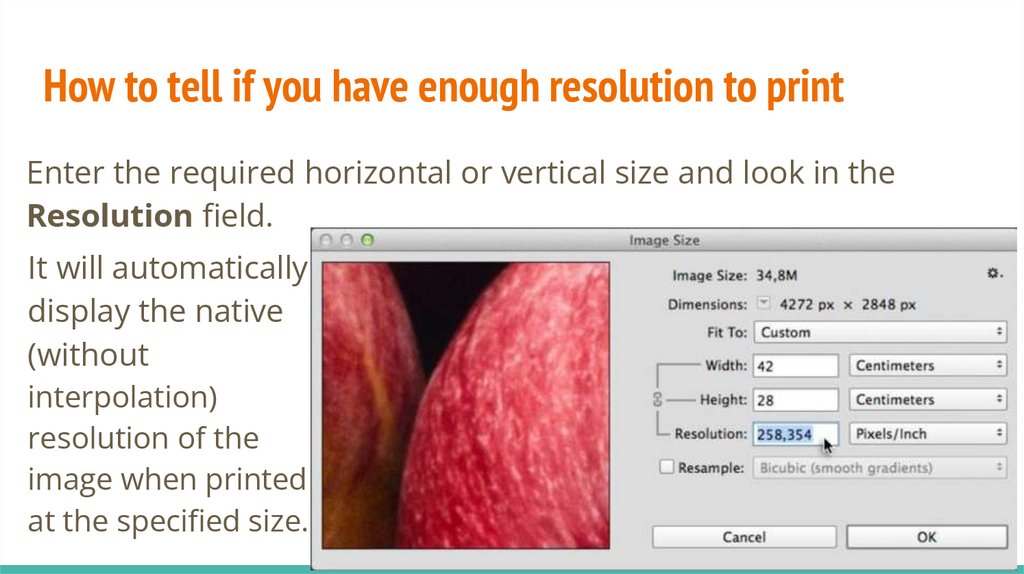
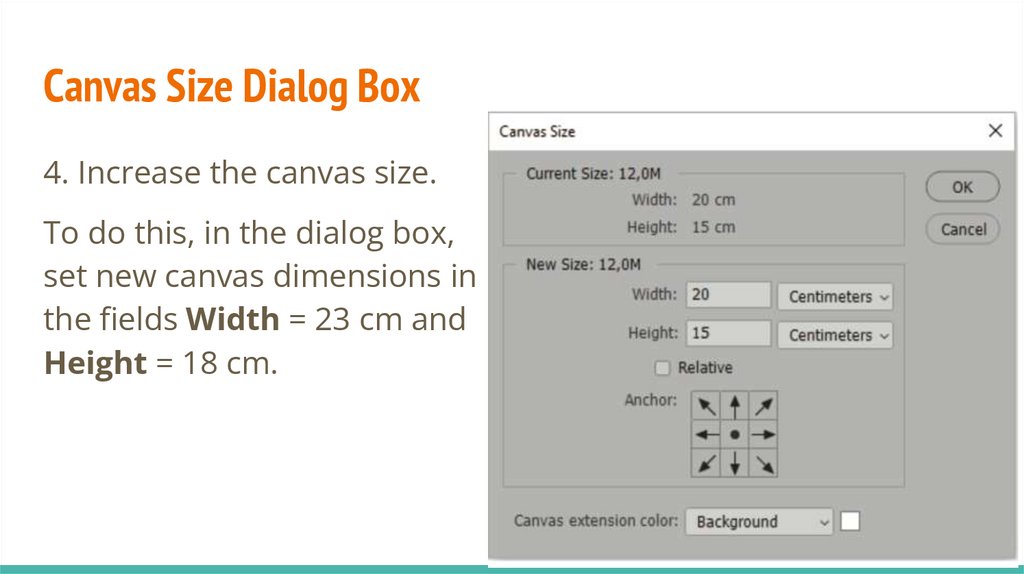
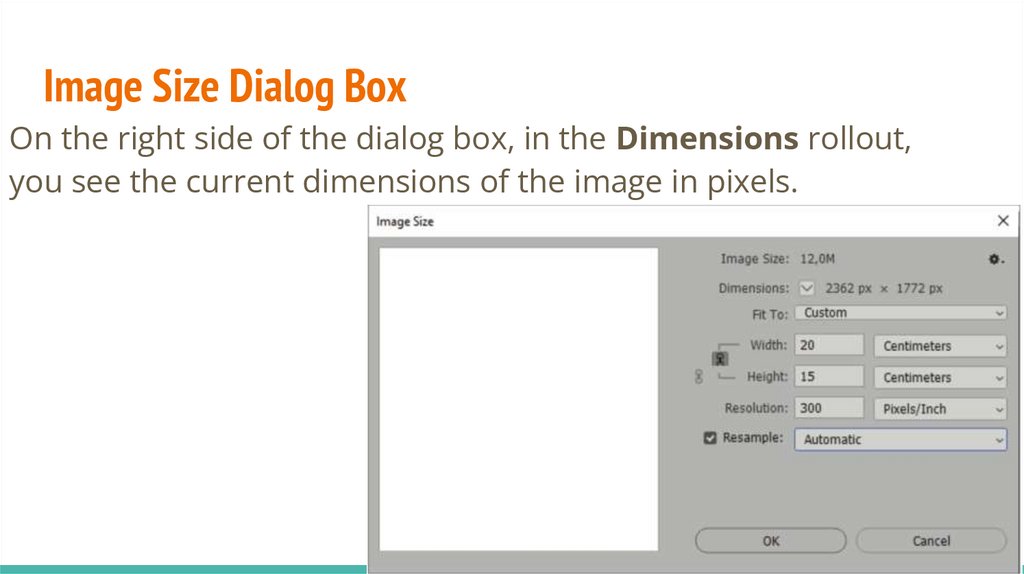
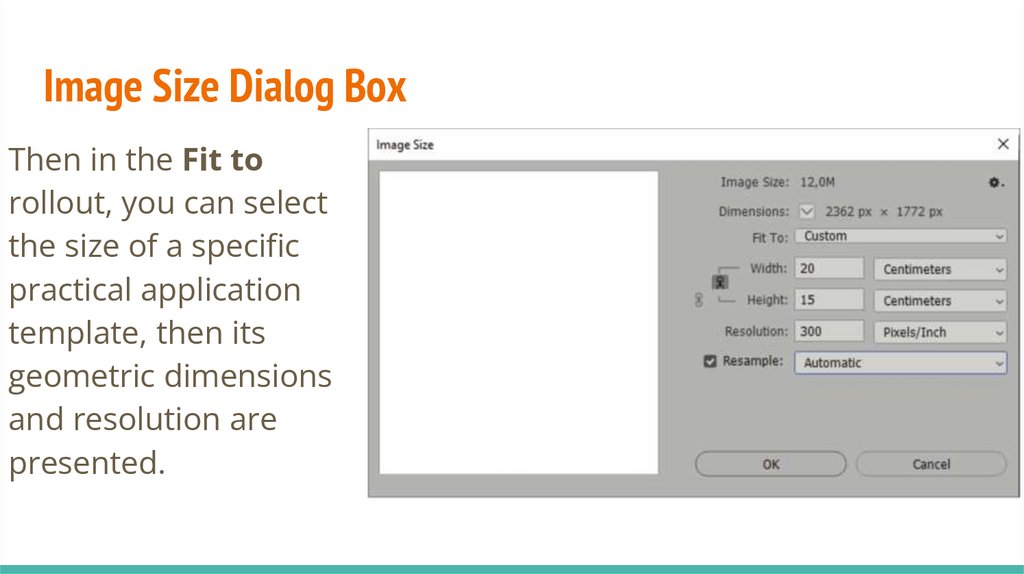
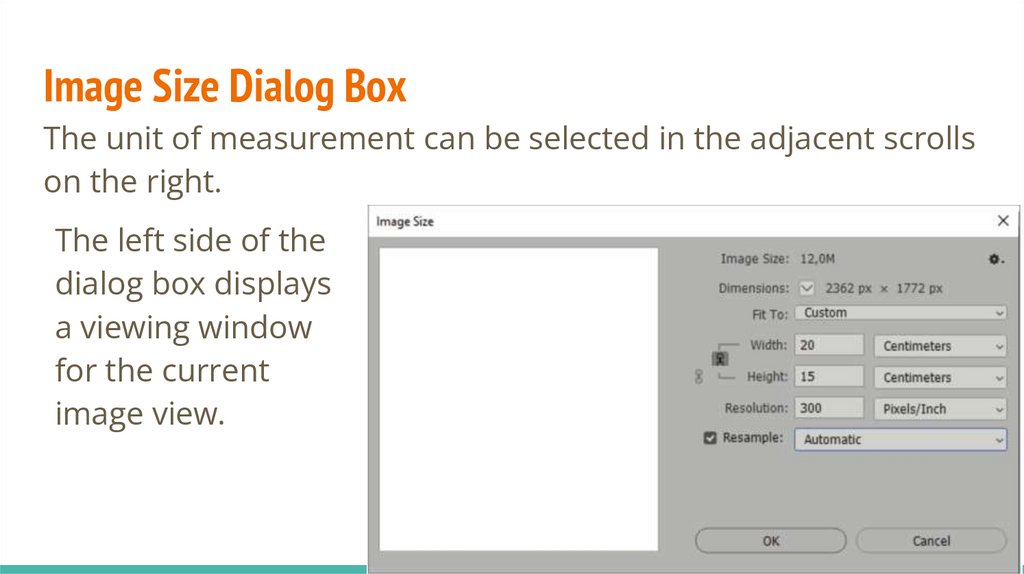


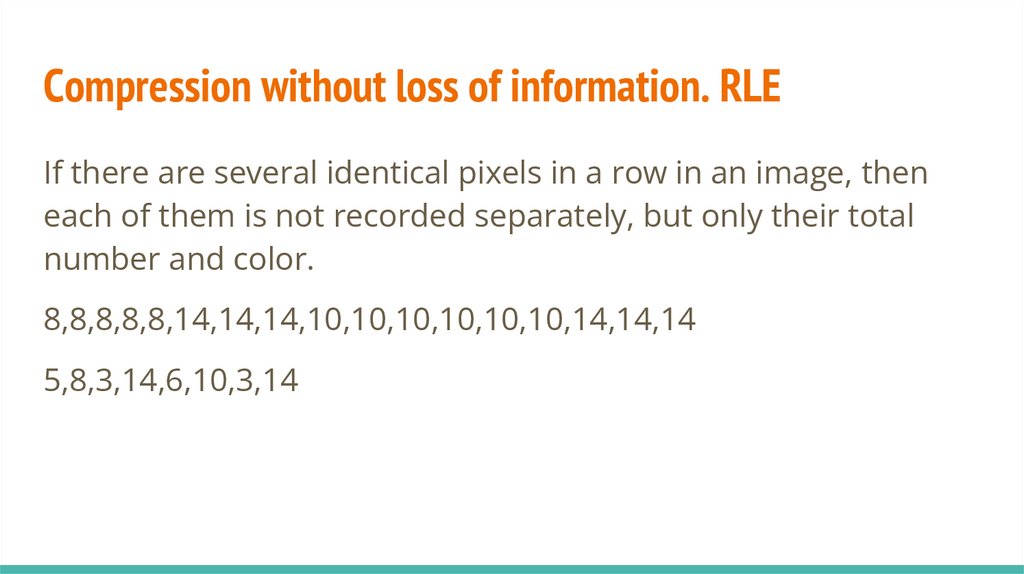
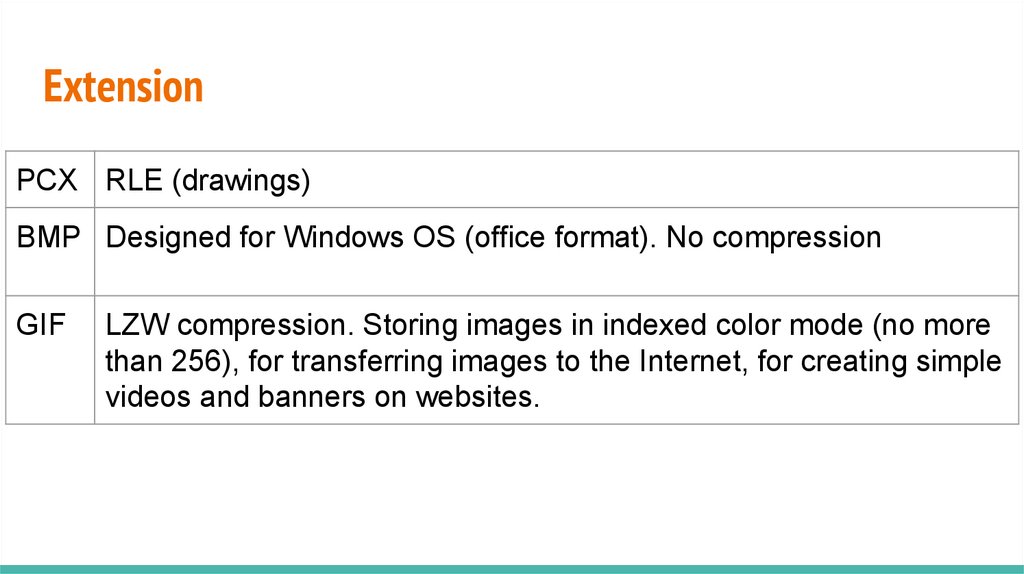
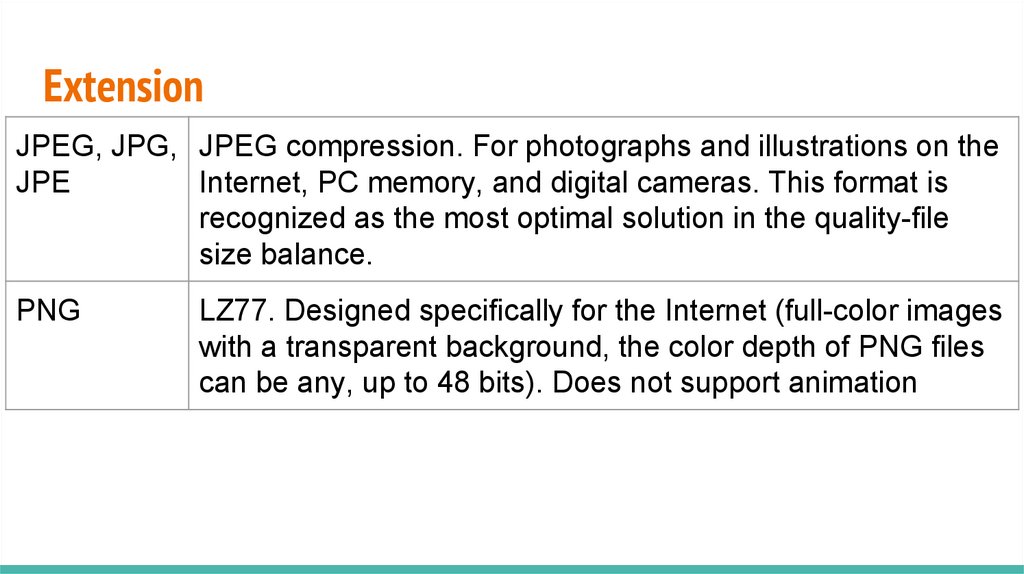
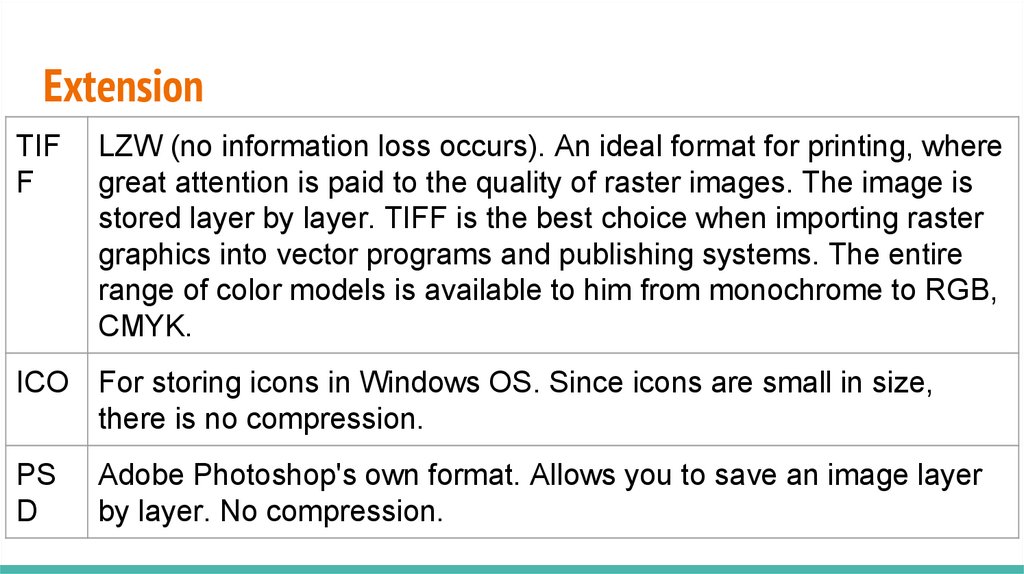

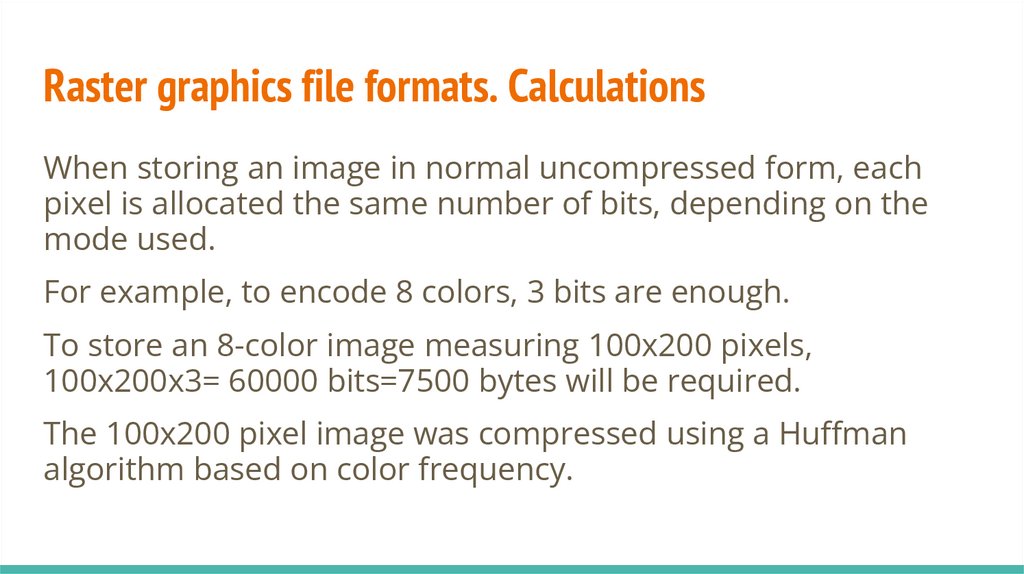
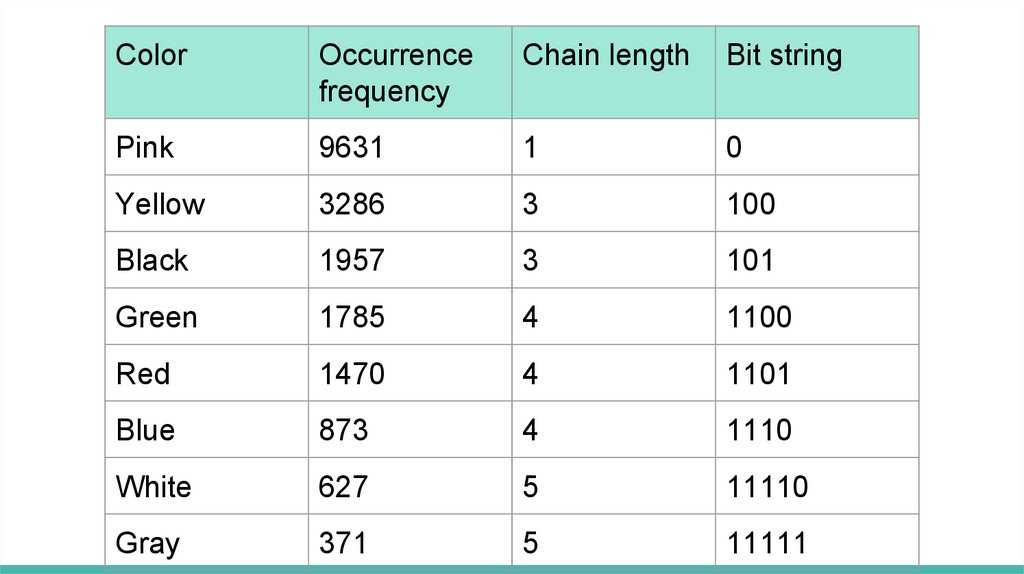
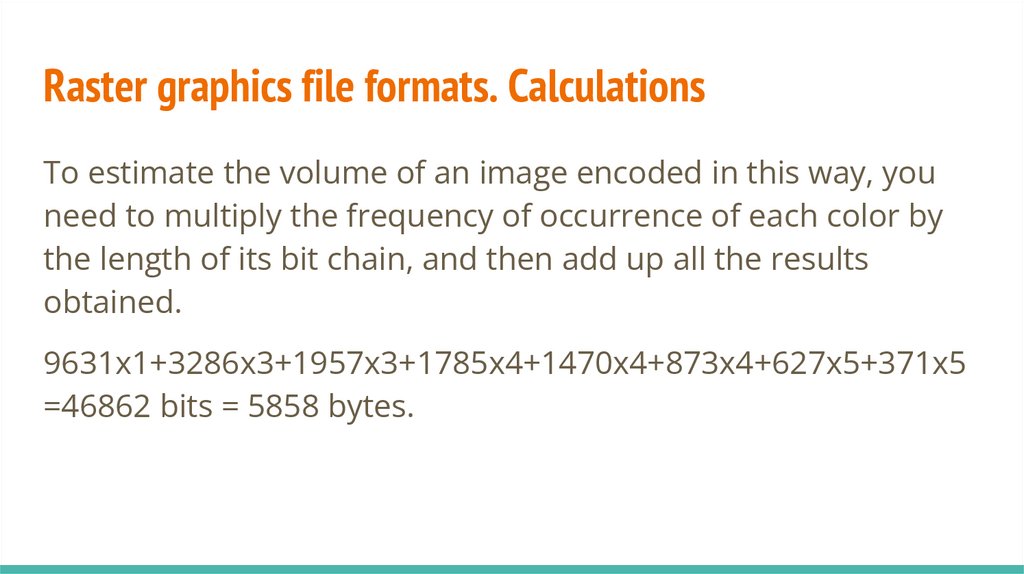
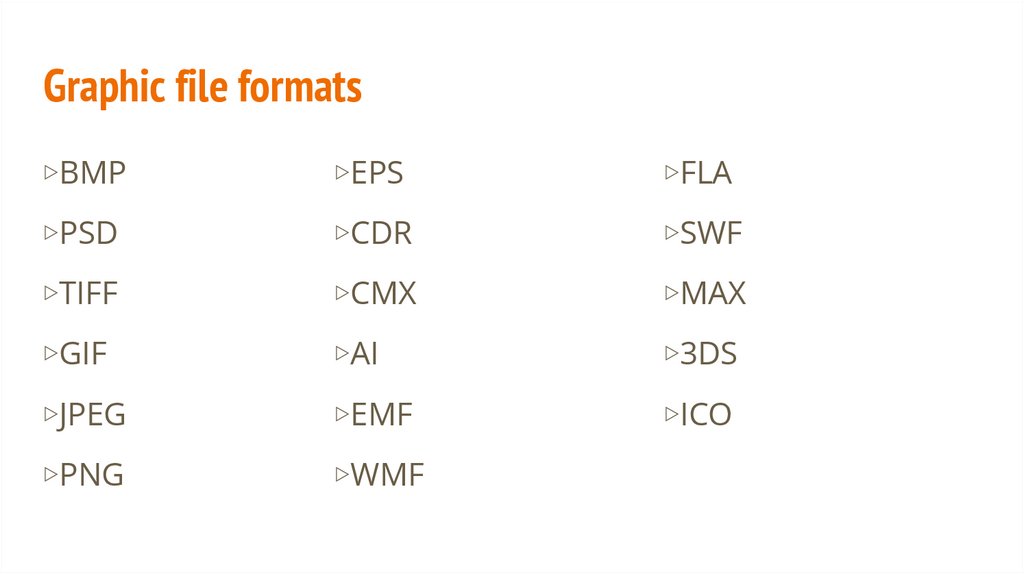

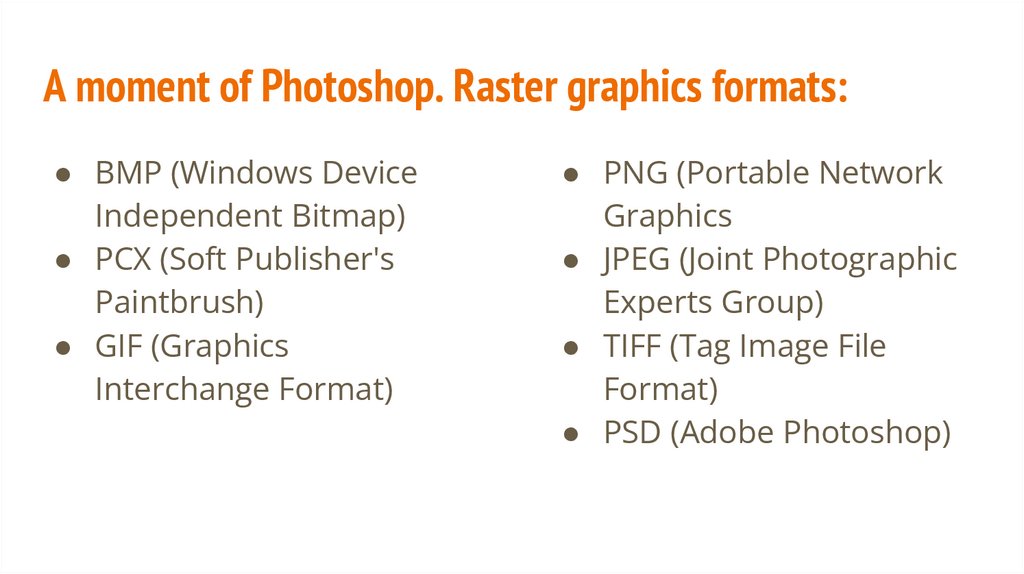

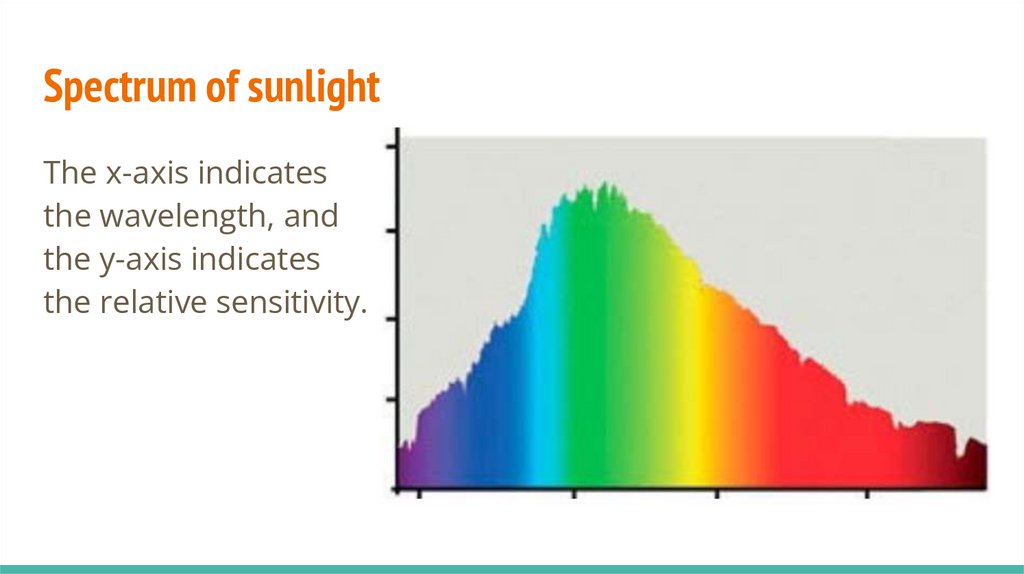



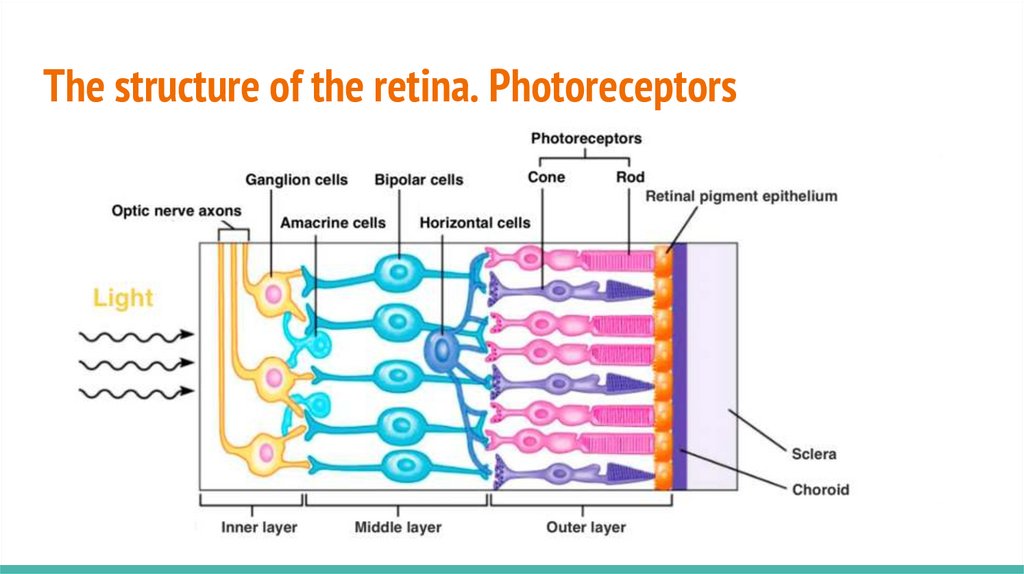

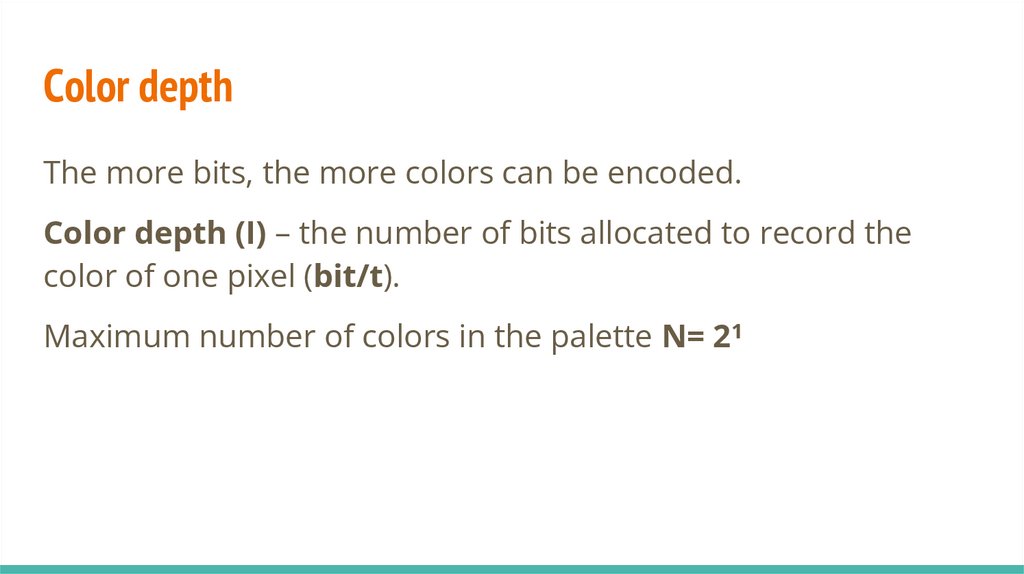
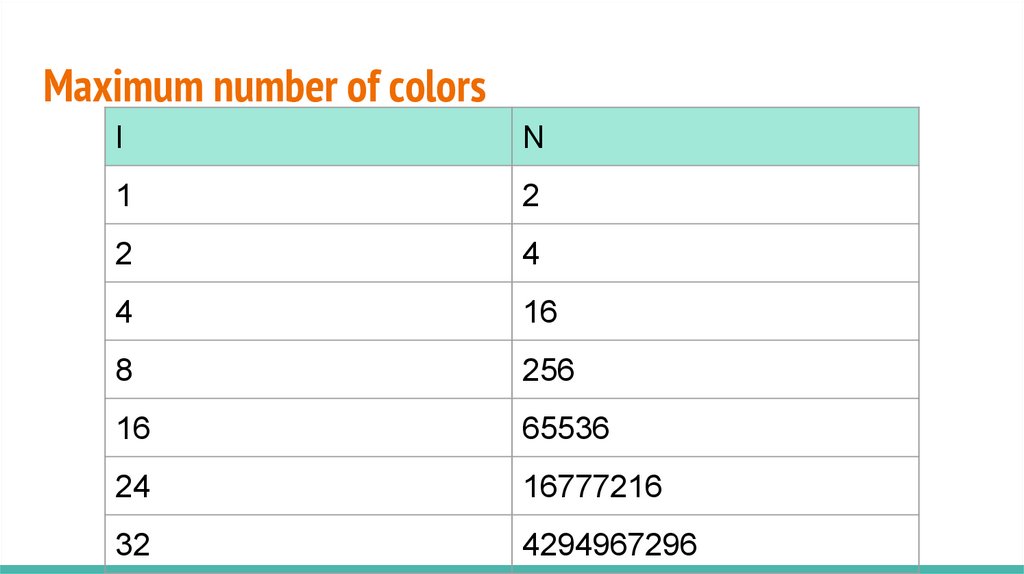
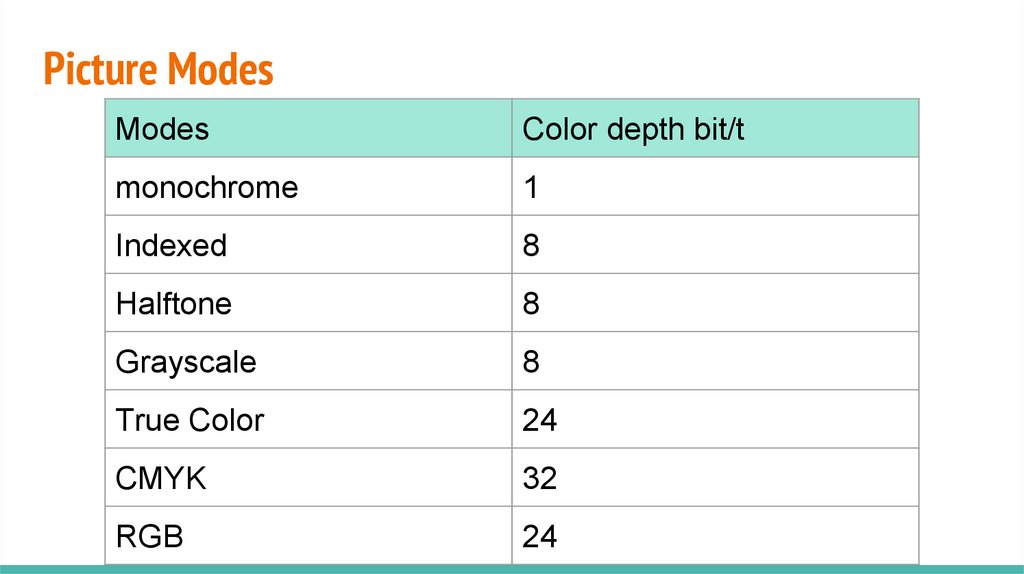

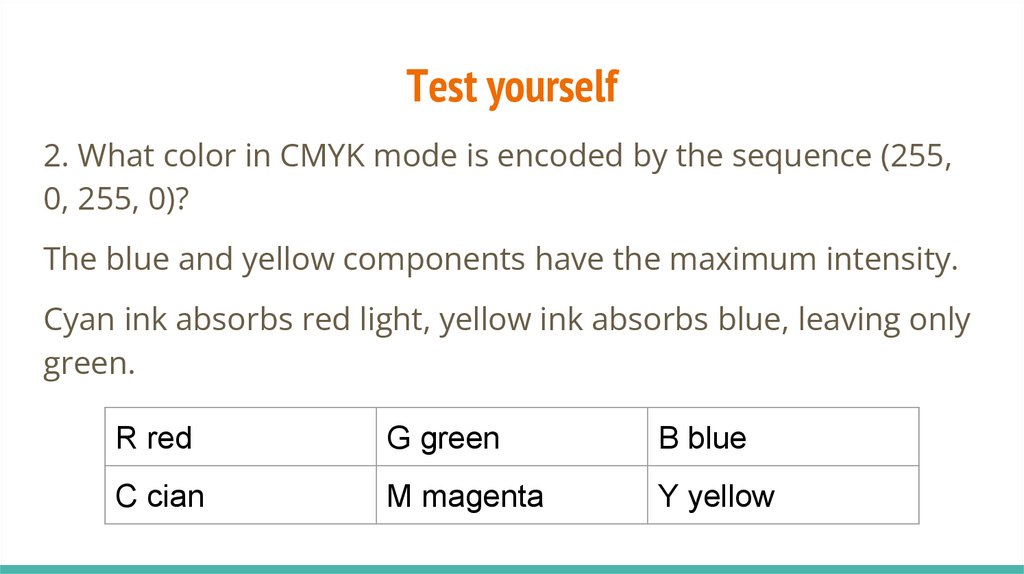
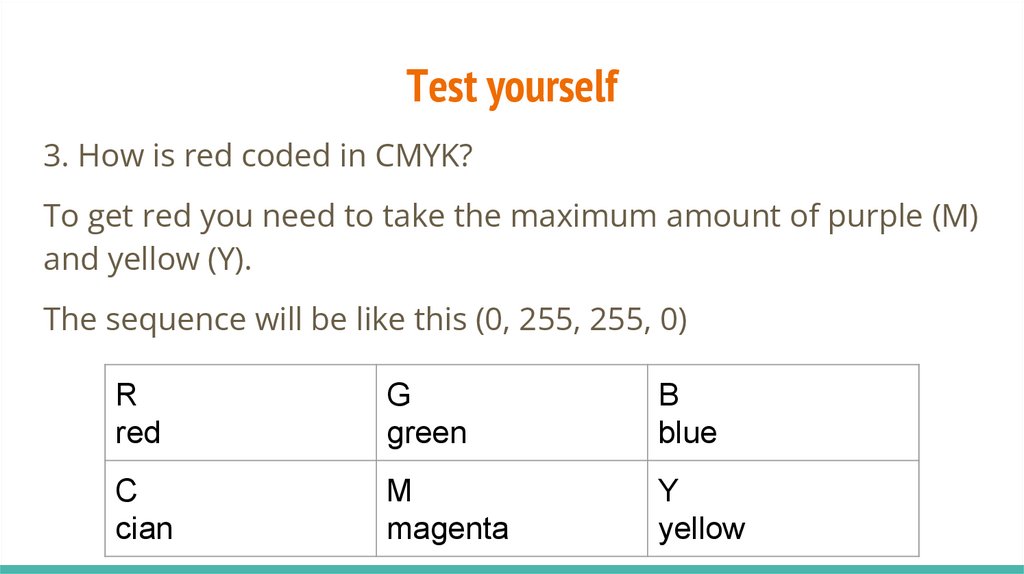

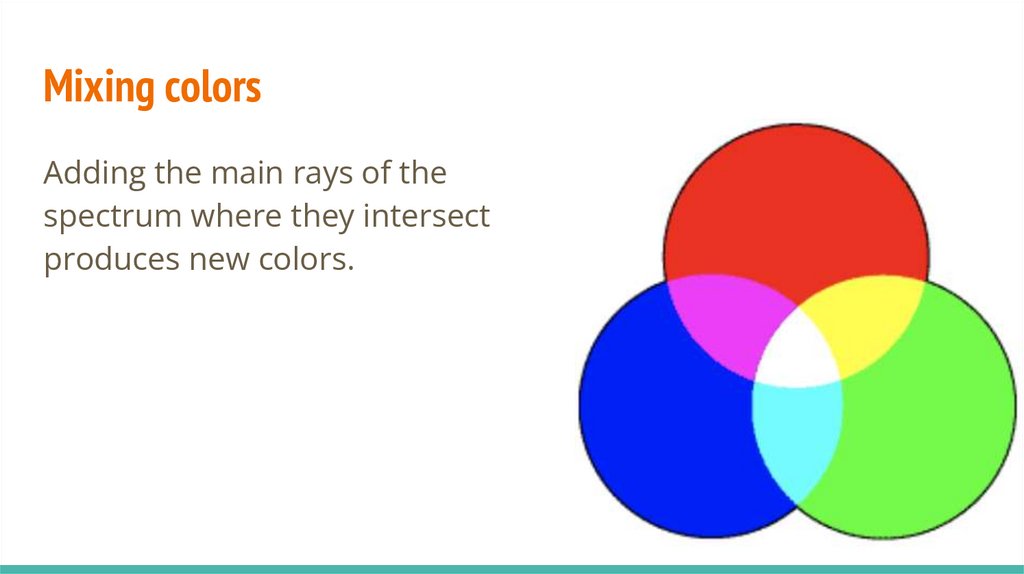
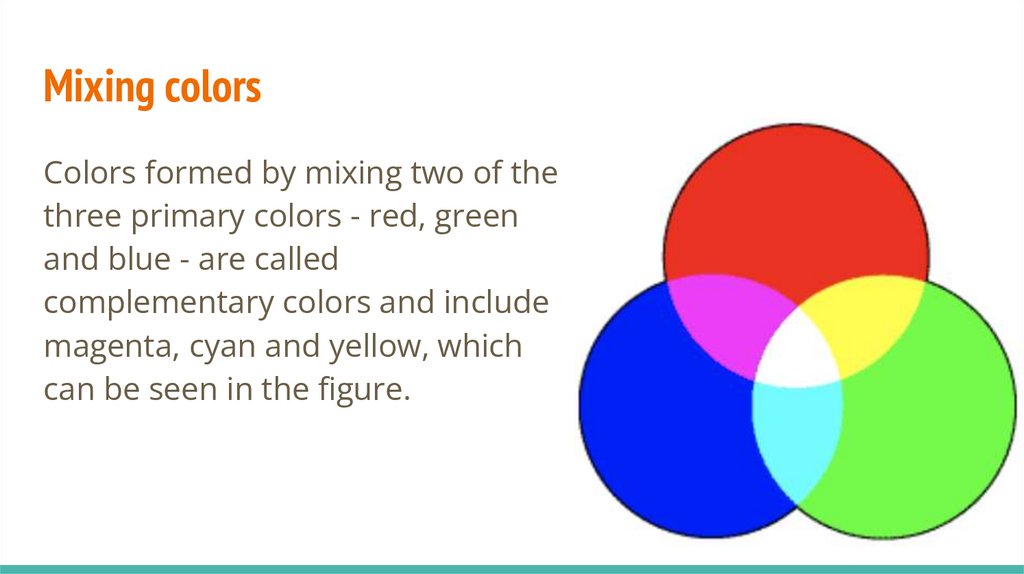
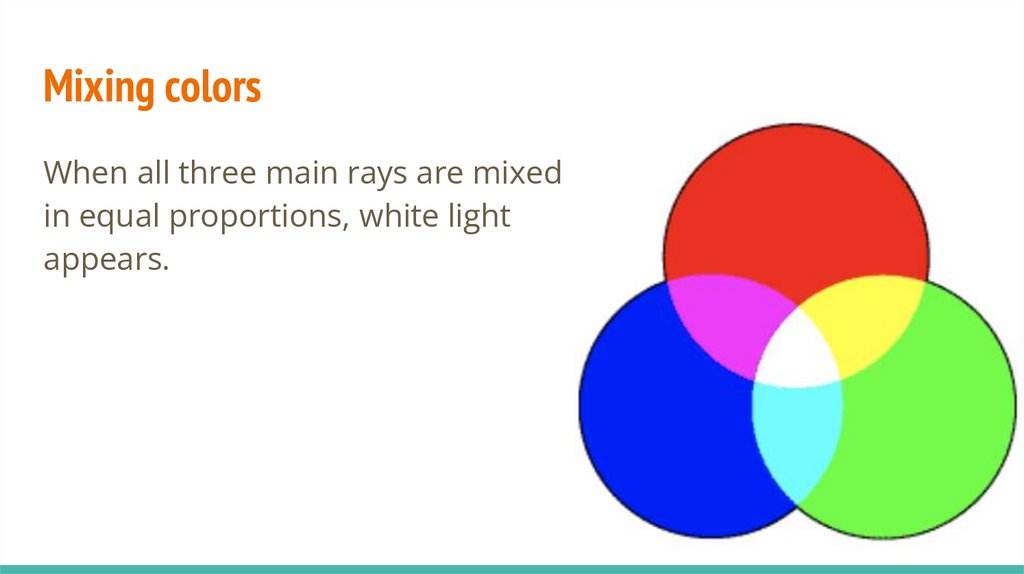
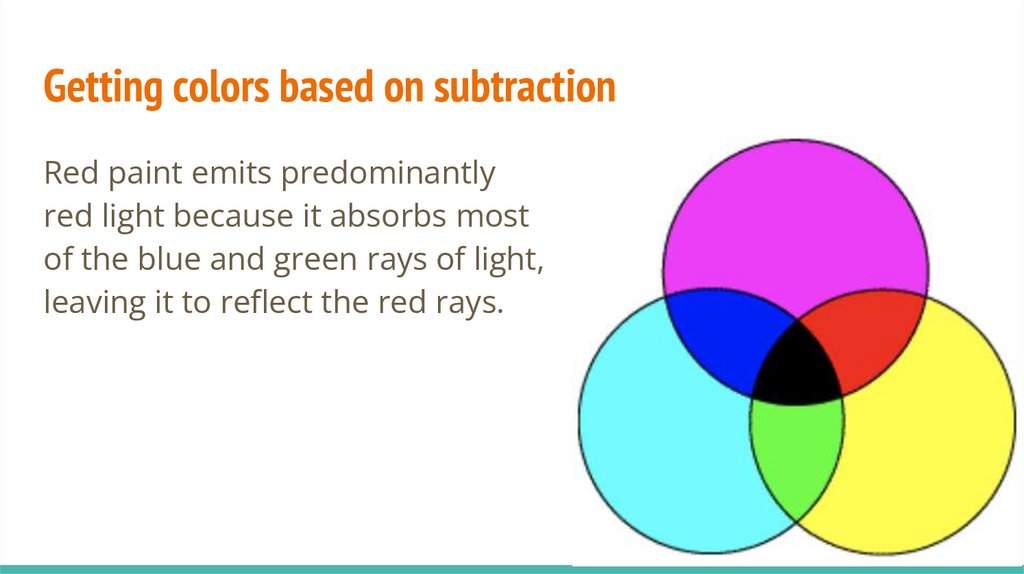
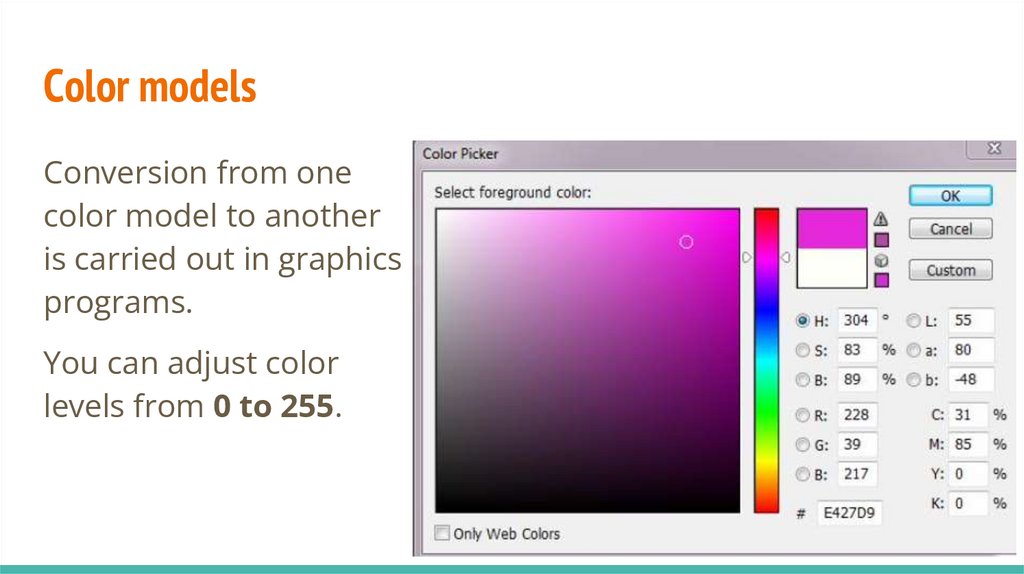
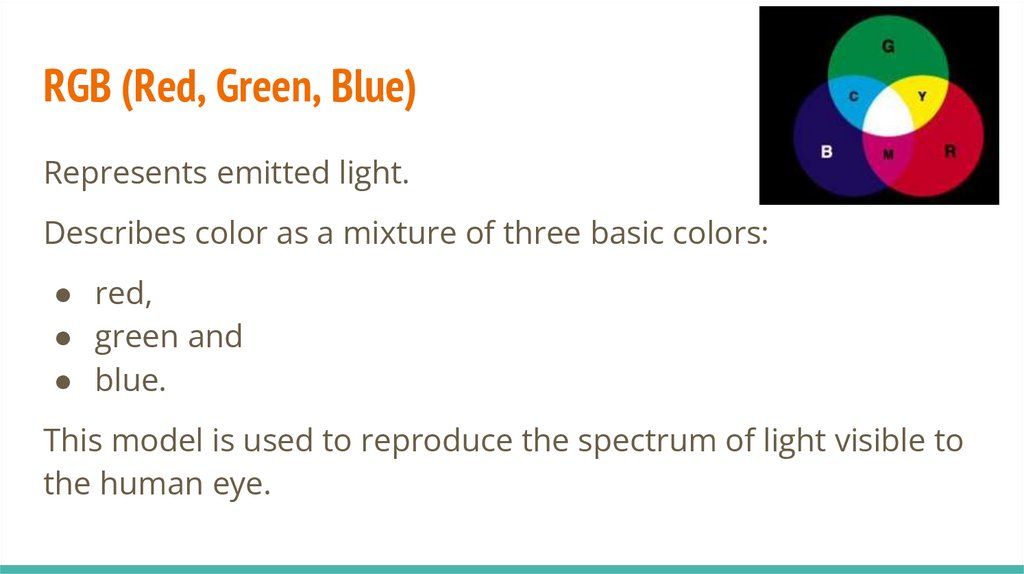
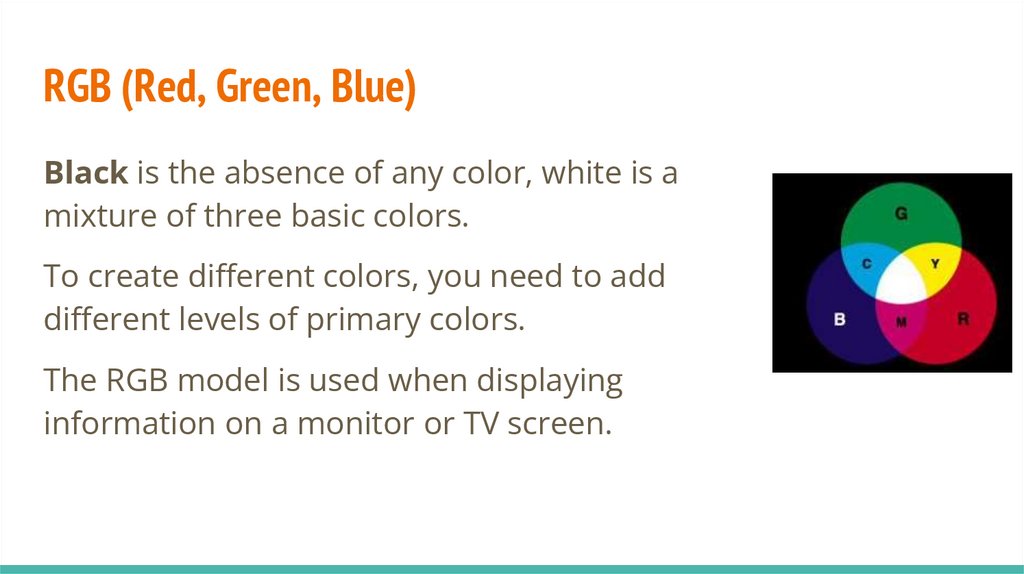
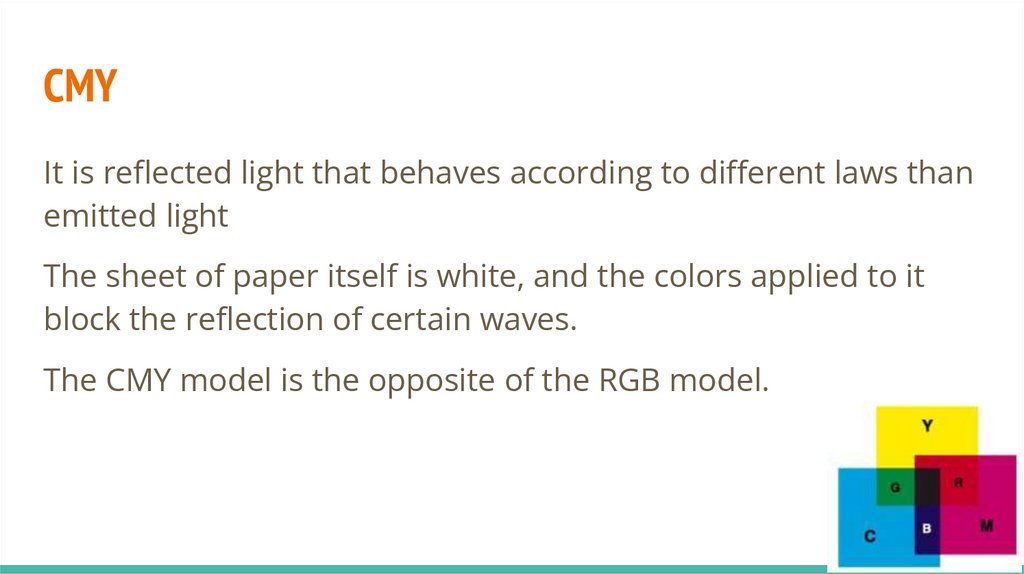
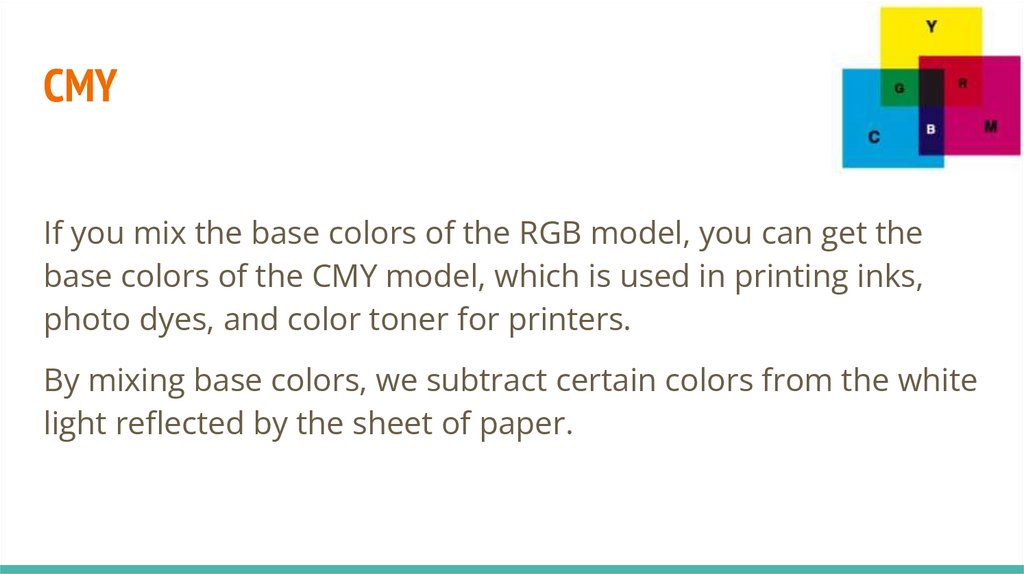
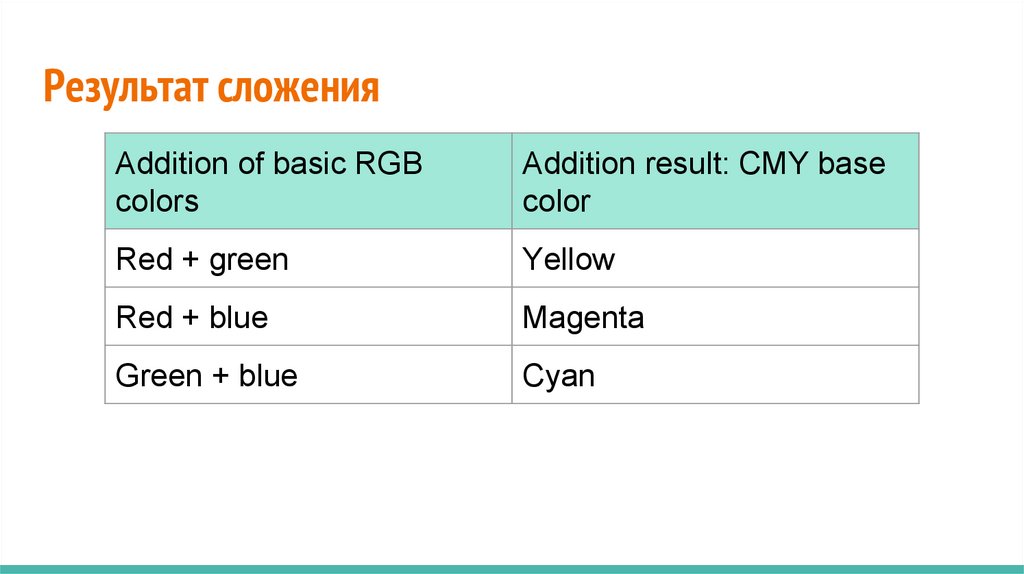
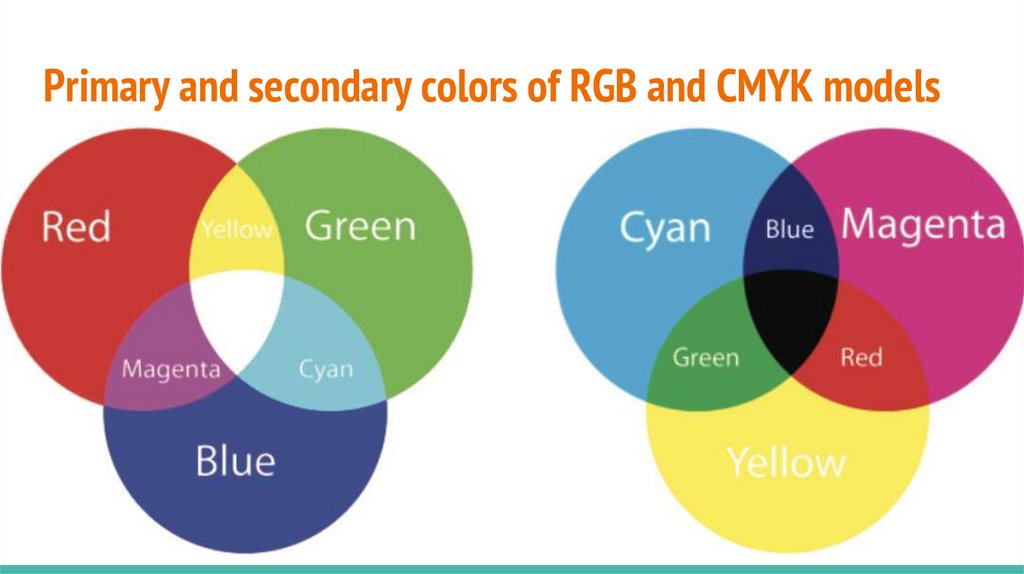
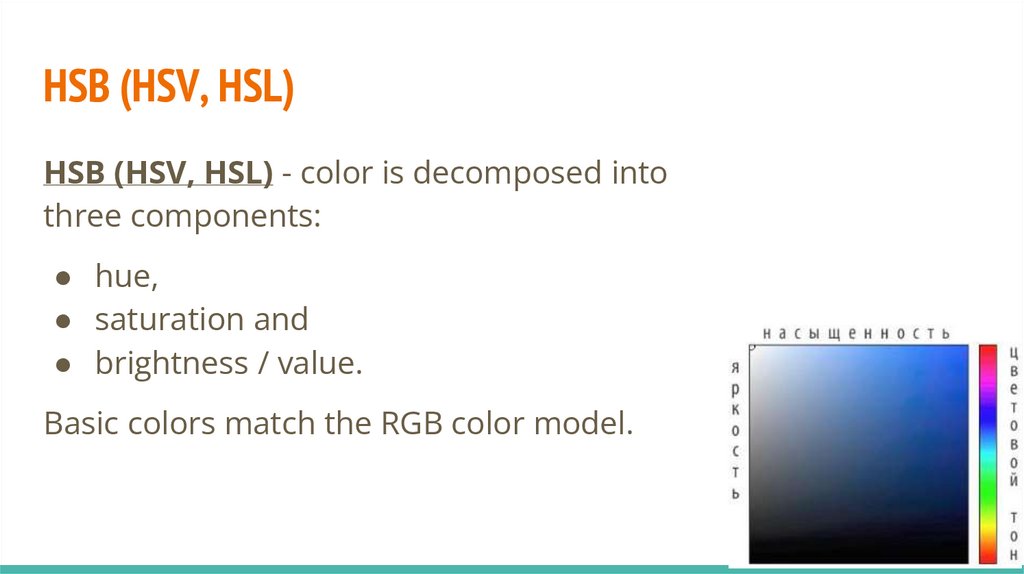
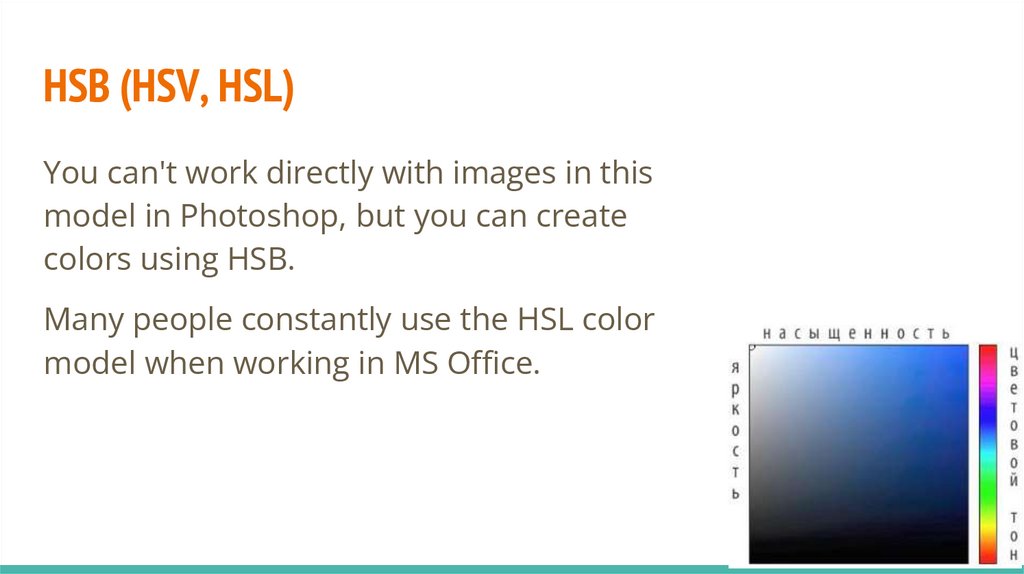


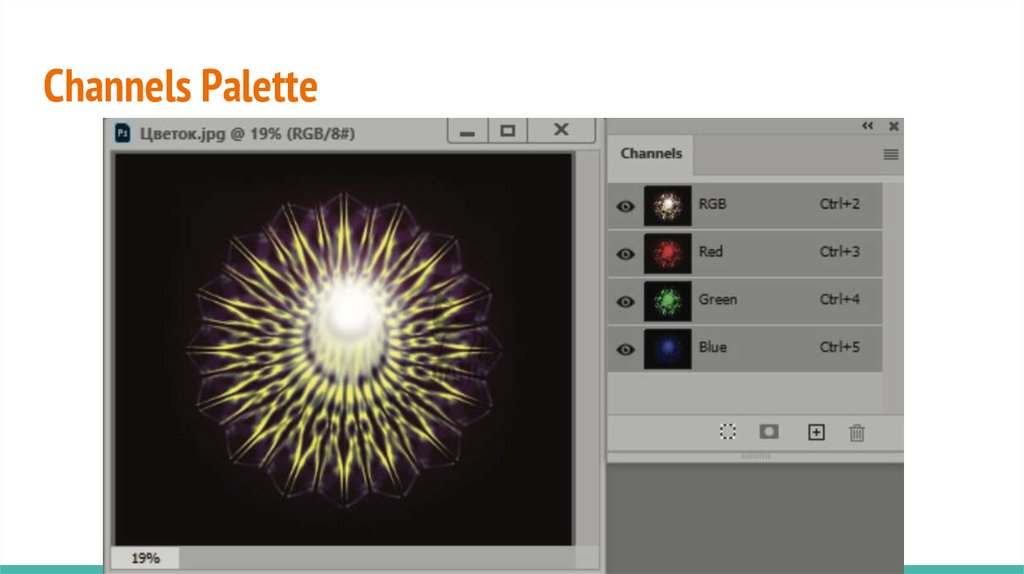


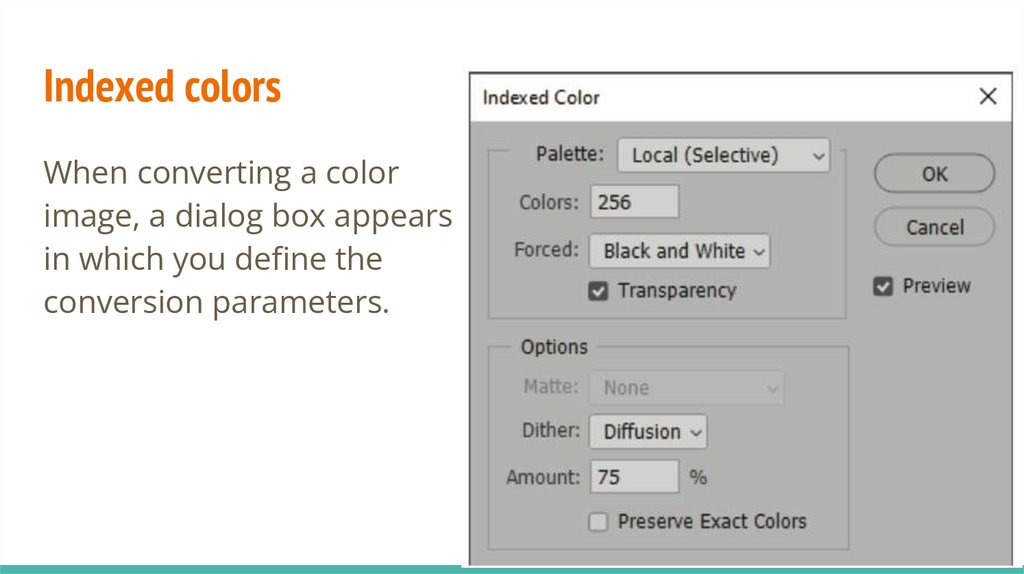

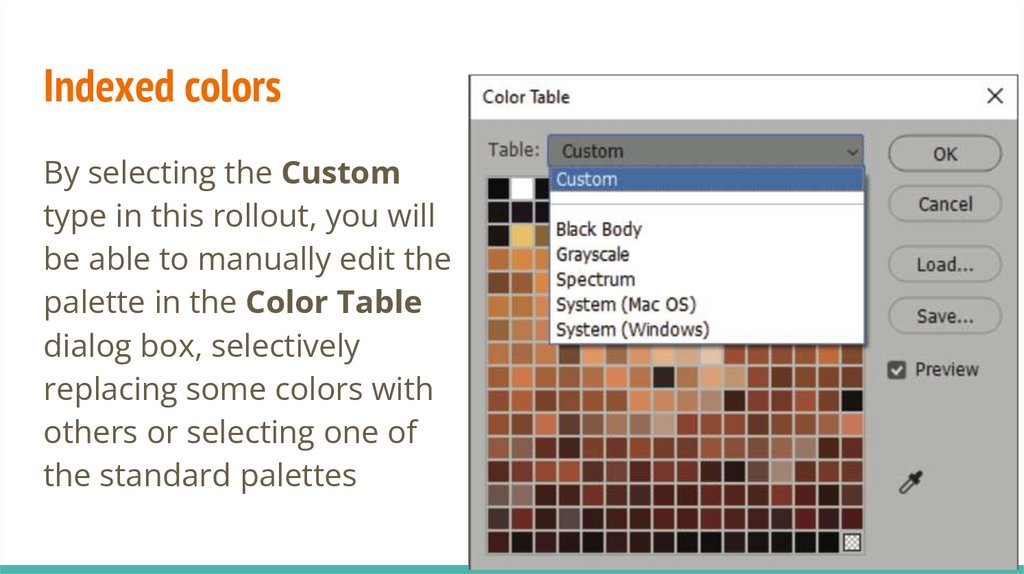
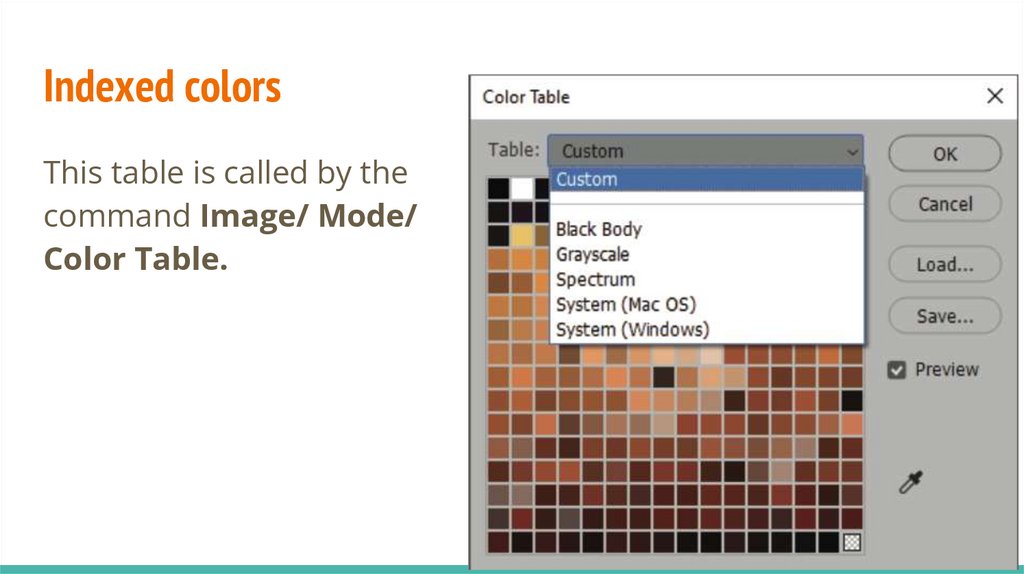

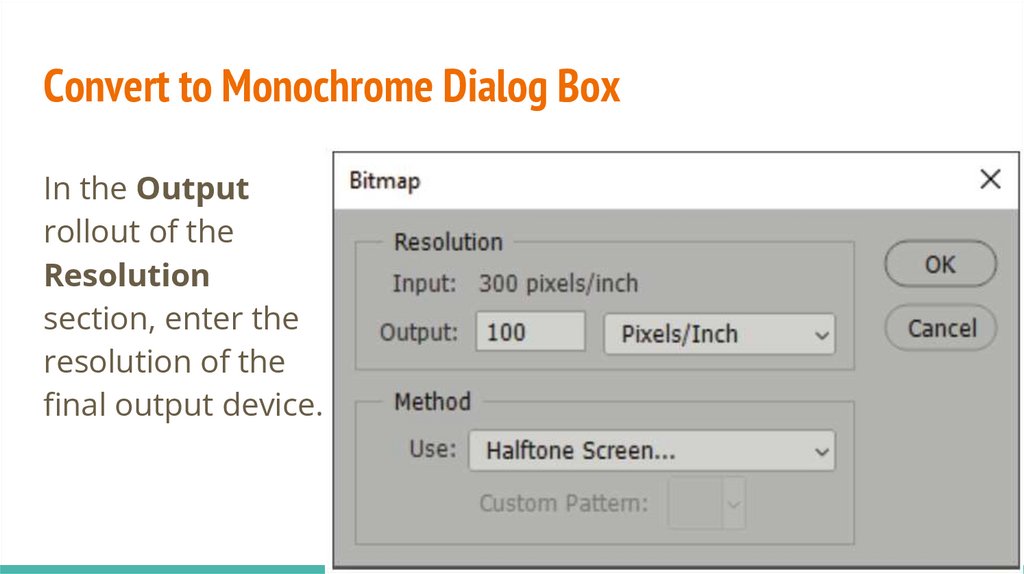



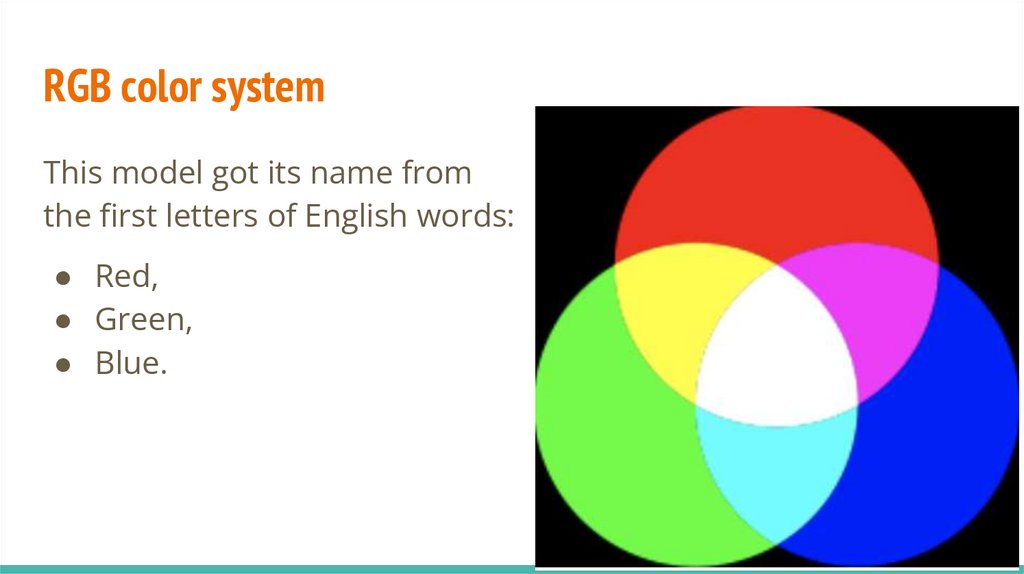
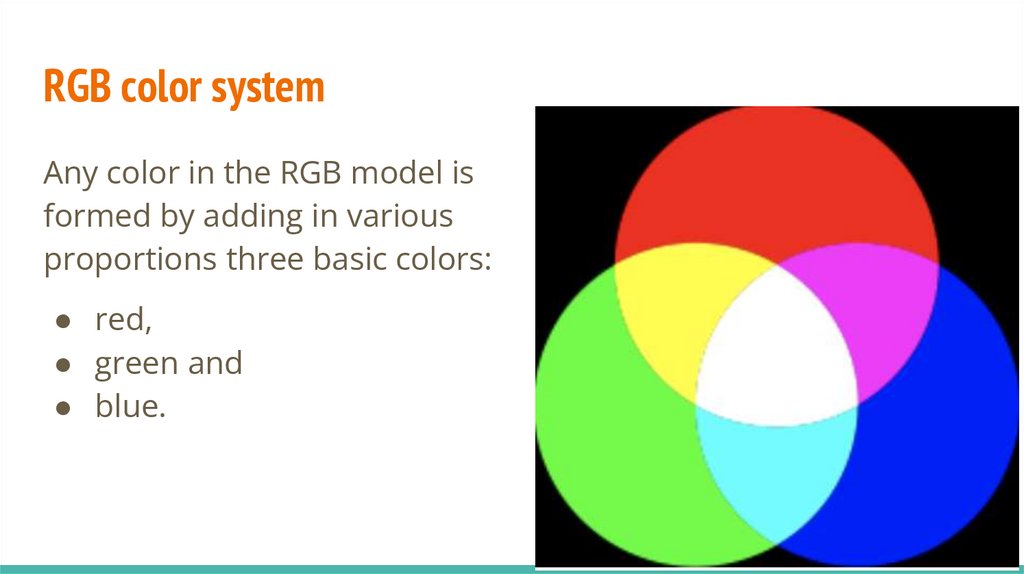
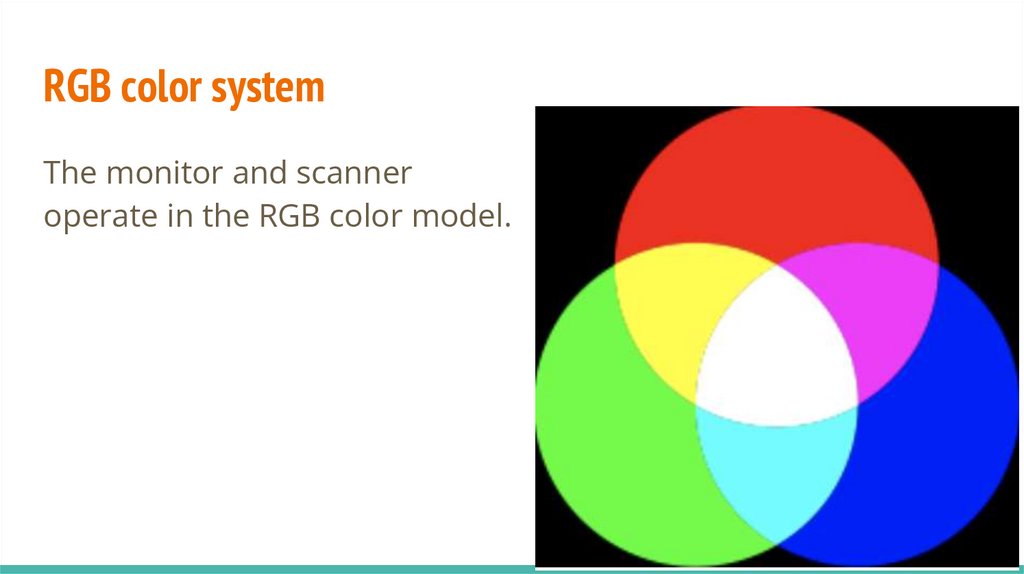
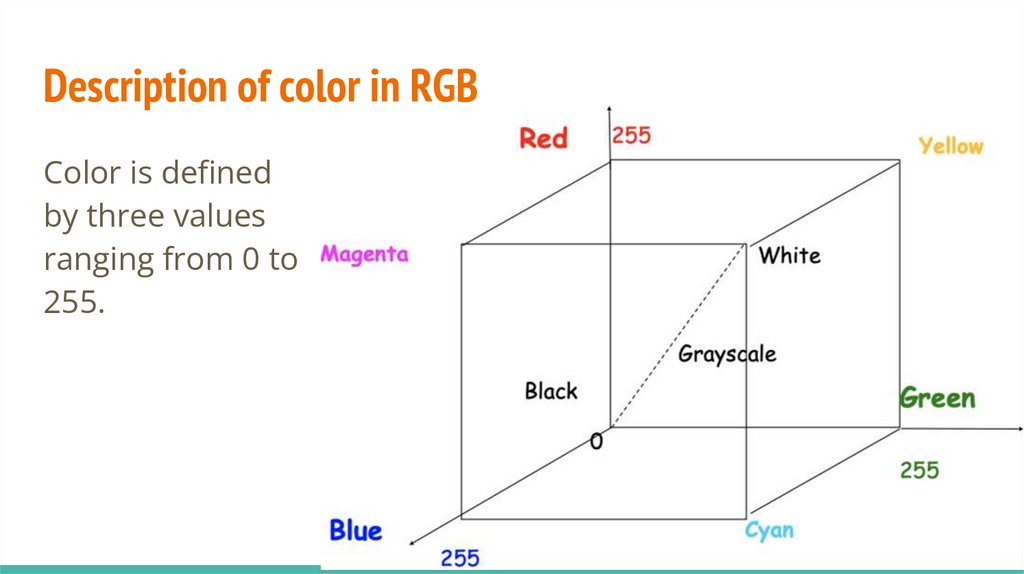
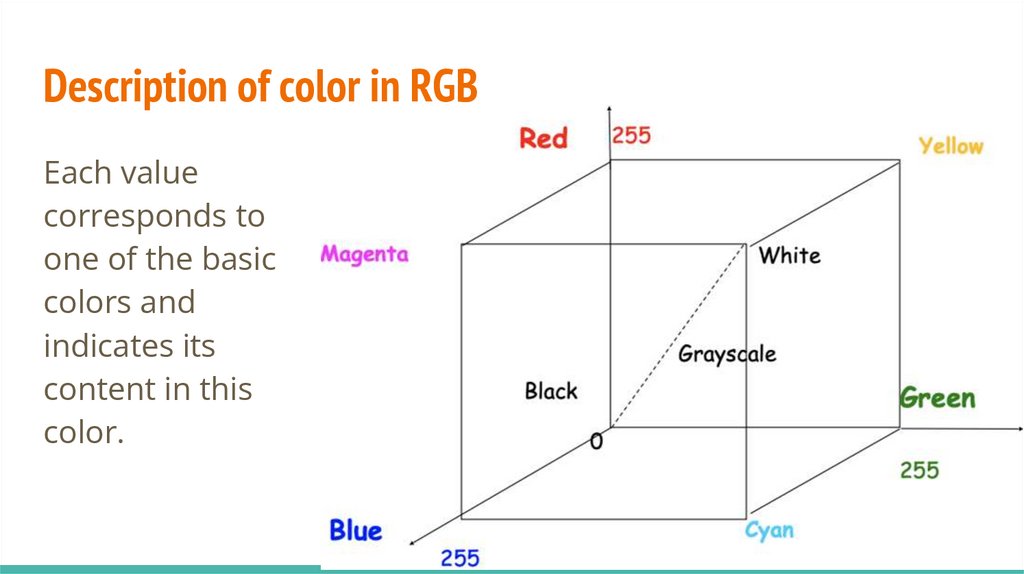
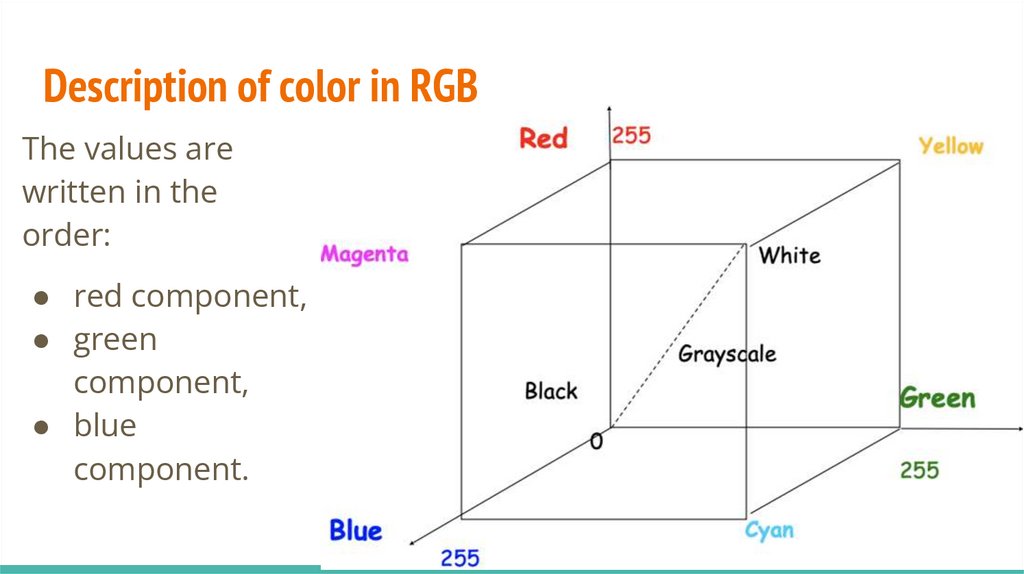
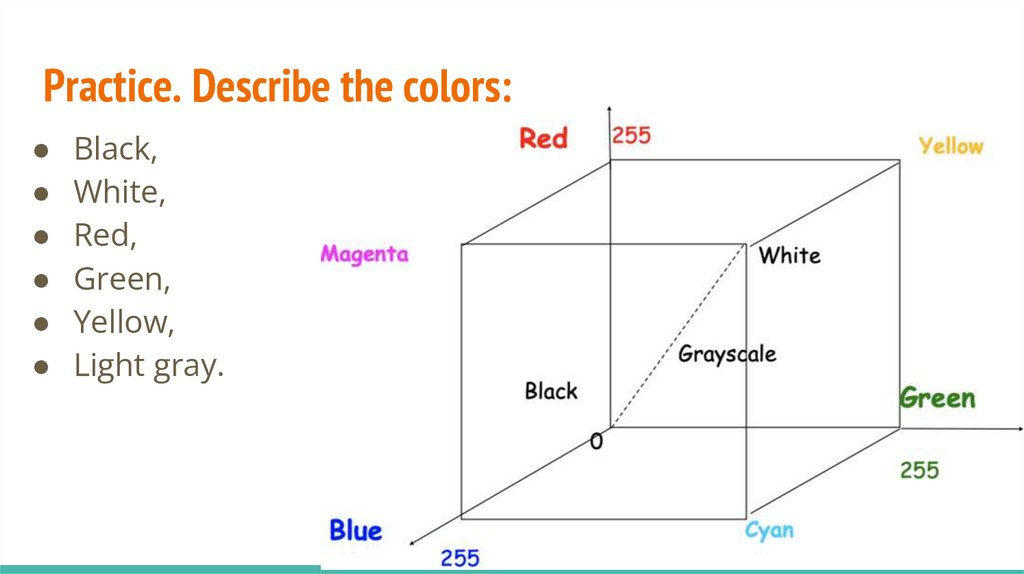
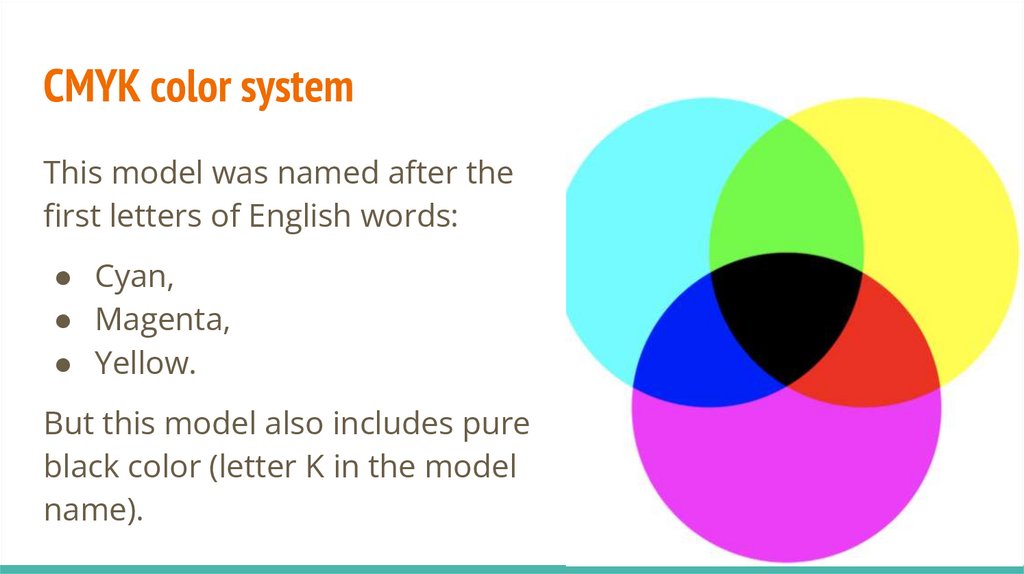
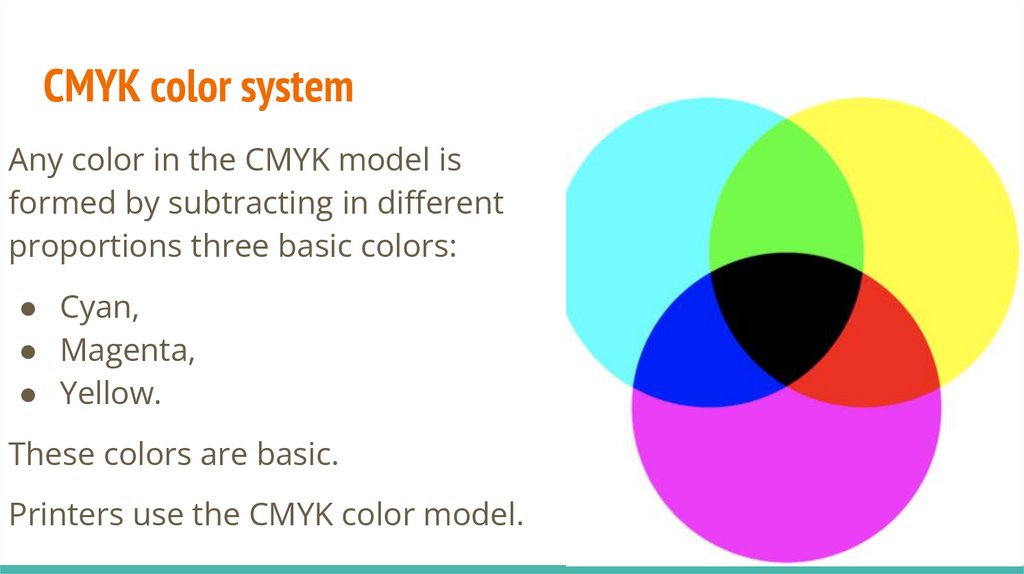
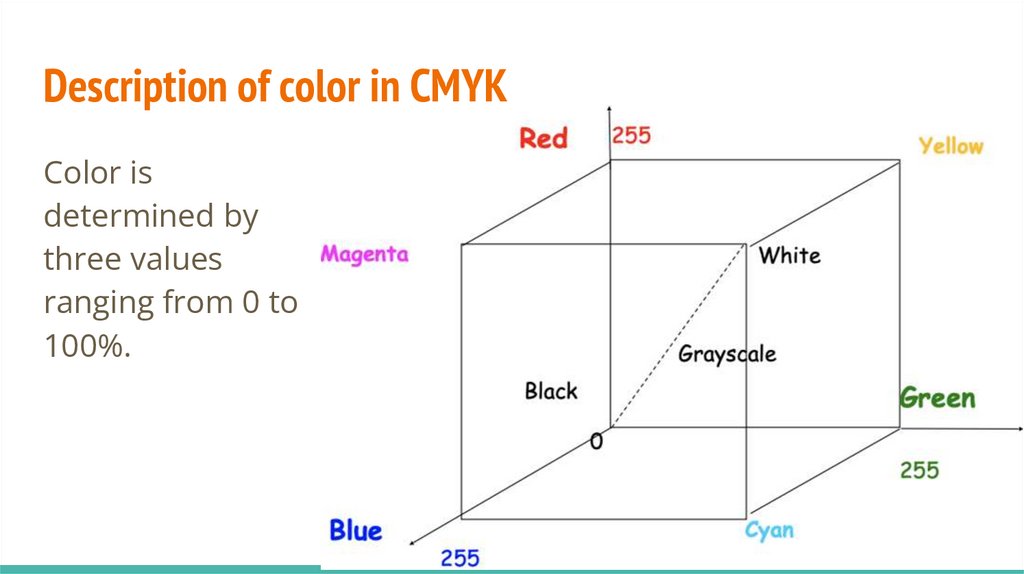
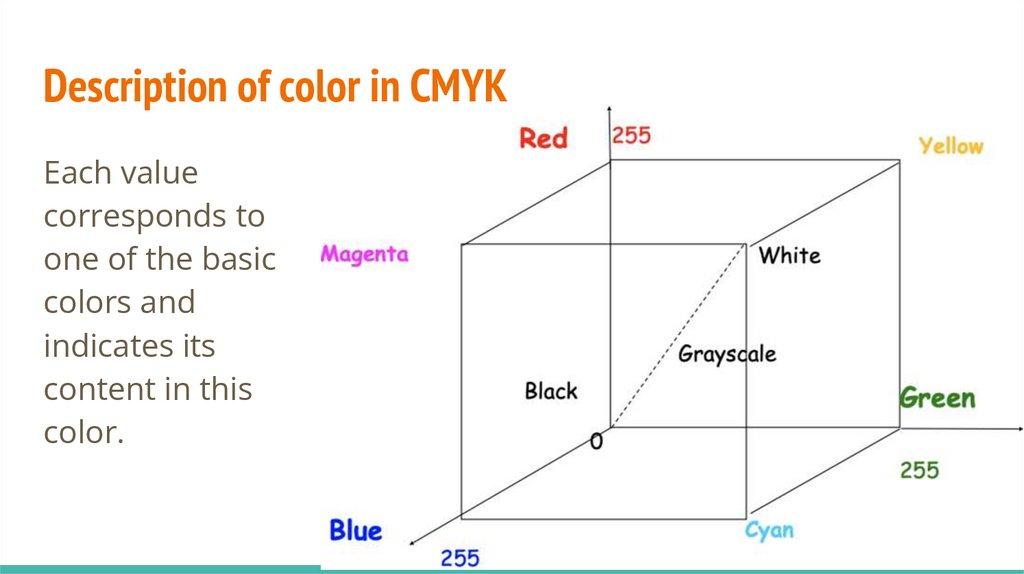
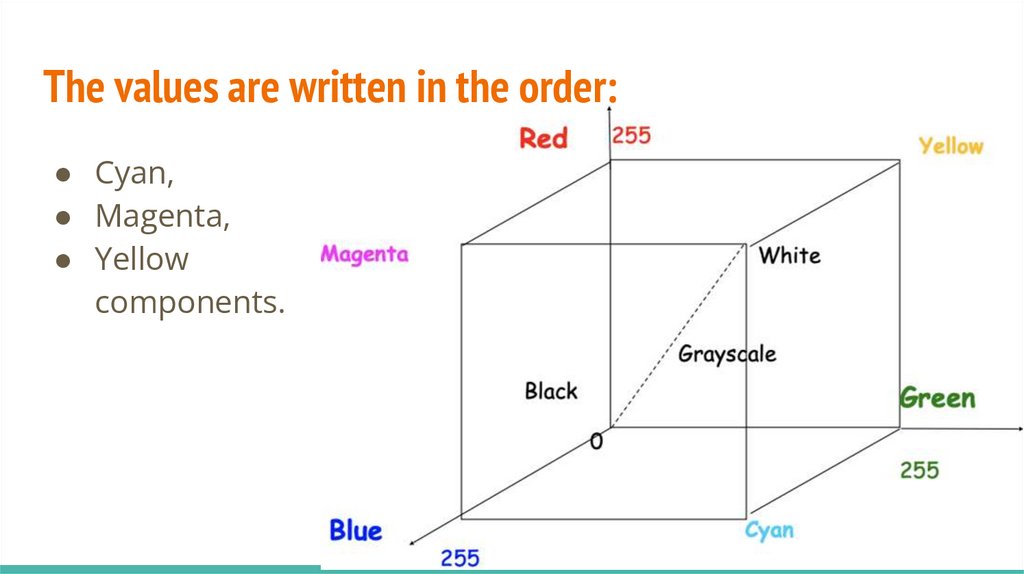
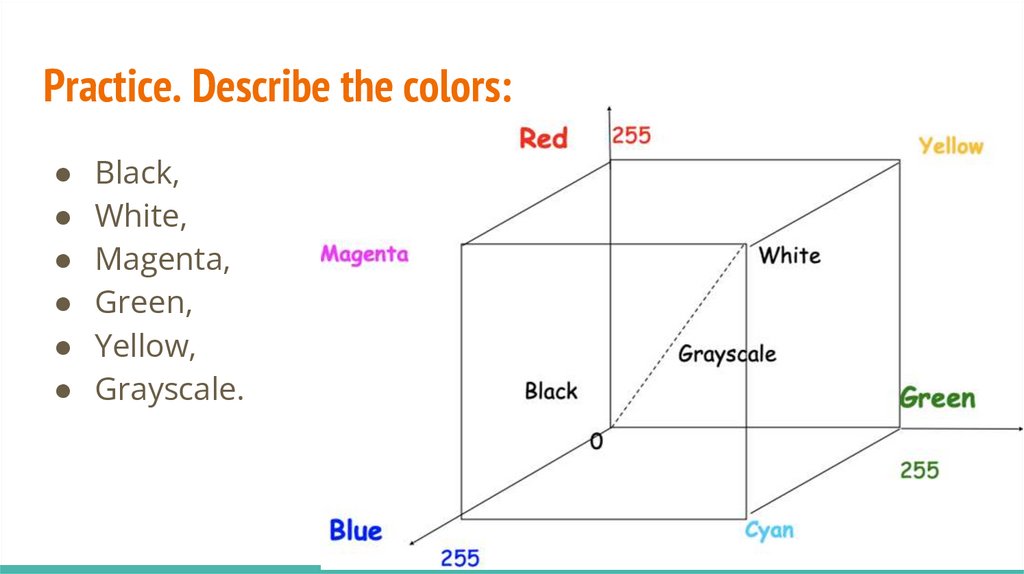

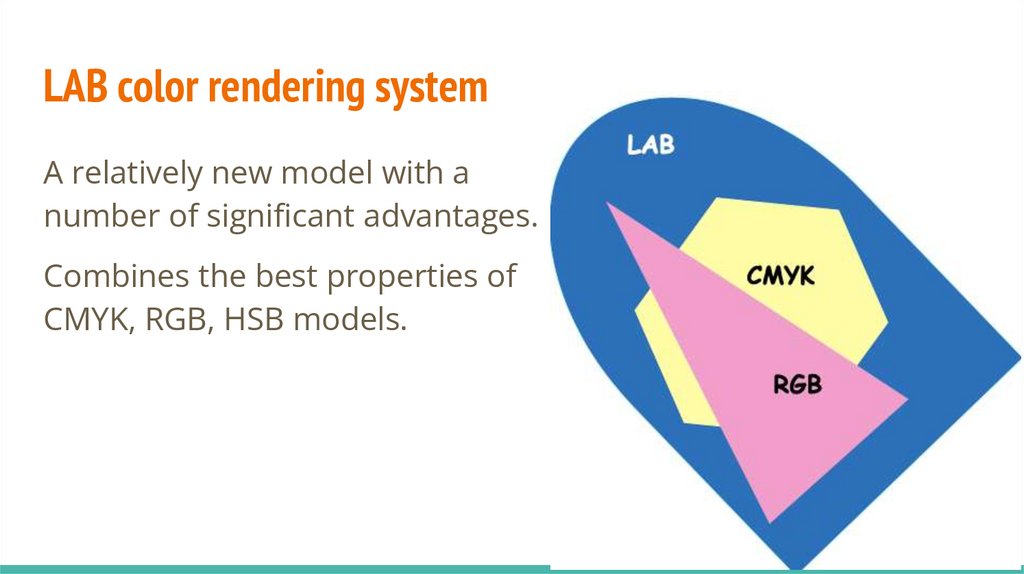
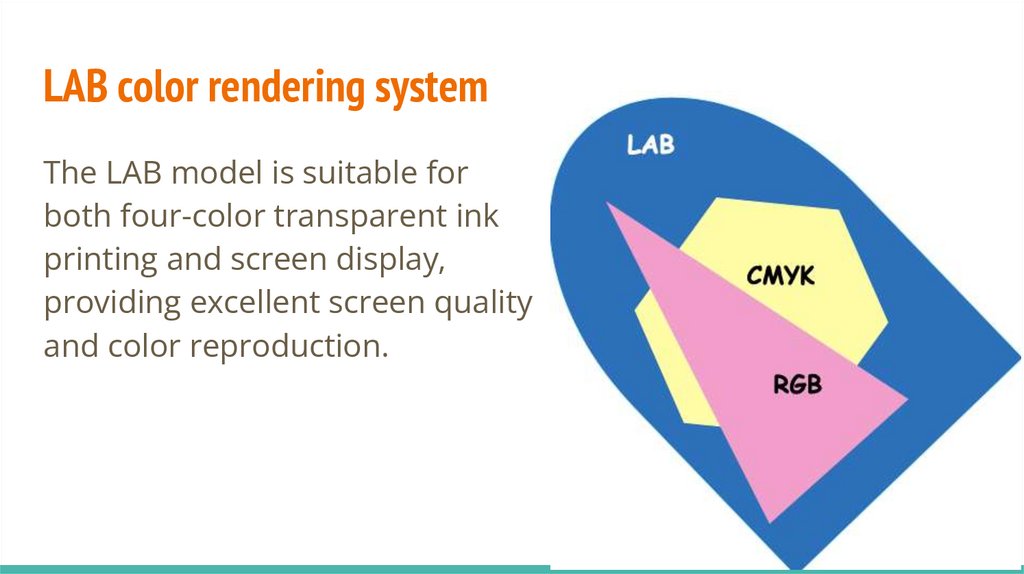
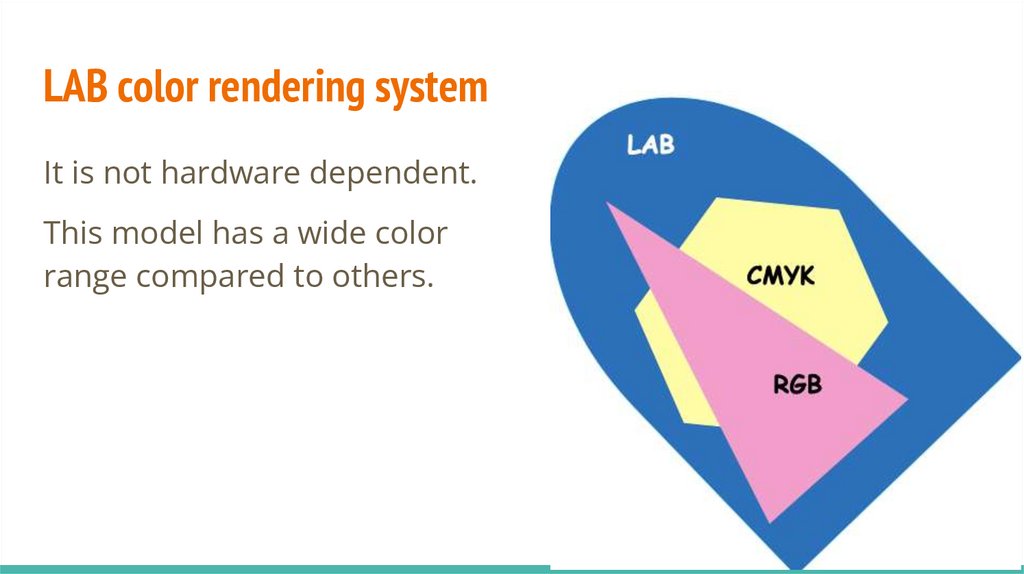

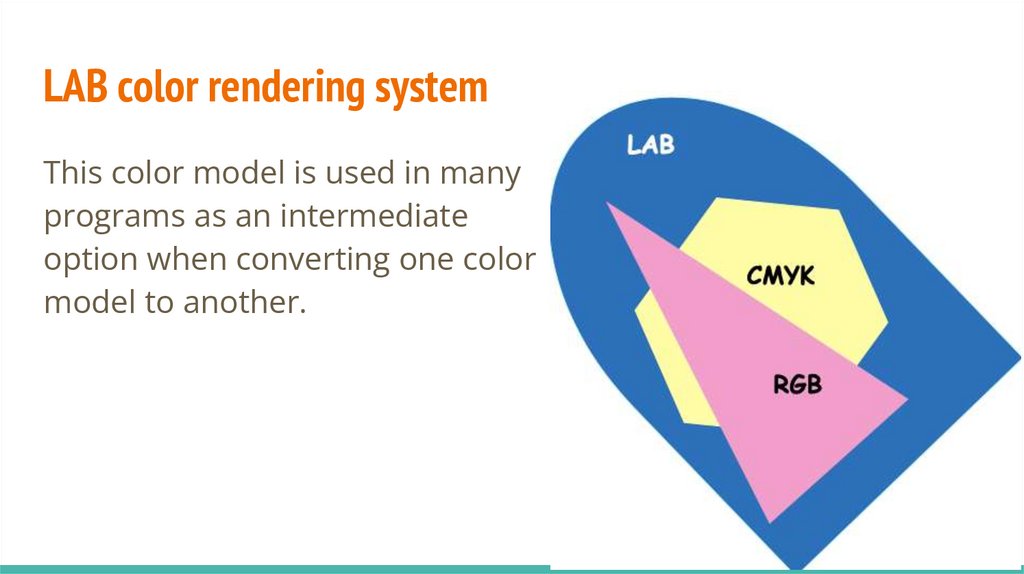
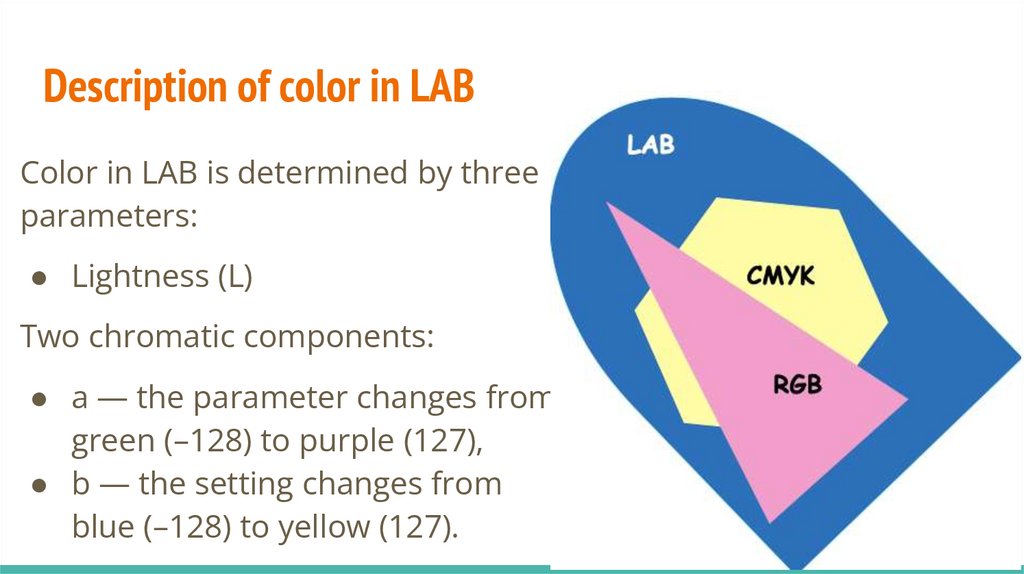
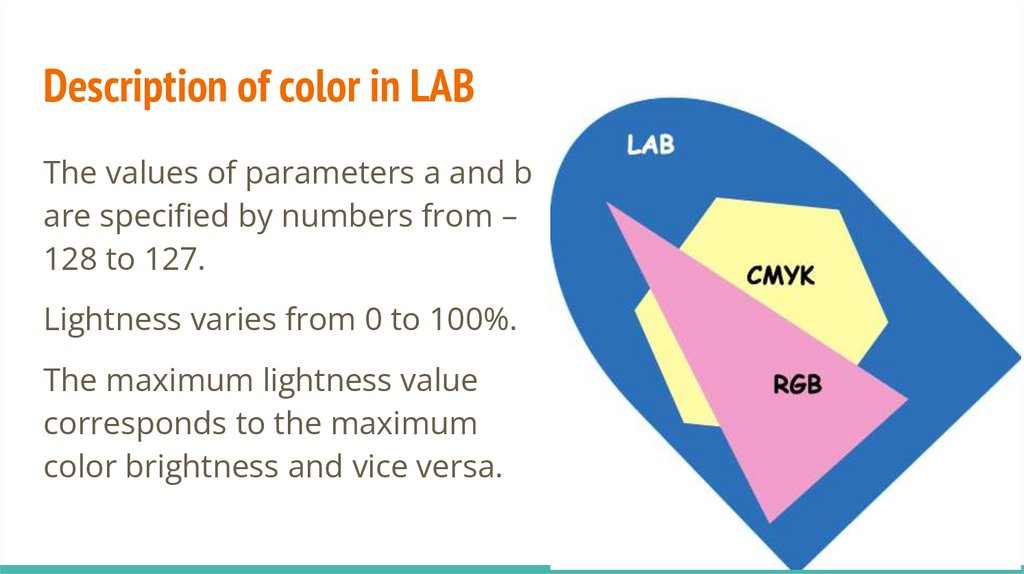

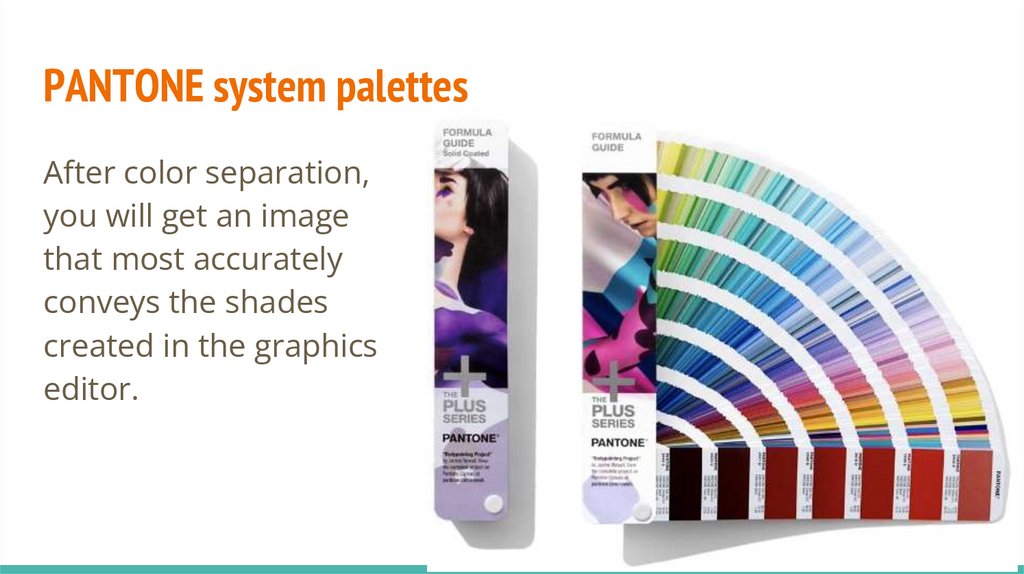


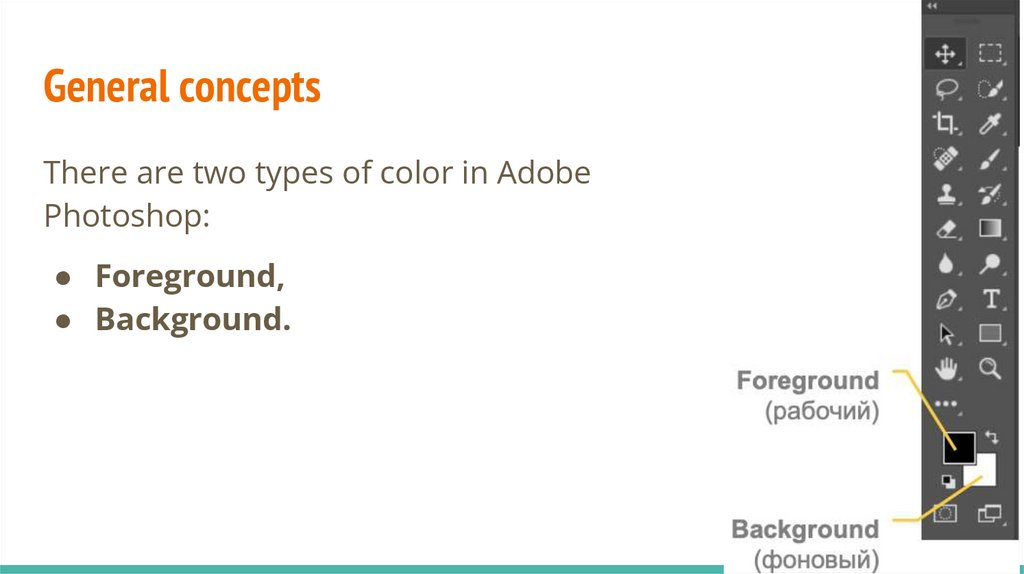
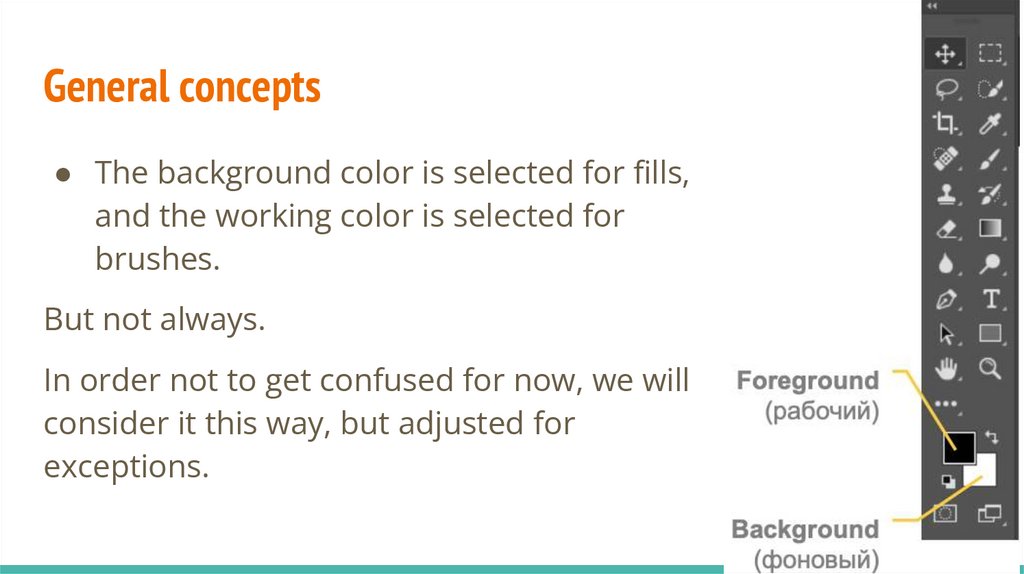
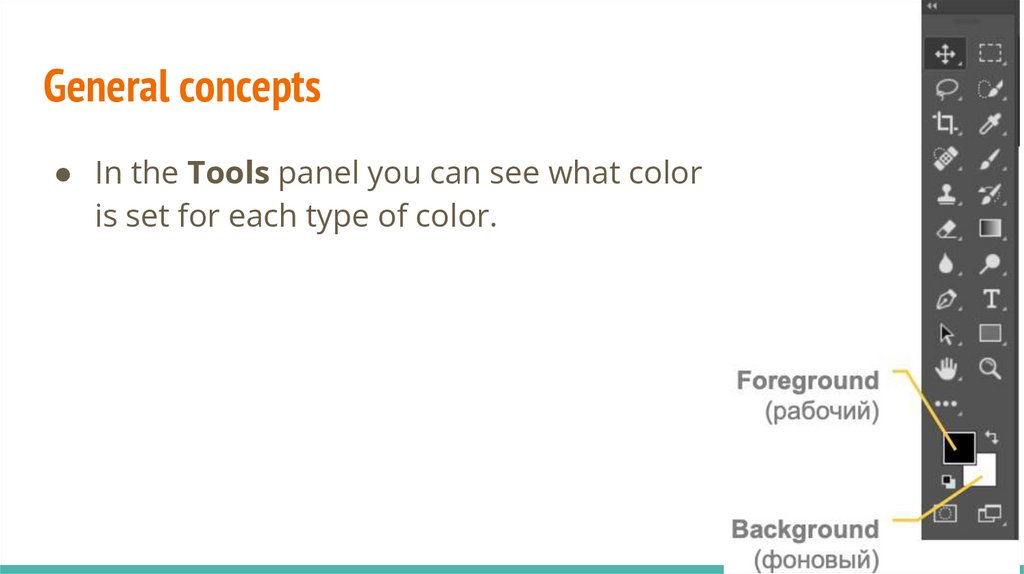
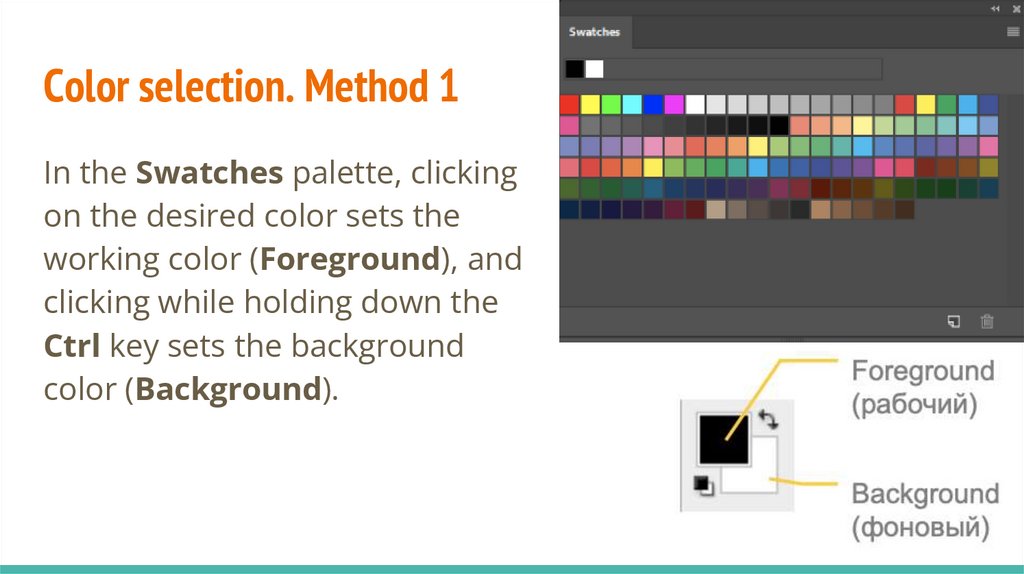
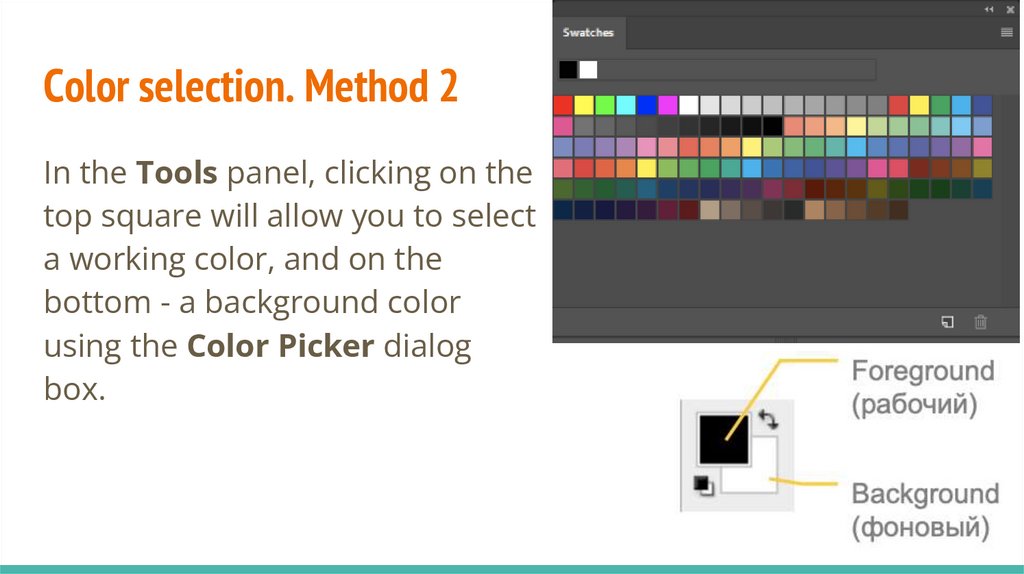
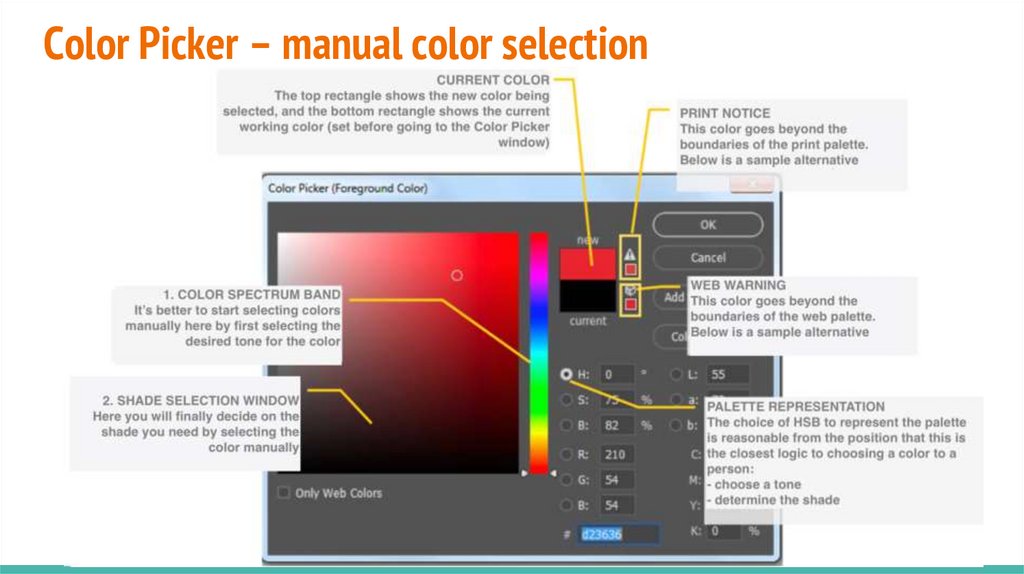
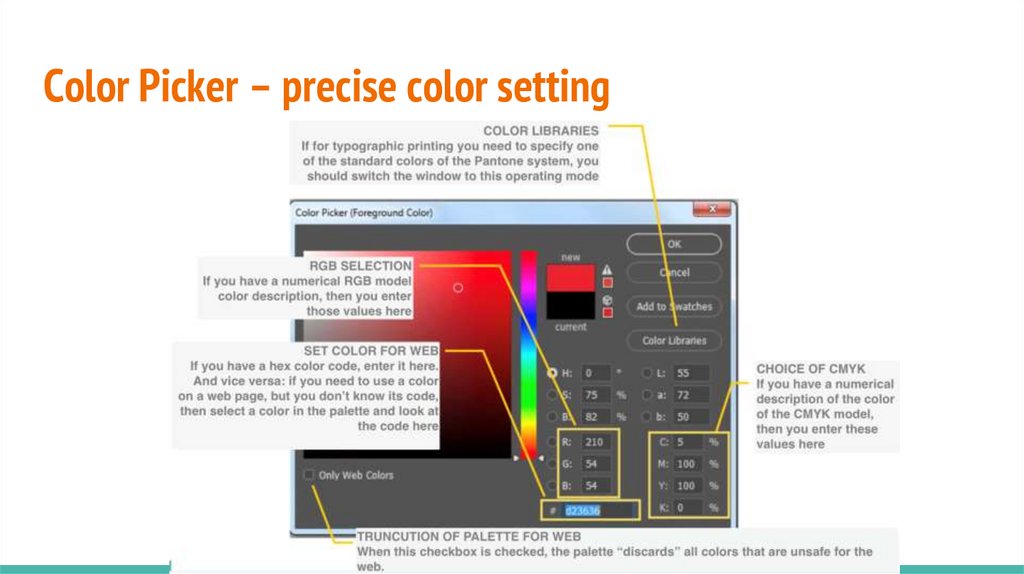
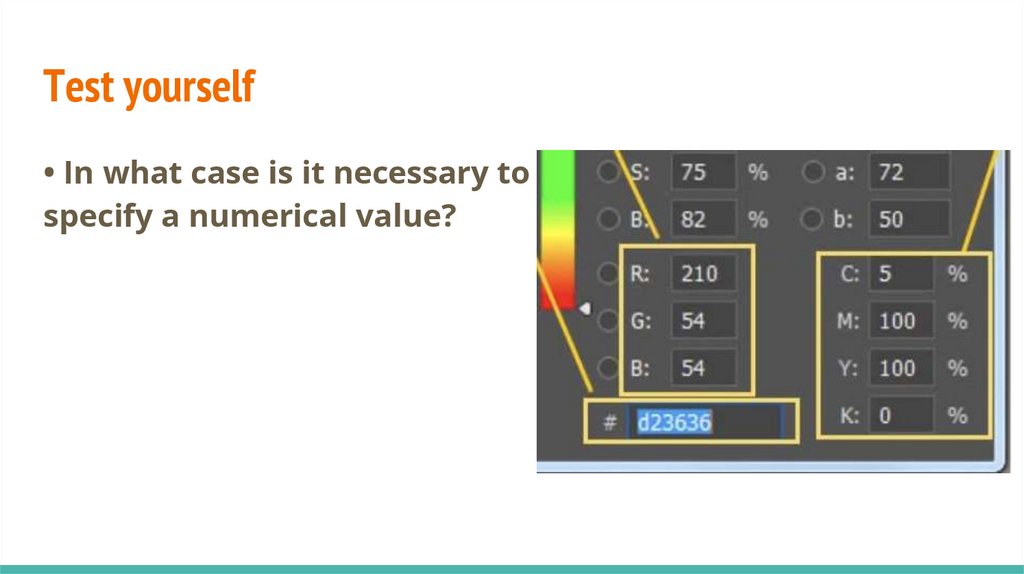
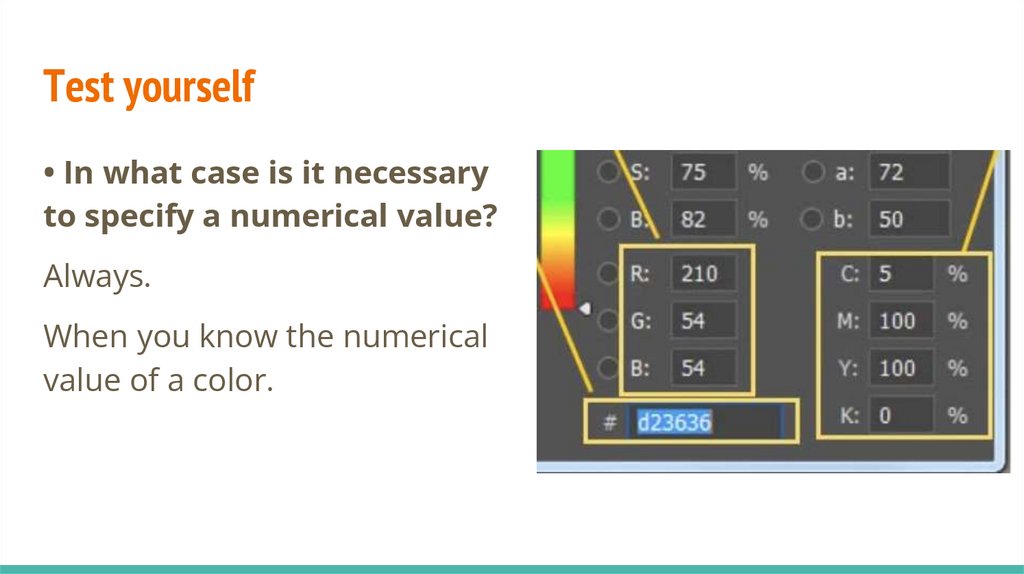
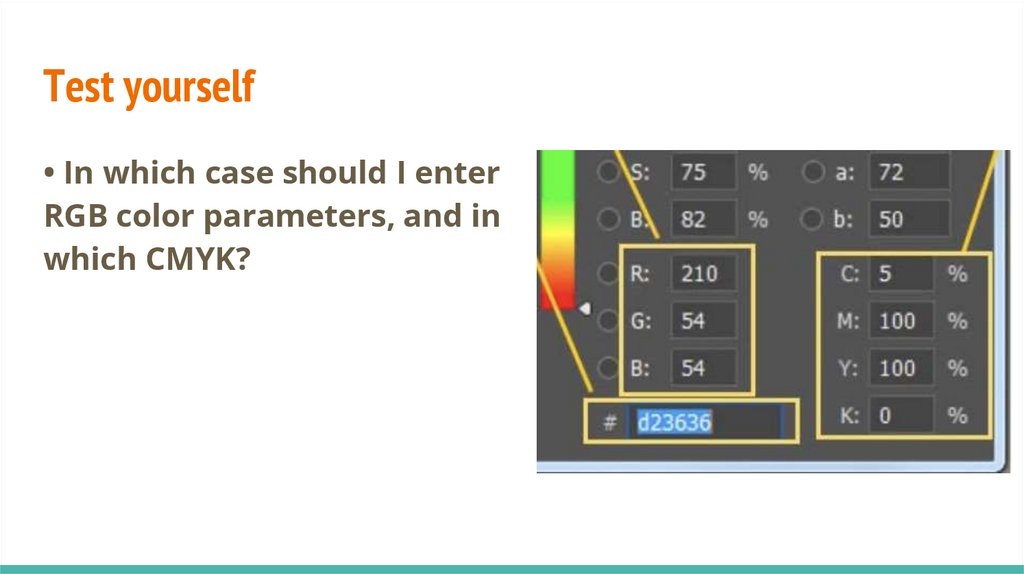
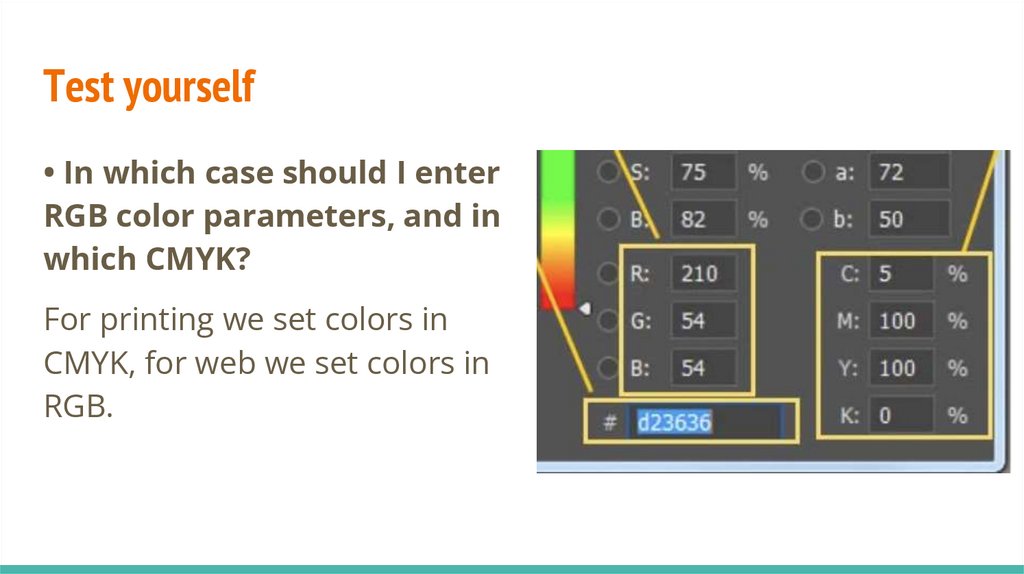
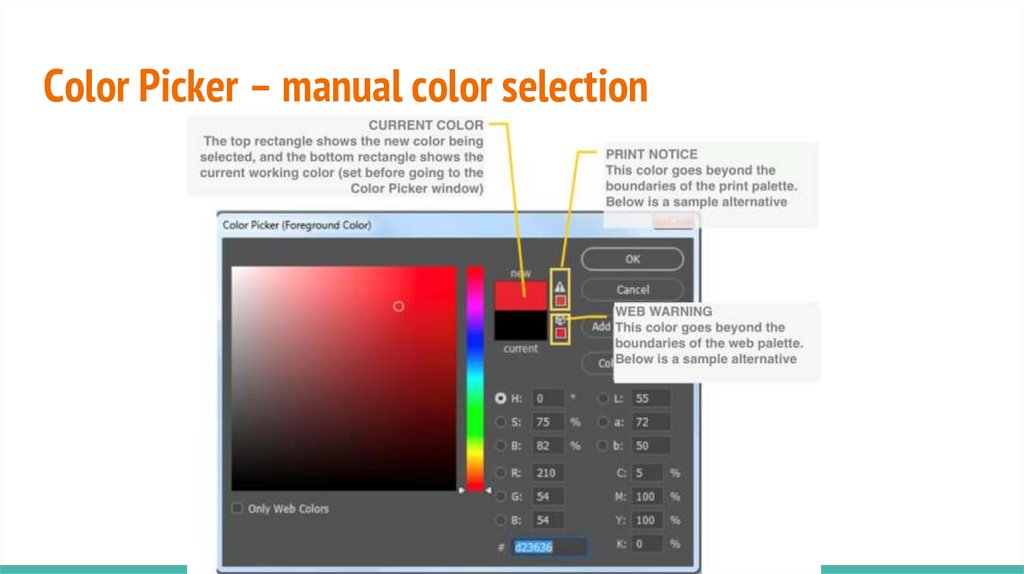
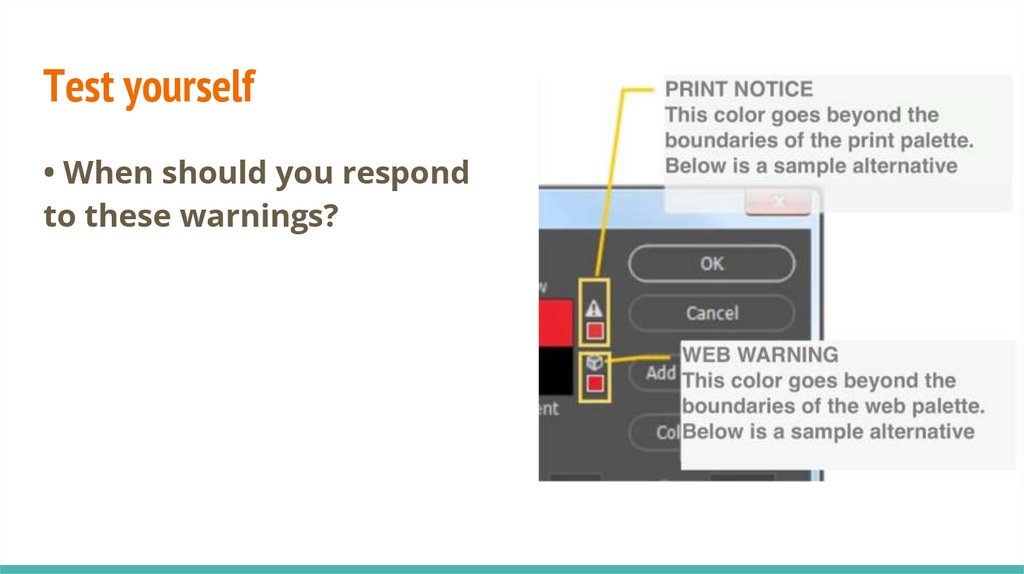
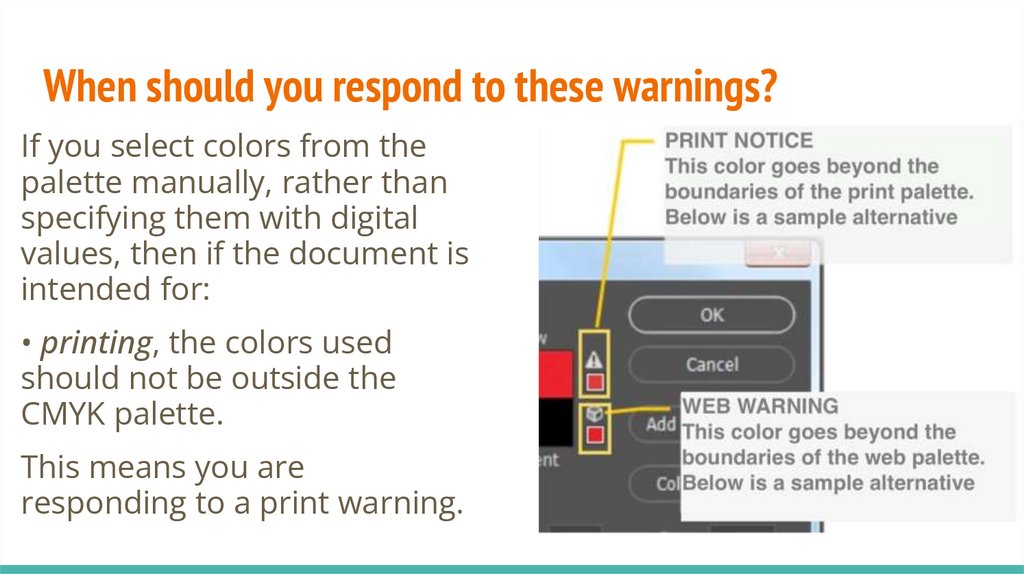
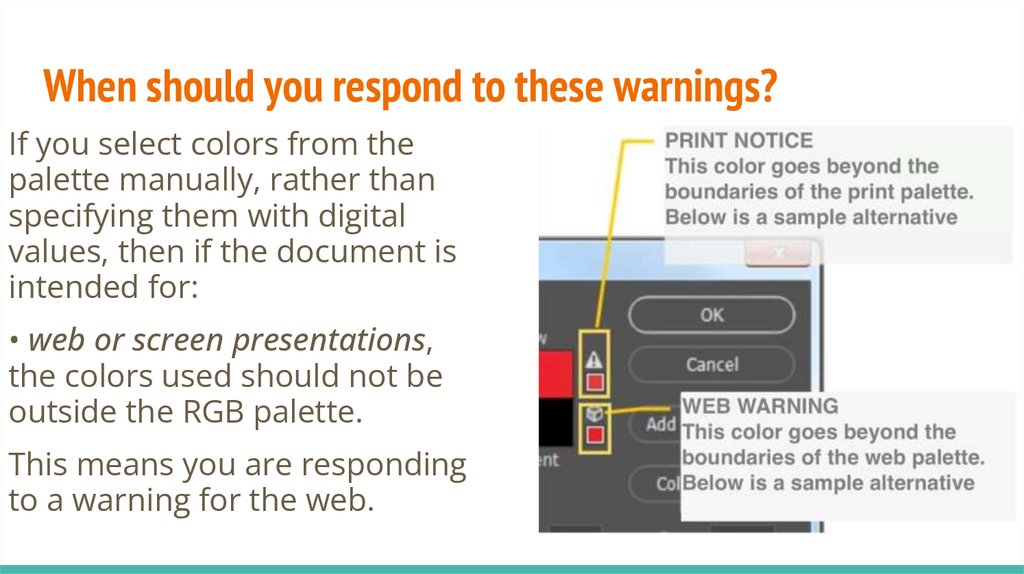
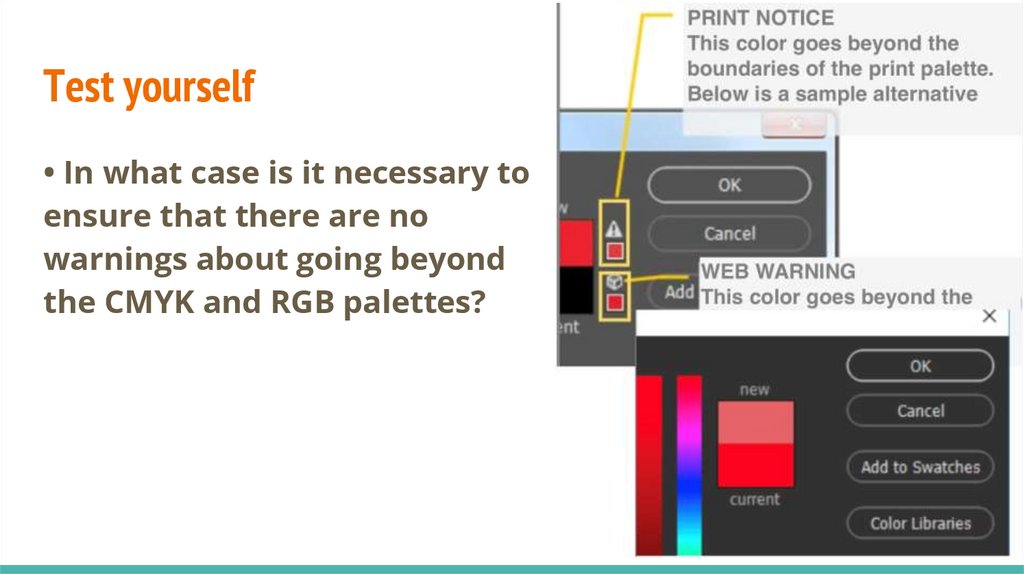
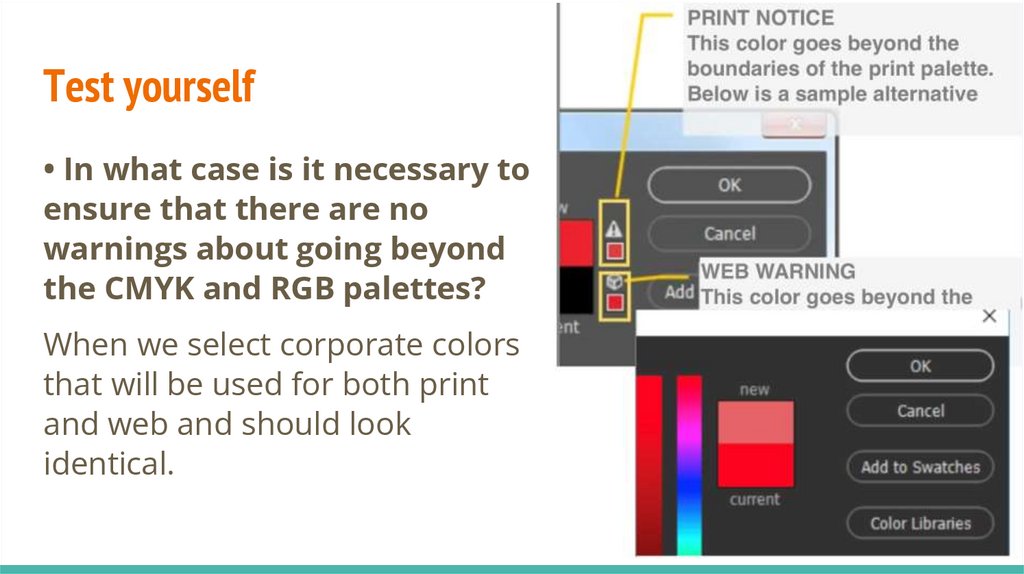
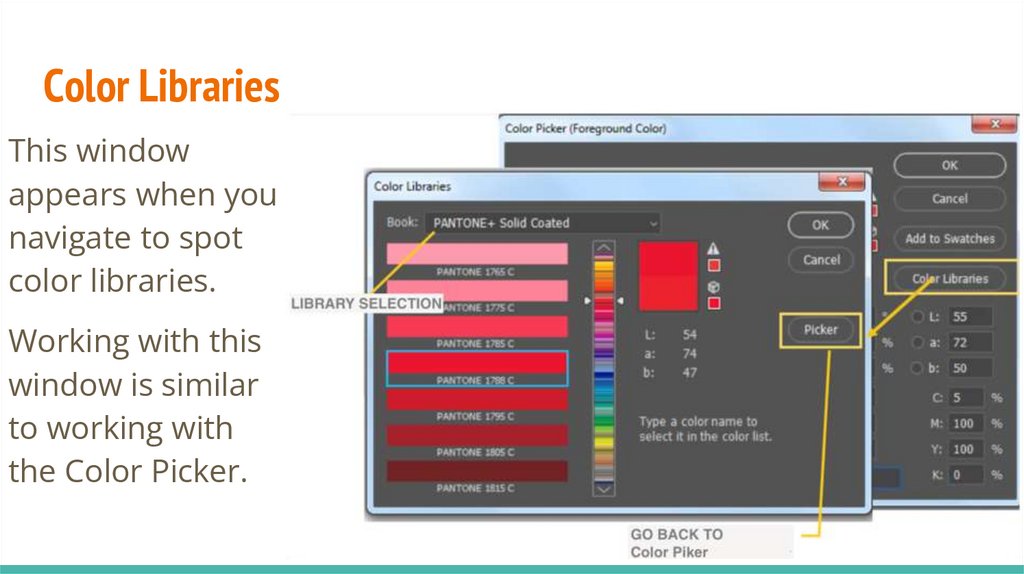
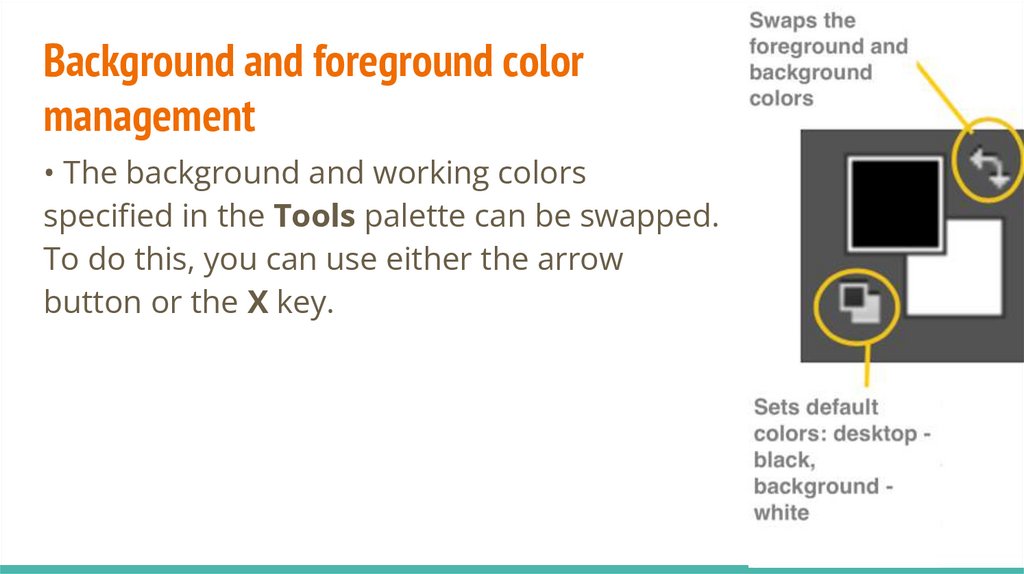
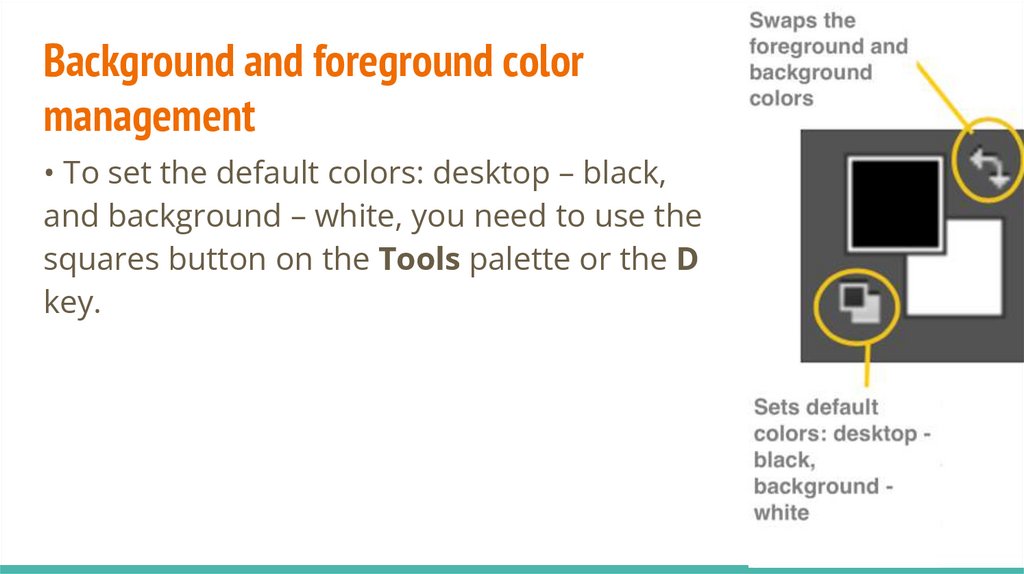
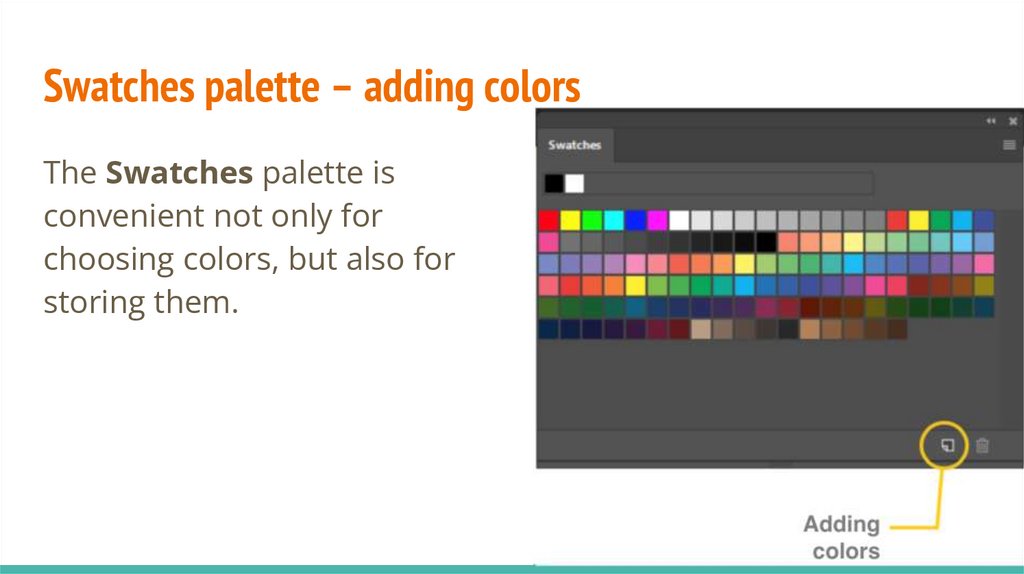
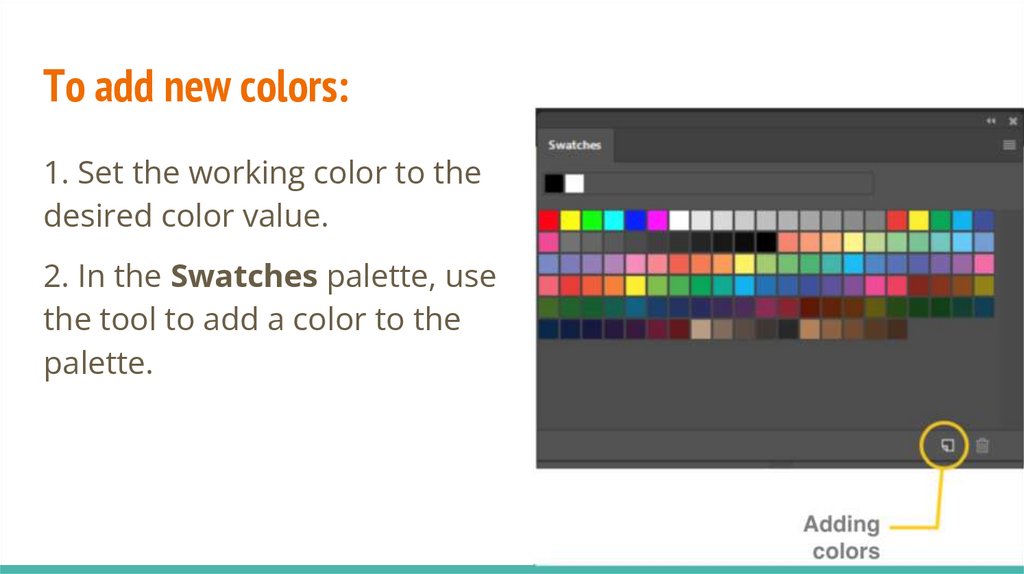
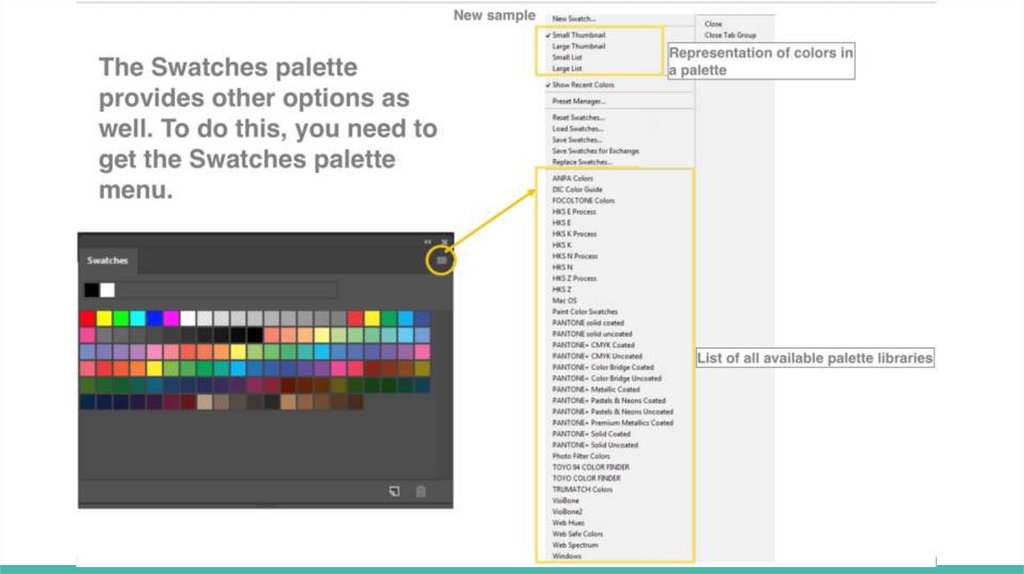
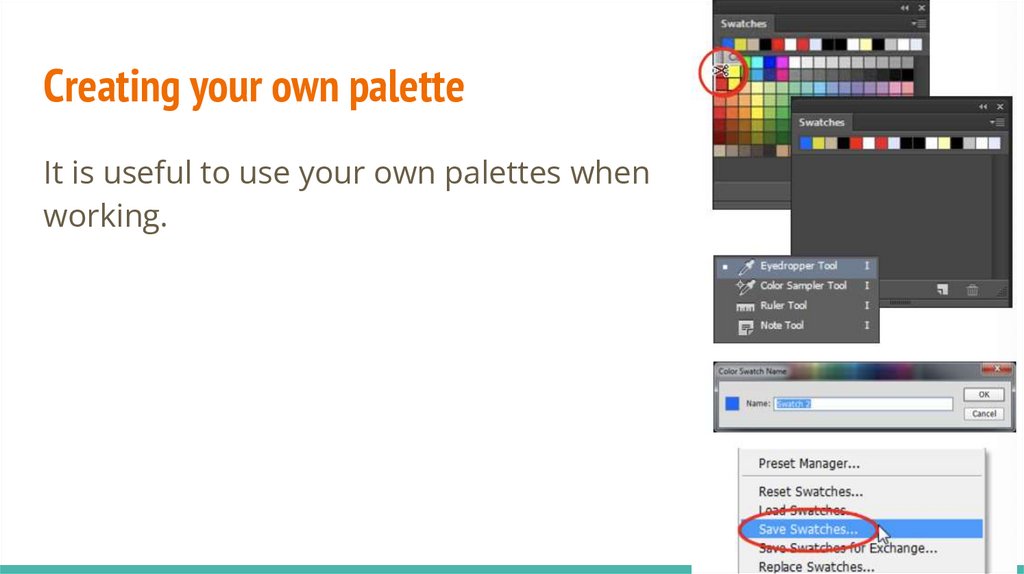
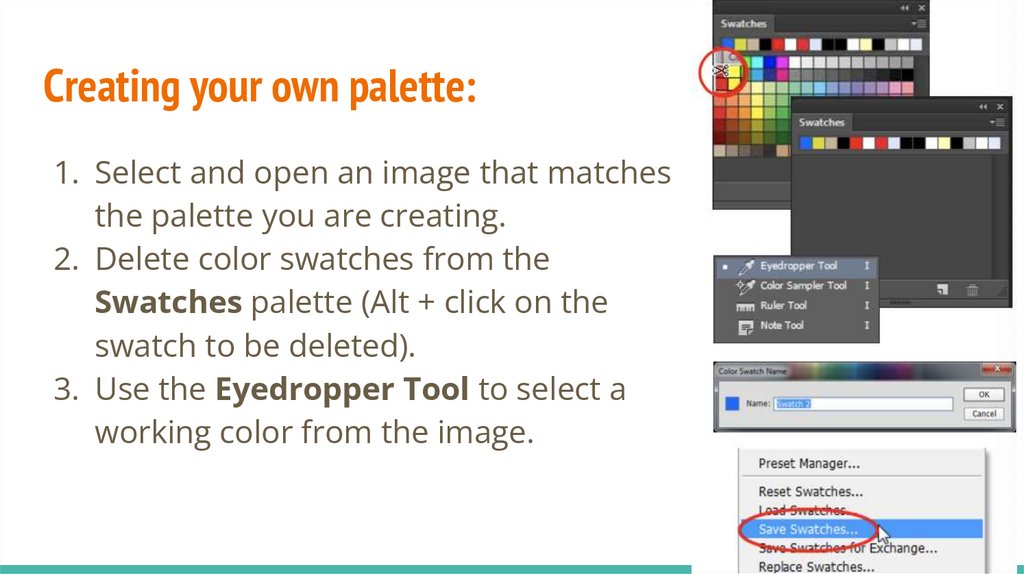
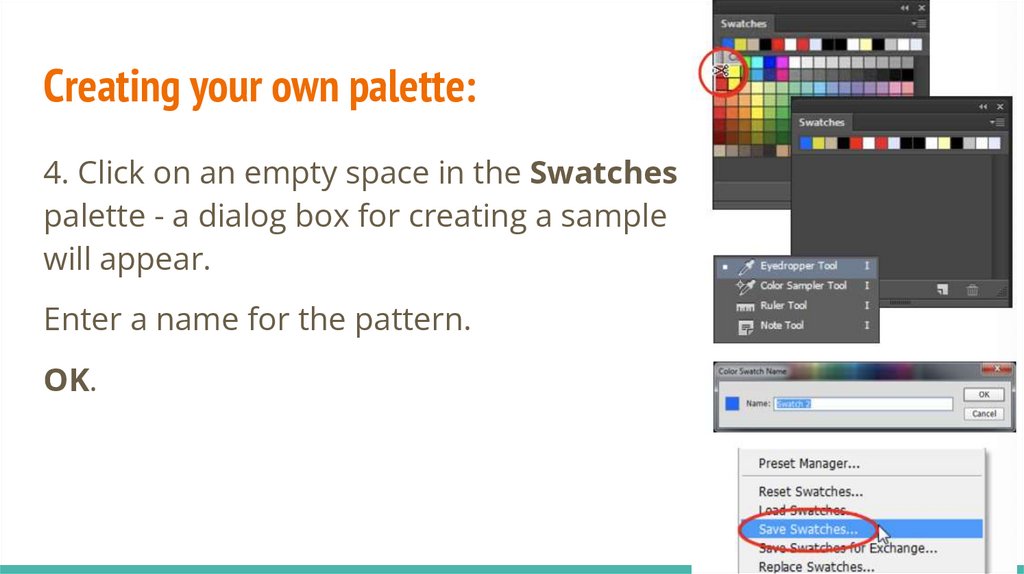
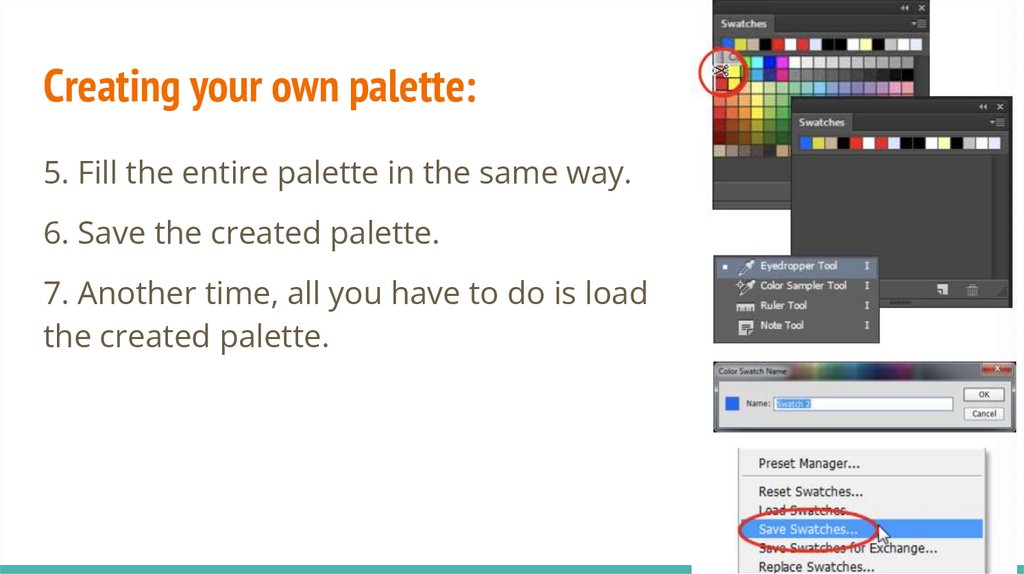
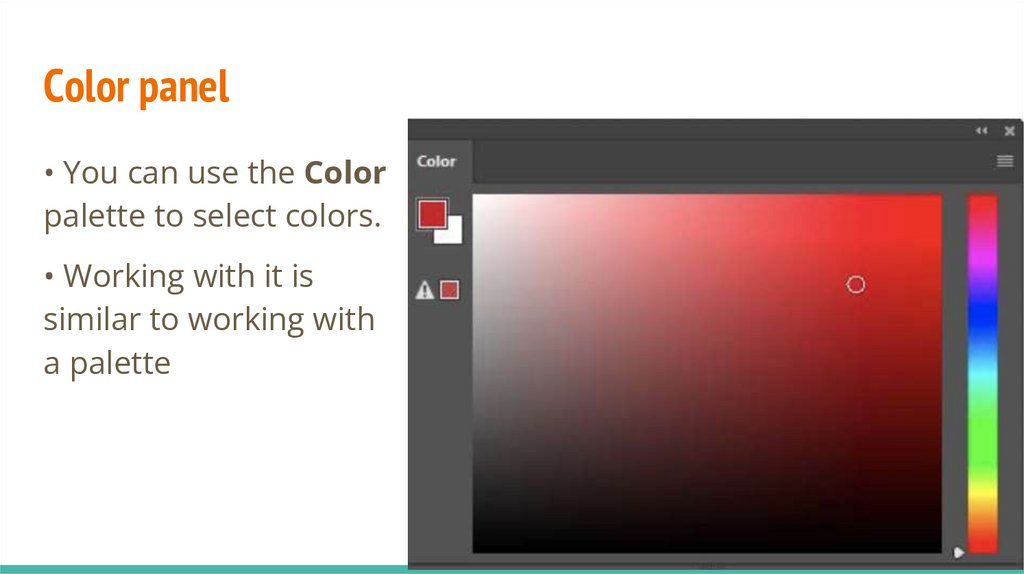
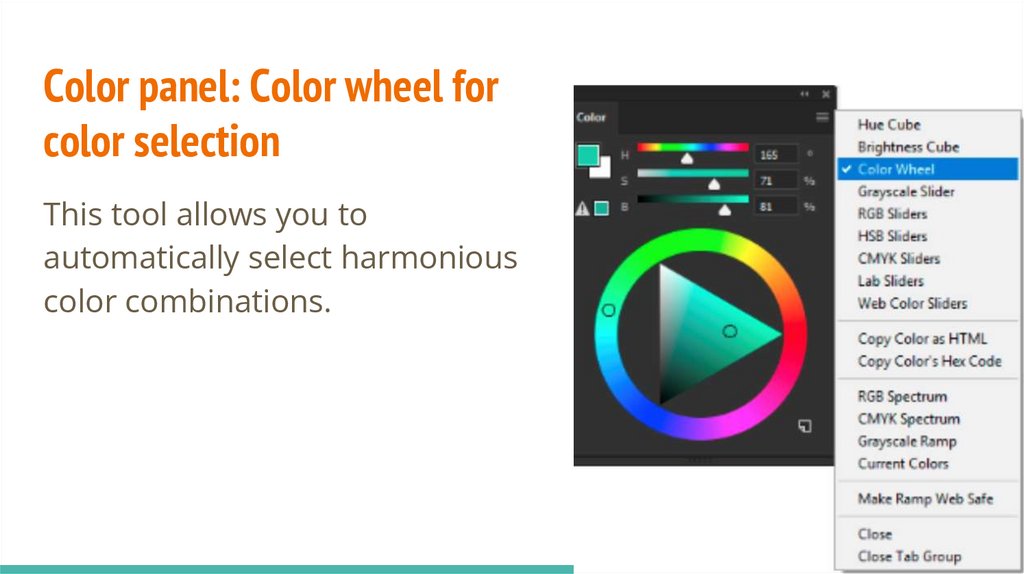
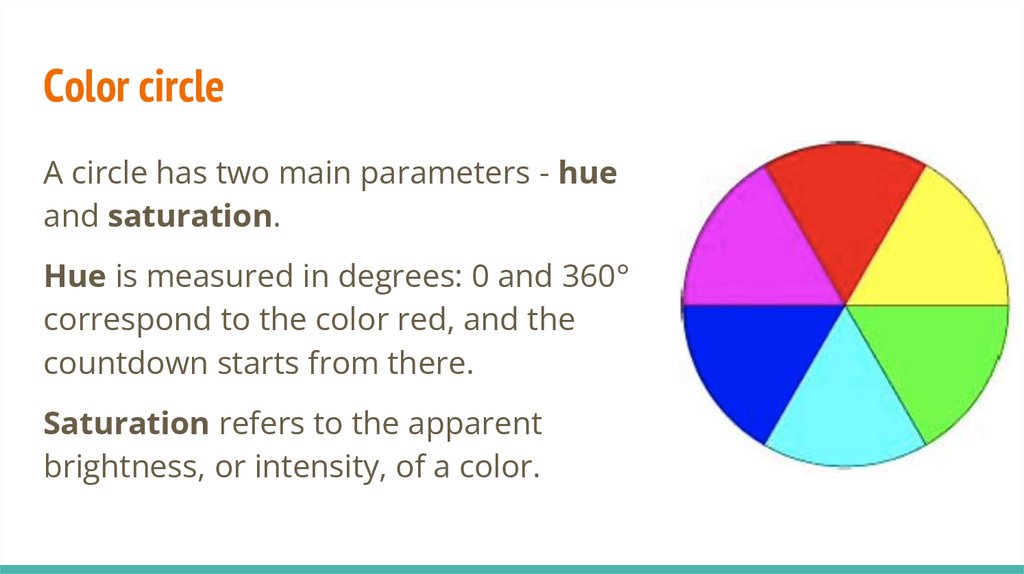
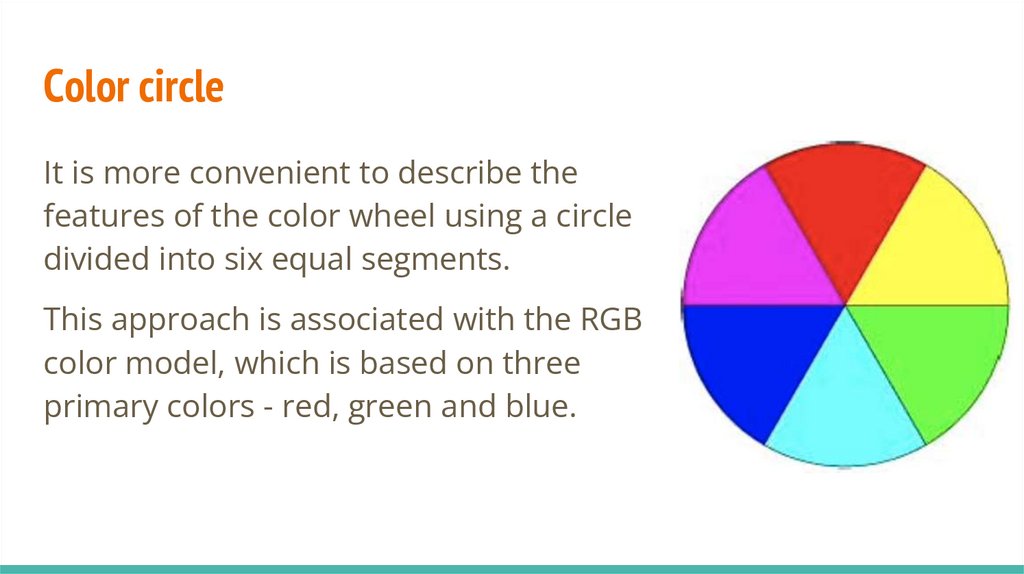
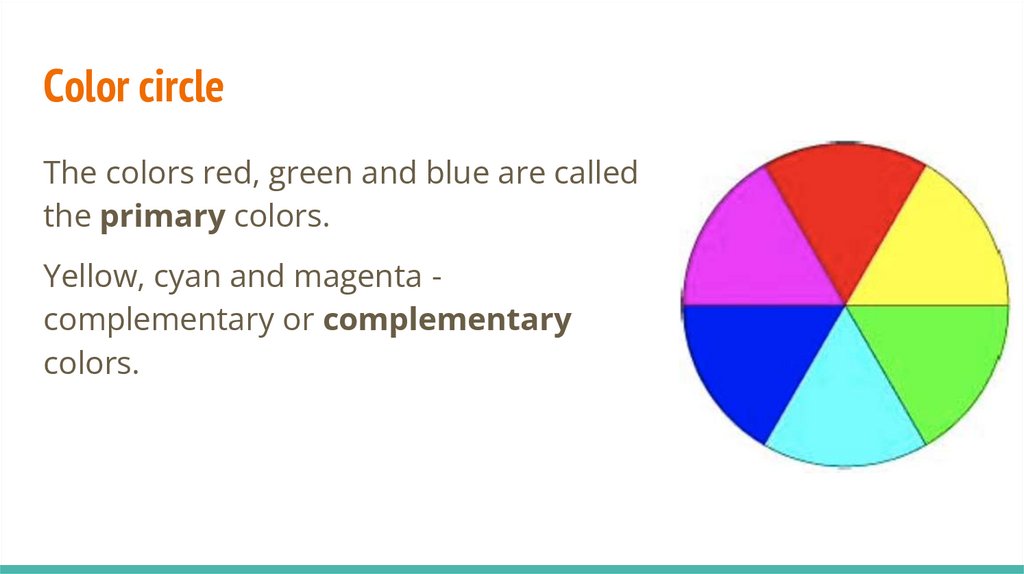
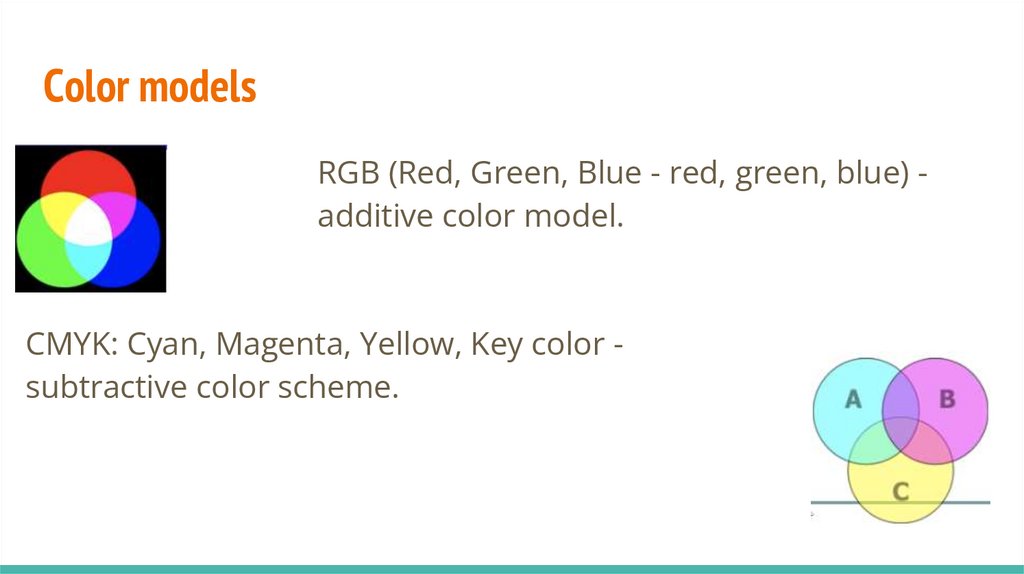

 software


