


 informatics
Similar presentations:


Metrics that matter
1.
Company456Metrics
That
Matter
Connected Commerce IQ Program
2.
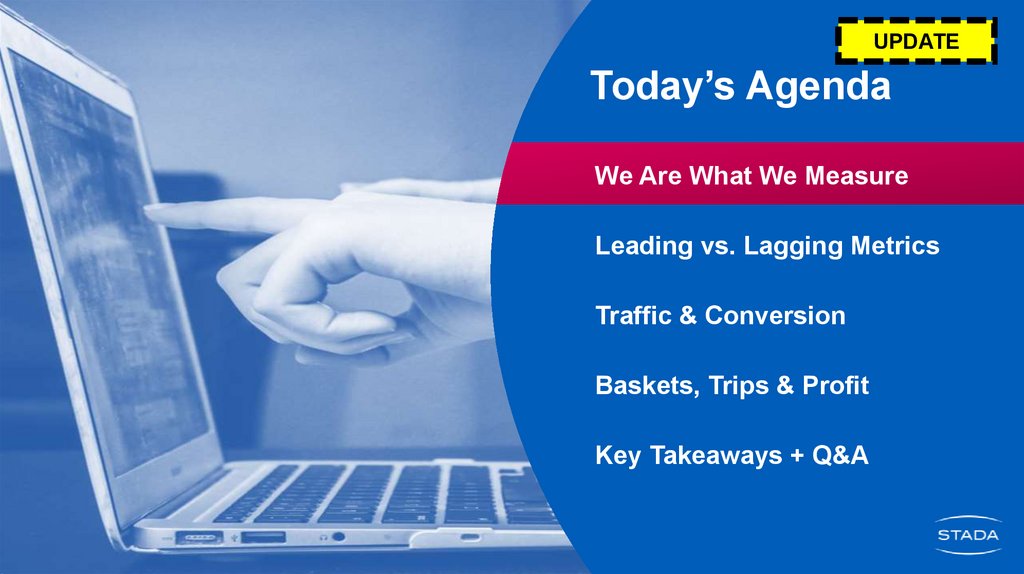
UPDATEToday’s Agenda
We Are What We Measure
Leading vs. Lagging Metrics
Traffic & Conversion
Baskets, Trips & Profit
Key Takeaways + Q&A
3.
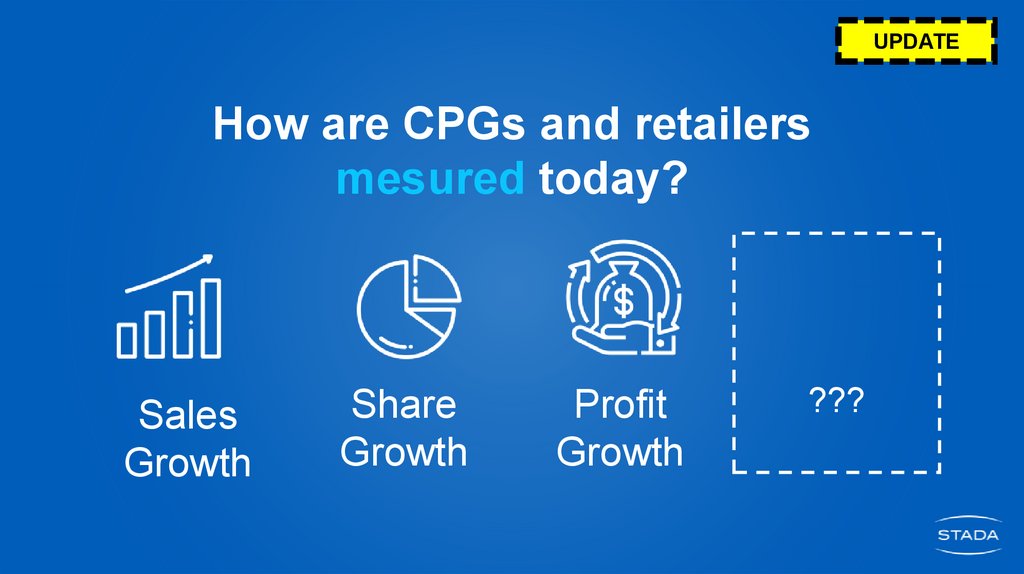
UPDATEHow are CPGs and retailers
mesured today?
Sales
Growth
Share
Growth
Profit
Growth
???
4.
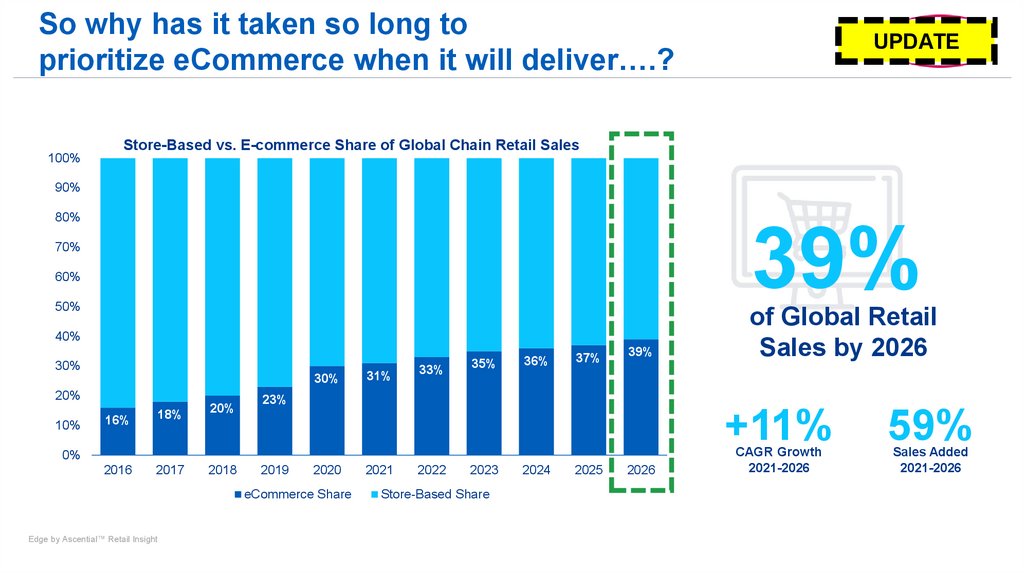
So why has it taken so long toprioritize eCommerce when it will deliver….?
UPDATE
Store-Based vs. E-commerce Share of Global Chain Retail Sales
100%
90%
80%
39%
70%
60%
50%
40%
30%
30%
20%
10%
16%
18%
20%
31%
33%
35%
36%
37%
39%
23%
+11%
0%
2016
2017
2018
2019
2020
eCommerce Share
Edge by Ascential™ Retail Insight
of Global Retail
Sales by 2026
2021
2022
2023
Store-Based Share
2024
2025
2026
CAGR Growth
2021-2026
59%
Sales Added
2021-2026
5.
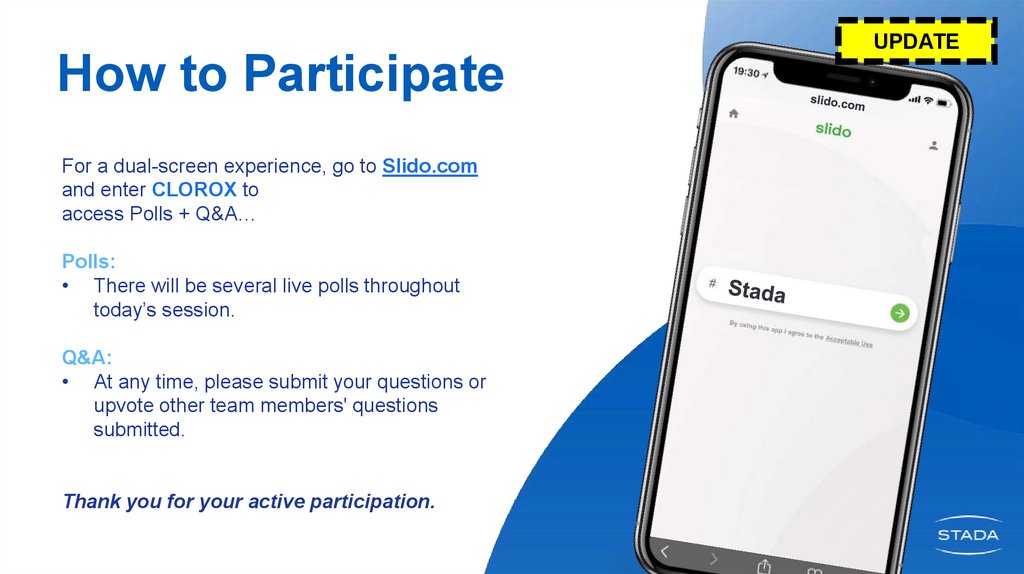
UPDATEHow to Participate
For a dual-screen experience, go to Slido.com
and enter CLOROX to
access Polls + Q&A…
Polls:
• There will be several live polls throughout
today’s session.
Q&A:
• At any time, please submit your questions or
upvote other team members' questions
submitted.
Thank you for your active participation.
6.
UPDATEUntil recently, eCommerce was small.
Exhibit A: <10% of Global CPG Sales
Pre-2019
Edge by Ascential
7.
UPDATEBUT what if I don’t have acess to
that depth of data?
8.
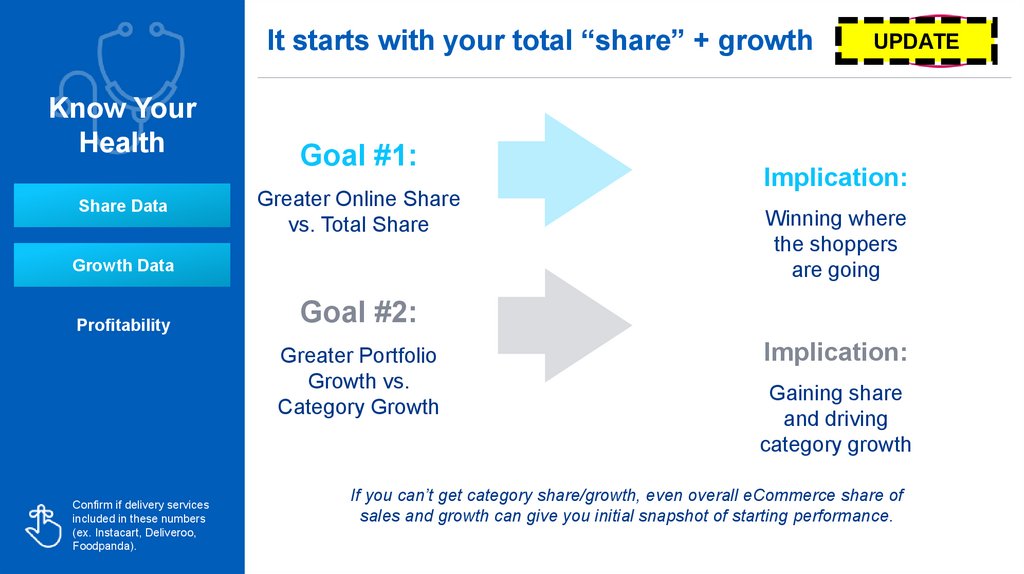
It starts with your total “share” + growthKnow Your
Health
Share Data
Goal #1:
Greater Online Share
vs. Total Share
Growth Data
Profitability
Implication:
Winning where
the shoppers
are going
Goal #2:
Greater Portfolio
Growth vs.
Category Growth
Confirm if delivery services
included in these numbers
(ex. Instacart, Deliveroo,
Foodpanda).
UPDATE
Implication:
Gaining share
and driving
category growth
If you can’t get category share/growth, even overall eCommerce share of
sales and growth can give you initial snapshot of starting performance.
9.
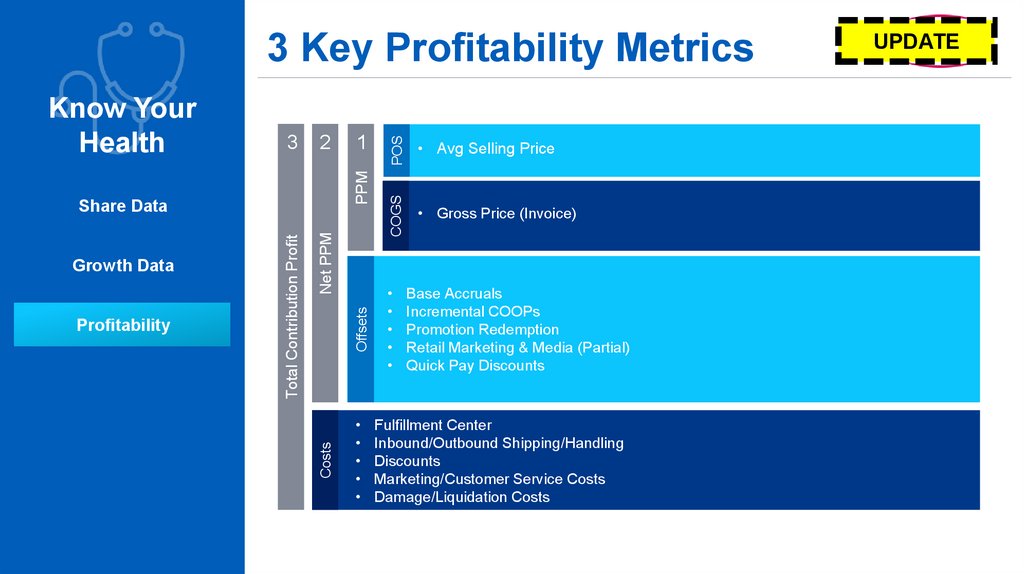
2Offsets
Net PPM
Costs
Profitability
Total Contribution Profit
Share Data
Growth Data
1
POS
3
PPM
Know Your
Health
• Avg Selling Price
COGS
3 Key Profitability Metrics
• Gross Price (Invoice)
Base Accruals
Incremental COOPs
Promotion Redemption
Retail Marketing & Media (Partial)
Quick Pay Discounts
Fulfillment Center
Inbound/Outbound Shipping/Handling
Discounts
Marketing/Customer Service Costs
Damage/Liquidation Costs
UPDATE
10.
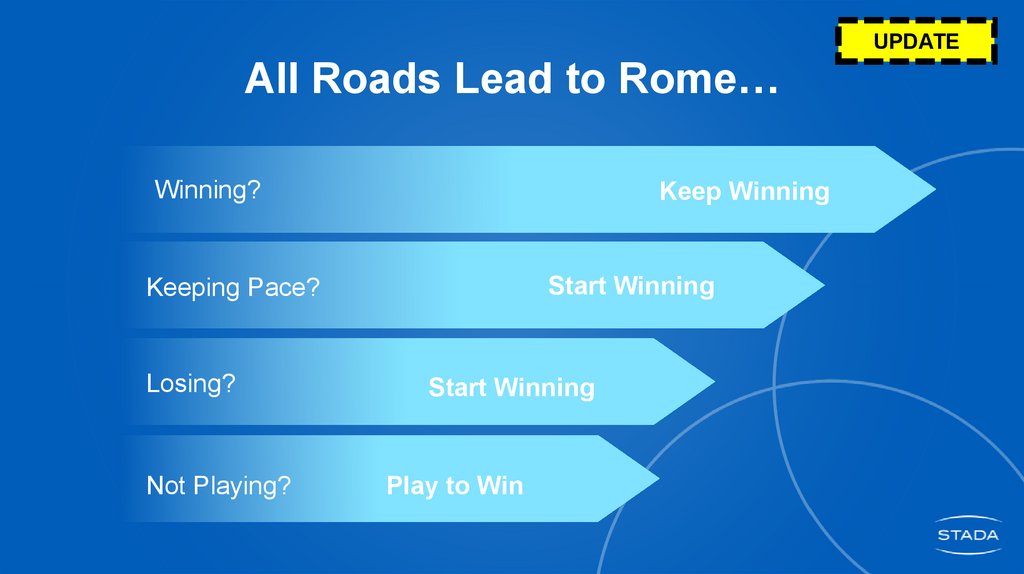
UPDATEAll Roads Lead to Rome…
Winning?
Keep Winning
Start Winning
Keeping Pace?
Losing?
Not Playing?
Start Winning
Play to Win
11.
So which metrics matterthat impact Omnichanel
Sales + Share?
12.
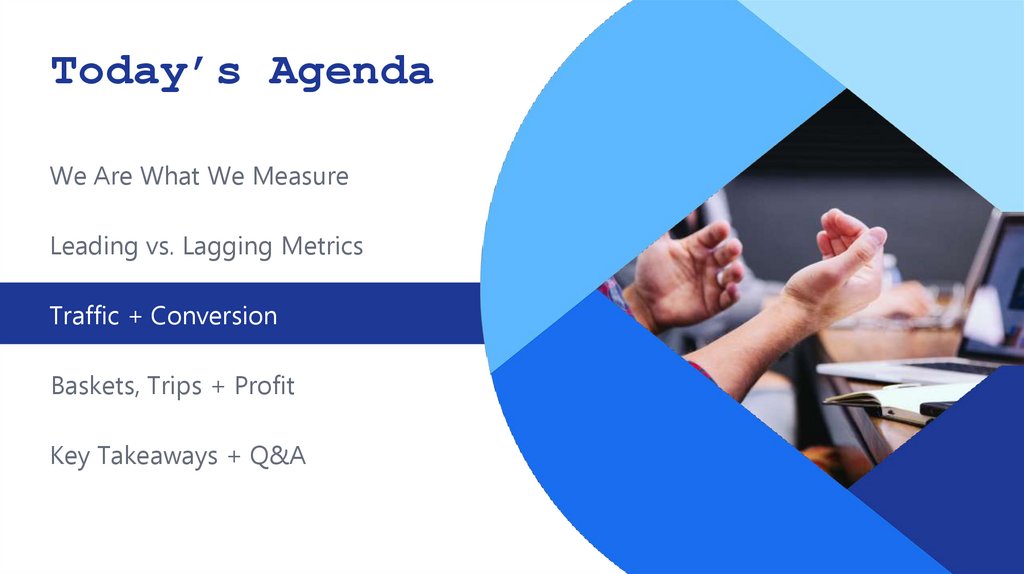
Today’s AgendaWe Are What We Measure
Leading vs. Lagging Metrics
Traffic + Conversion
Baskets, Trips + Profit
Key Takeaways + Q&A
13.
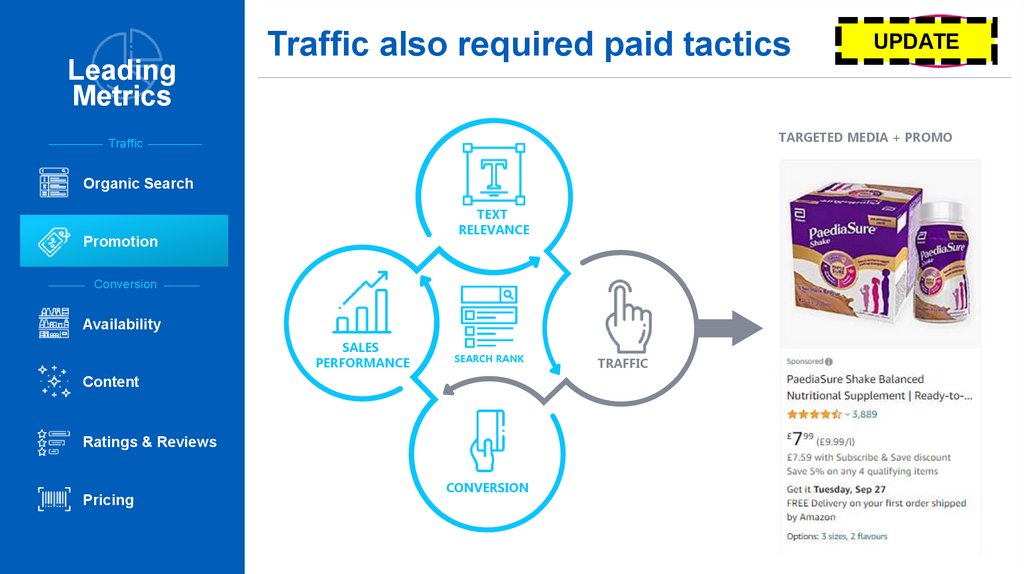
LeadingMetrics
Traffic also required paid tactics
TARGETED MEDIA + PROMO
Traffic
Organic Search
TEXT
RELEVANCE
Promotion
Conversion
Availability
SALES
PERFORMANCE
SEARCH RANK
Content
Ratings & Reviews
Pricing
UPDATE
CONVERSION
TRAFFIC
14.
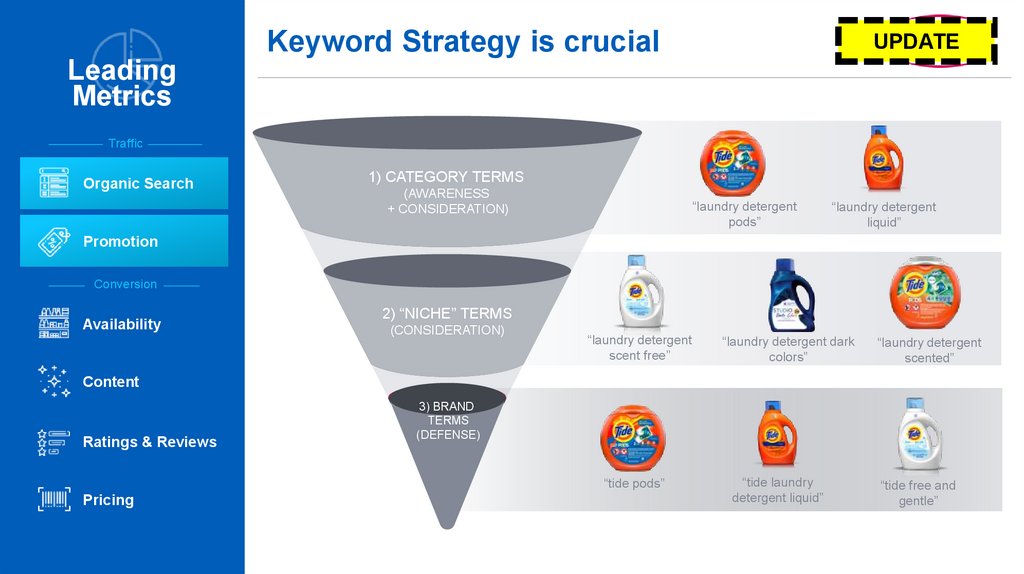
Keyword Strategy is crucialUPDATE
Leading
Metrics
Traffic
Organic Search
1) CATEGORY TERMS
(AWARENESS
+ CONSIDERATION)
“laundry detergent
pods”
“laundry detergent
liquid”
Promotion
Conversion
Availability
2) “NICHE” TERMS
(CONSIDERATION)
“laundry detergent
scent free”
“laundry detergent dark
colors”
“laundry detergent
scented”
Content
Ratings & Reviews
3) BRAND
TERMS
(DEFENSE)
“tide pods”
Pricing
“tide laundry
detergent liquid”
“tide free and
gentle”
15.
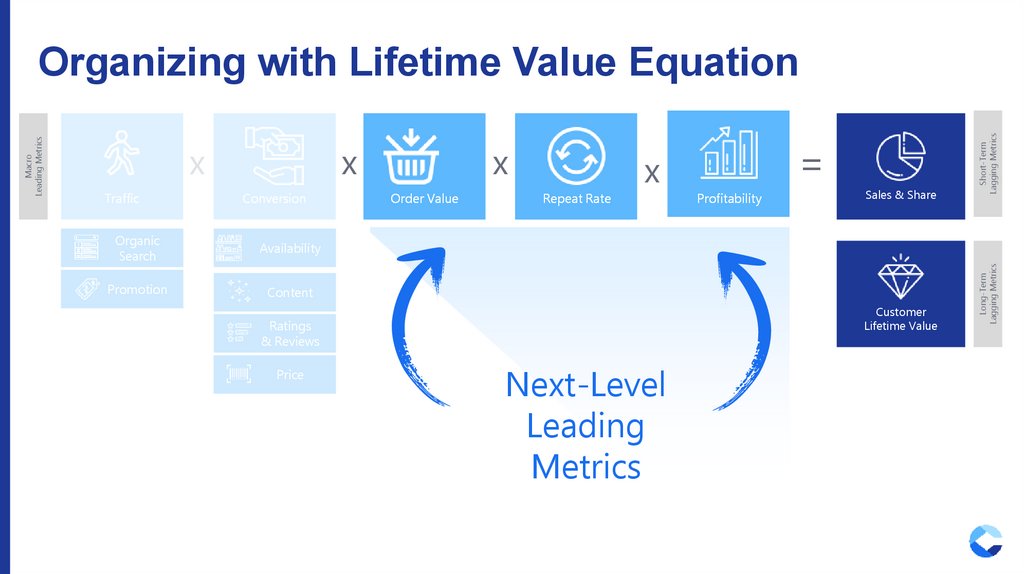
Trafficx
Conversion
Organic
Search
Availability
Promotion
Content
x
Order Value
Repeat Rate
x
Profitability
Sales & Share
Customer
Lifetime Value
Ratings
& Reviews
Price
=
Next-Level
Leading
Metrics
Short-Term
Lagging Metrics
x
Long-Term
Lagging Metrics
Macro
Leading Metrics
Organizing with Lifetime Value Equation
16.
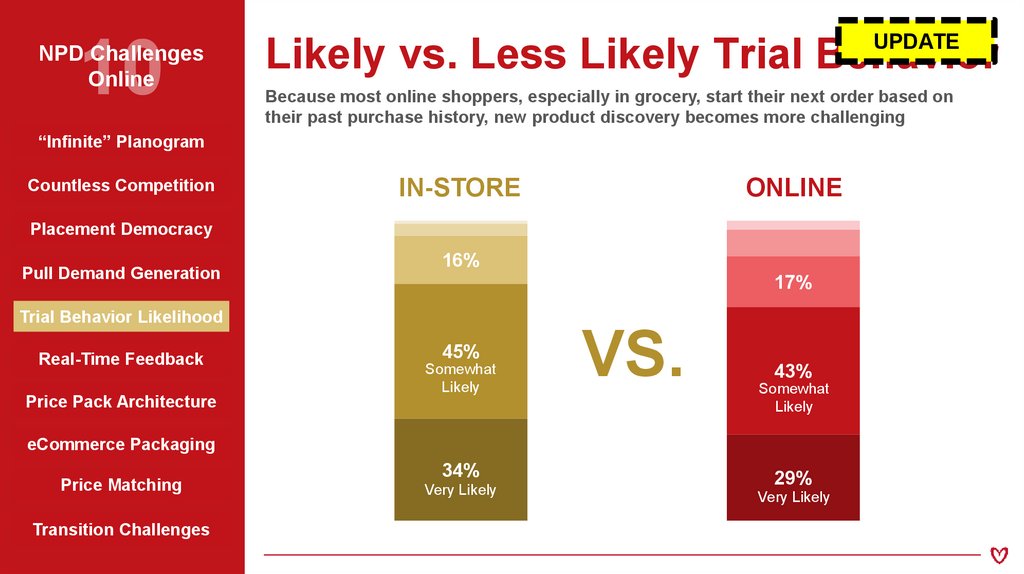
NPD ChallengesOnline
UPDATE
Likely vs. Less Likely Trial Behavior
Because most online shoppers, especially in grocery, start their next order based on
their past purchase history, new product discovery becomes more challenging
“Infinite” Planogram
Countless Competition
IN-STORE
ONLINE
Placement Democracy
Pull Demand Generation
16%
17%
Trial Behavior Likelihood
Real-Time Feedback
Price Pack Architecture
45%
Somewhat
Likely
VS.
43%
Somewhat
Likely
eCommerce Packaging
Price Matching
Transition Challenges
34%
Very Likely
29%
Very Likely
17.
TEMPLATE SLIDES18.
Today’s AgendaWe Are What We Measure
Leading vs. Lagging Metrics
Traffic + Conversion
Baskets, Trips + Profit
Key Takeaways + Q&A
19.
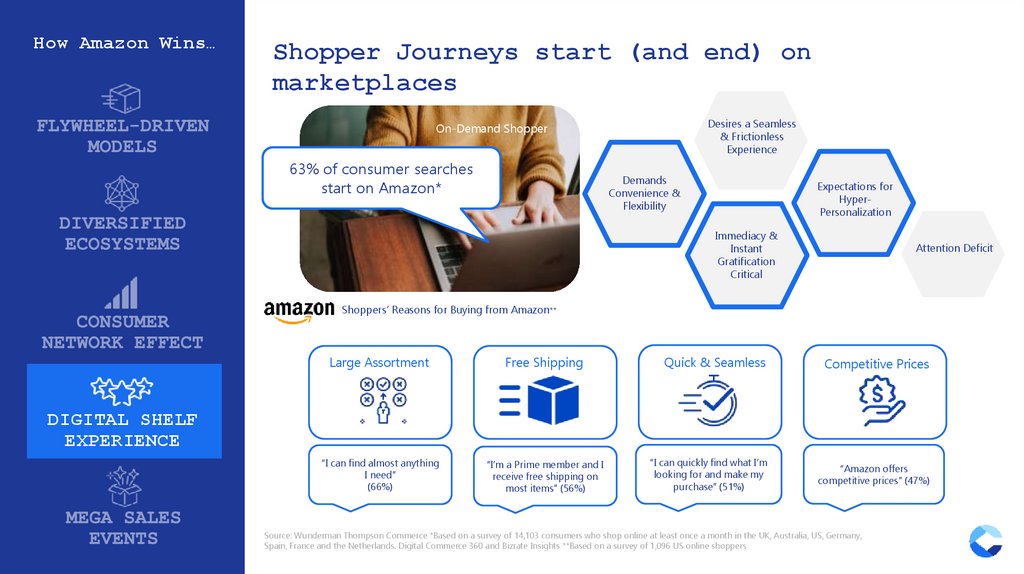
How Amazon Wins…Shopper Journeys start (and end) on
marketplaces
Desires a Seamless
& Frictionless
Experience
On-Demand Shopper
63% of consumer searches
start on Amazon*
Demands
Convenience &
Flexibility
Expectations for
HyperPersonalization
Immediacy &
Instant
Gratification
Critical
Attention Deficit
Shoppers’ Reasons for Buying from Amazon**
Large Assortment
Free Shipping
Quick & Seamless
Competitive Prices
“I can find almost anything
I need”
(66%)
“I’m a Prime member and I
receive free shipping on
most items” (56%)
“I can quickly find what I’m
looking for and make my
purchase” (51%)
“Amazon offers
competitive prices” (47%)
DIGITAL SHELF
EXPERIENCE
Source: Wunderman Thompson Commerce *Based on a survey of 14,103 consumers who shop online at least once a month in the UK, Australia, US, Germany,
Spain, France and the Netherlands. Digital Commerce 360 and Bizrate Insights **Based on a survey of 1,096 US online shoppers
20.
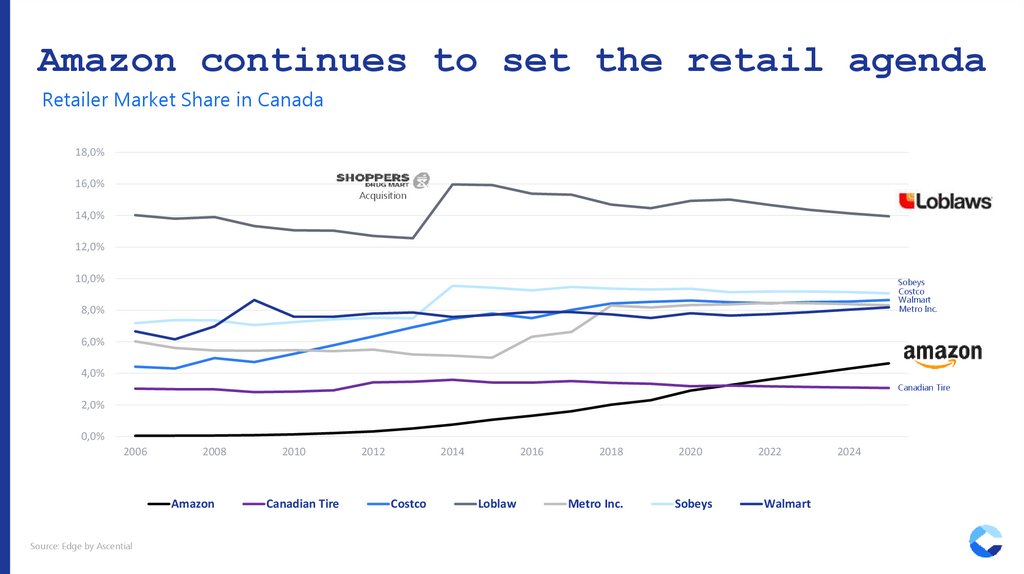
Amazon continues to set the retail agendaRetailer Market Share in Canada
18,0%
16,0%
Acquisition
14,0%
12,0%
10,0%
Sobeys
Costco
Walmart
Metro Inc.
8,0%
6,0%
4,0%
Canadian Tire
2,0%
0,0%
2006
2008
Amazon
Source: Edge by Ascential
2010
Canadian Tire
2012
2014
Costco
2016
Loblaw
2018
Metro Inc.
2020
2022
Sobeys
Walmart
2024
21.
Why should I care so muchabout Amazon?
22.
Poll QuestionWhat enables Amazon
to win?