


 industry
Similar presentations:


Reservoir Charact erist ics, Rock & Fluid Properties and Drive Mechanism
1.
Reservoir Charact erist ics, Rock& Fluid Properties and Drive
Mechanism
2.
Reservoir CharacteristicsTo ensure the best possible return, it is important to
understand as much as possible about the reservoir.
This always presents a conceptual problem as we cannot
physically see the reservoir in question.
Techniques, such as; Seismic Data Acquisition, Electric Line
Logging, Core Analysis, PVT Analysis, and Well Testing etc
produce valuable data which help build the simulated
reservoir model and thus help in developing the most cost
effective strategy to manage the asset.
3.
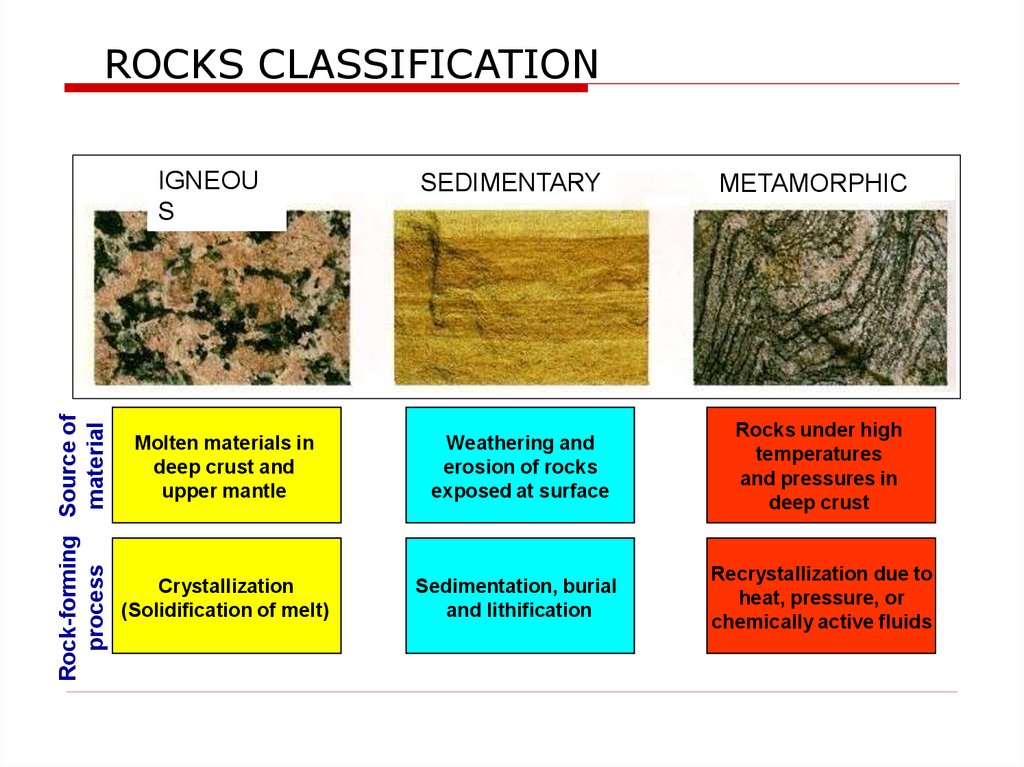
ROCKS CLASSIFICATIONRock-forming Source of
process
material
IGNEOU
S
SEDIMENTARY
METAMORPHIC
Molten materials in
deep crust and
upper mantle
Weathering and
erosion of rocks
exposed at surface
Rocks under high
temperatures
and pressures in
deep crust
Crystallization
(Solidification of melt)
Sedimentation, burial
and lithification
Recrystallization due to
heat, pressure, or
chemically active fluids
4.
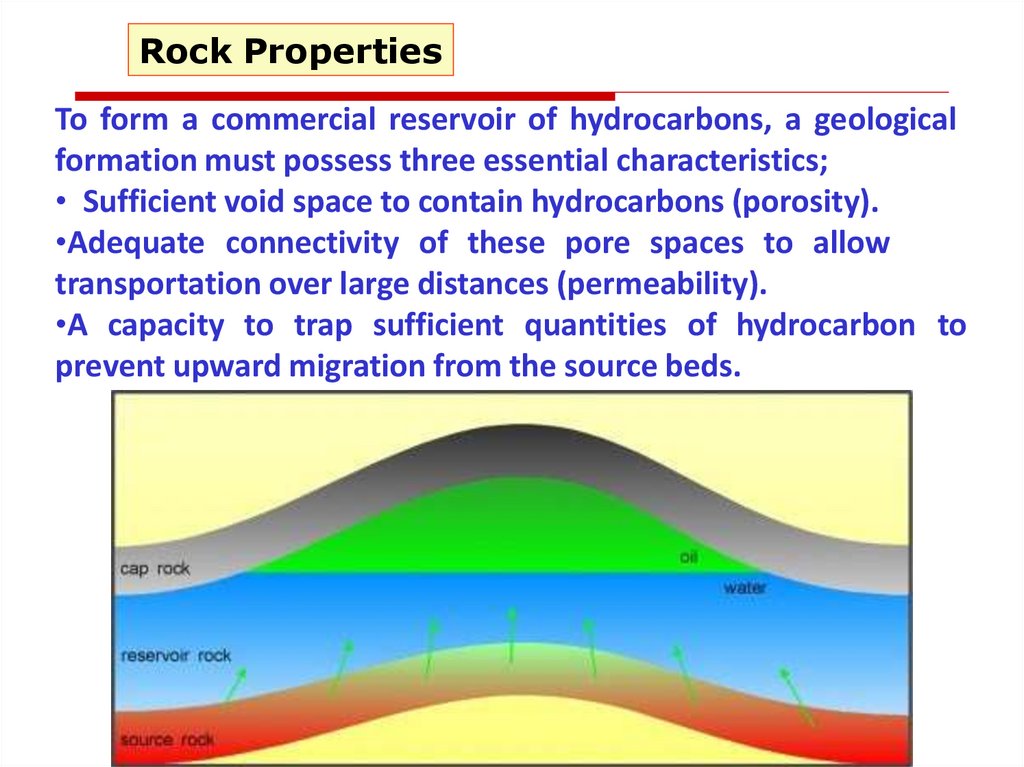
Rock PropertiesTo form a commercial reservoir of hydrocarbons, a geological
formation must possess three essential characteristics;
• Sufficient void space to contain hydrocarbons (porosity).
•Adequate connectivity of these pore spaces to allow
transportation over large distances (permeability).
•A capacity to trap sufficient quantities of hydrocarbon to
prevent upward migration from the source beds.
5.
PorosityThe void spaces in the reservoir rocks are the inter granular
spaces between the sedimentary particles. Porosity is defined
as a percentage or fraction of void to the bulk volume of the
rock.
Porosity = 48%
6.
PorosityMeasurements of porosity are either done in the laboratory on
core samples whereby actual conditions are simulated as
closely as possible prior to measurement, or in-situ via suites of
electric logs such as Neutron, Density and Sonic Logs.
7.
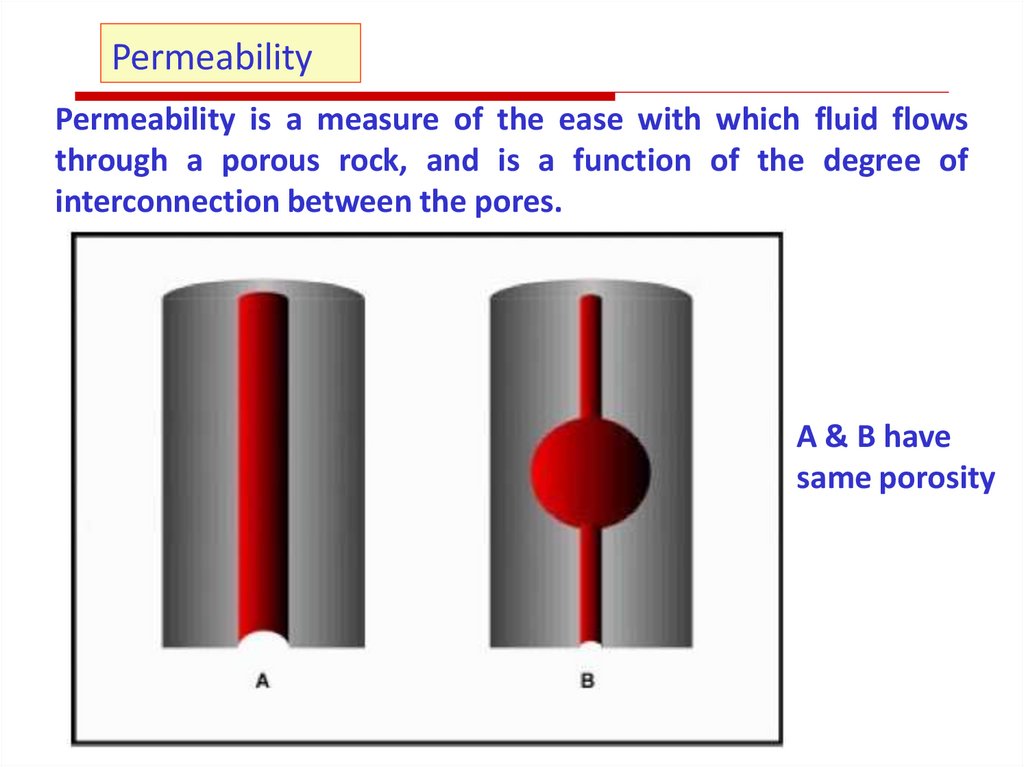
PermeabilityPermeability is a measure of the ease with which fluid flows
through a porous rock, and is a function of the degree of
interconnection between the pores.
A & B have
same porosity
8.
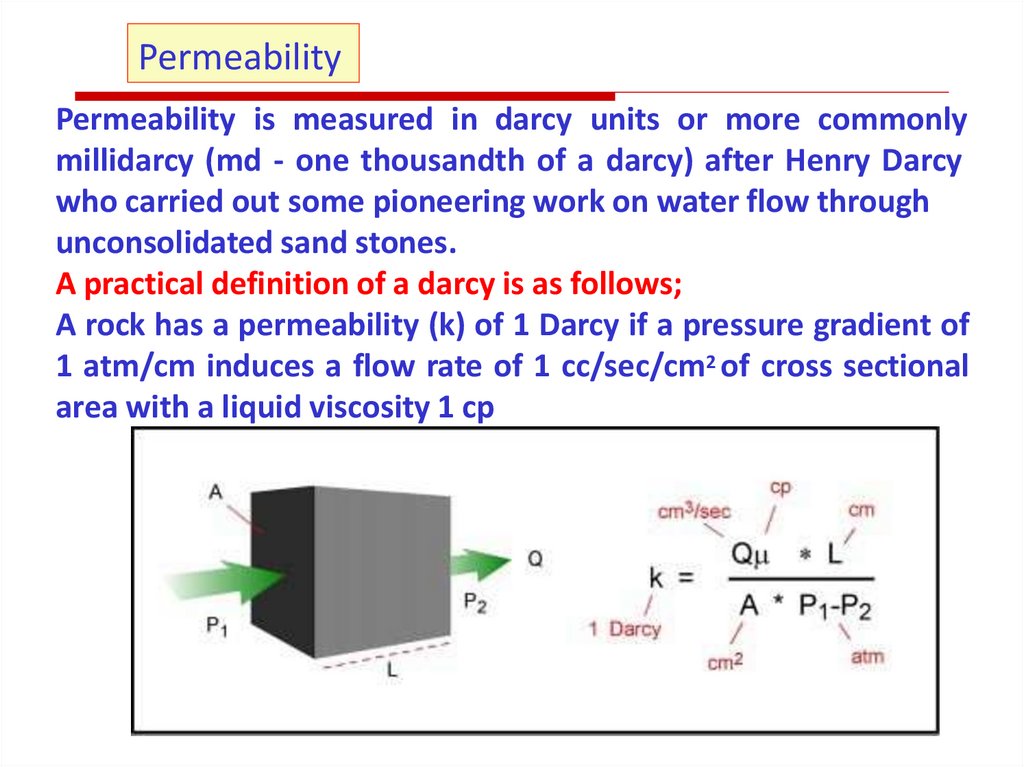
PermeabilityPermeability is measured in darcy units or more commonly
millidarcy (md - one thousandth of a darcy) after Henry Darcy
who carried out some pioneering work on water flow through
unconsolidated sand stones.
A practical definition of a darcy is as follows;
A rock has a permeability (k) of 1 Darcy if a pressure gradient of
1 atm/cm induces a flow rate of 1 cc/sec/cm2 of cross sectional
area with a liquid viscosity 1 cp
9.
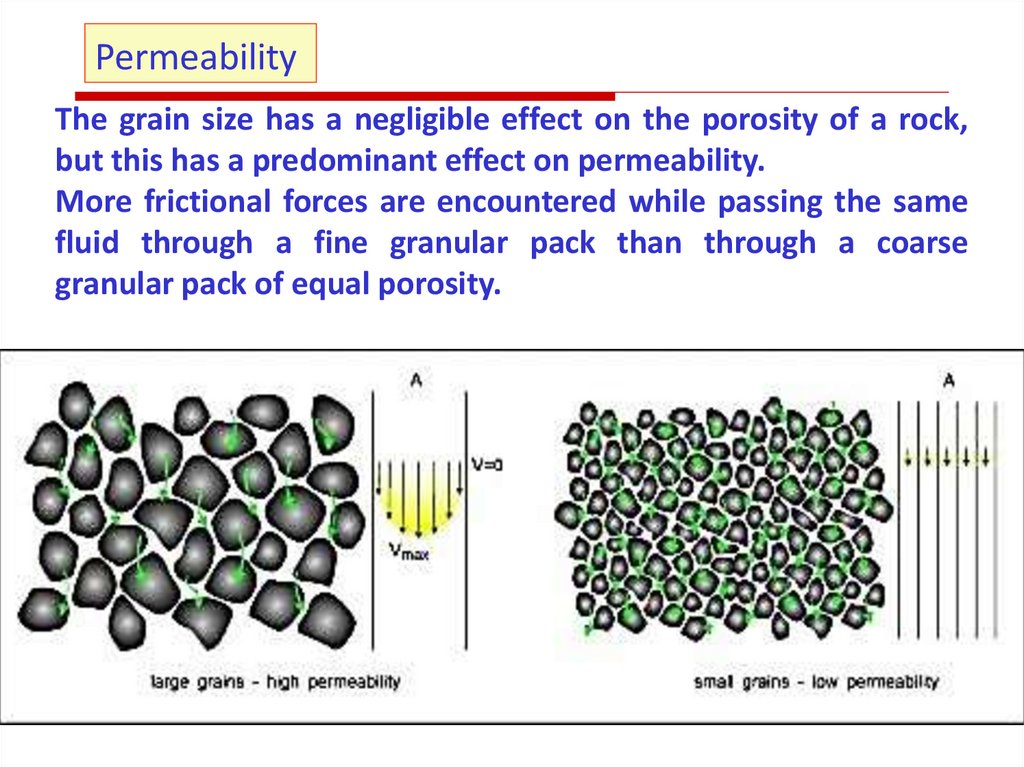
PermeabilityThe grain size has a negligible effect on the porosity of a rock,
but this has a predominant effect on permeability.
More frictional forces are encountered while passing the same
fluid through a fine granular pack than through a coarse
granular pack of equal porosity.
10.
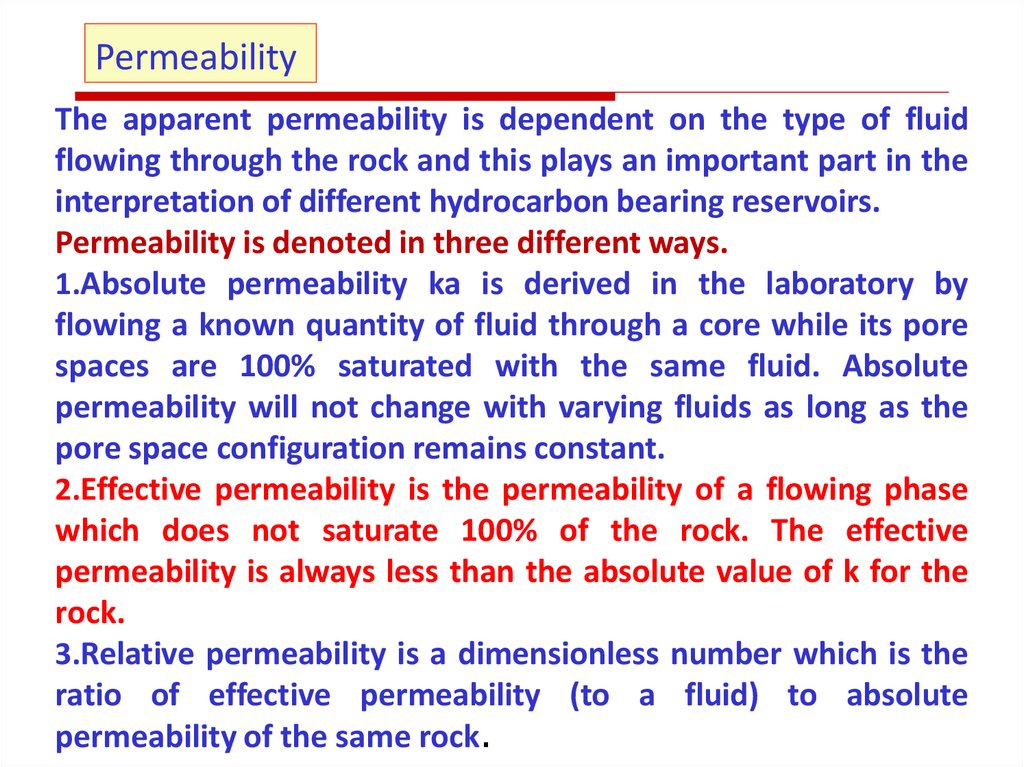
PermeabilityThe apparent permeability is dependent on the type of fluid
flowing through the rock and this plays an important part in the
interpretation of different hydrocarbon bearing reservoirs.
Permeability is denoted in three different ways.
1.Absolute permeability ka is derived in the laboratory by
flowing a known quantity of fluid through a core while its pore
spaces are 100% saturated with the same fluid. Absolute
permeability will not change with varying fluids as long as the
pore space configuration remains constant.
2.Effective permeability is the permeability of a flowing phase
which does not saturate 100% of the rock. The effective
permeability is always less than the absolute value of k for the
rock.
3.Relative permeability is a dimensionless number which is the
ratio of effective permeability (to a fluid) to absolute
permeability of the same rock.
11.
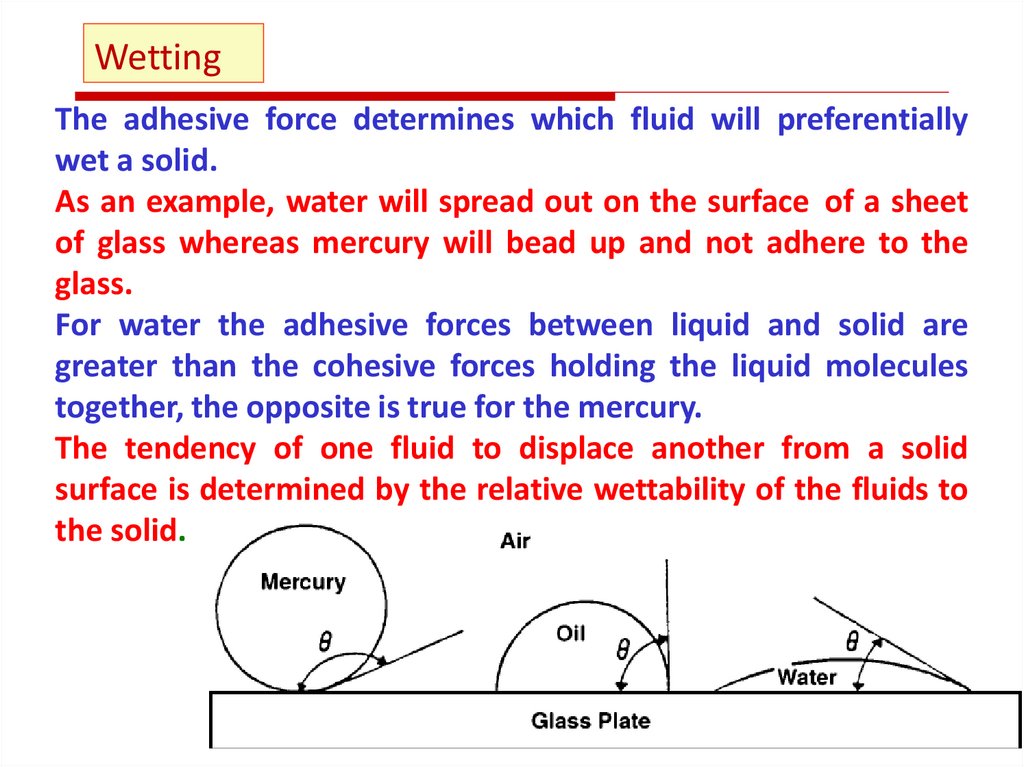
WettingThe adhesive force determines which fluid will preferentially
wet a solid.
As an example, water will spread out on the surface of a sheet
of glass whereas mercury will bead up and not adhere to the
glass.
For water the adhesive forces between liquid and solid are
greater than the cohesive forces holding the liquid molecules
together, the opposite is true for the mercury.
The tendency of one fluid to displace another from a solid
surface is determined by the relative wettability of the fluids to
the solid.
12.
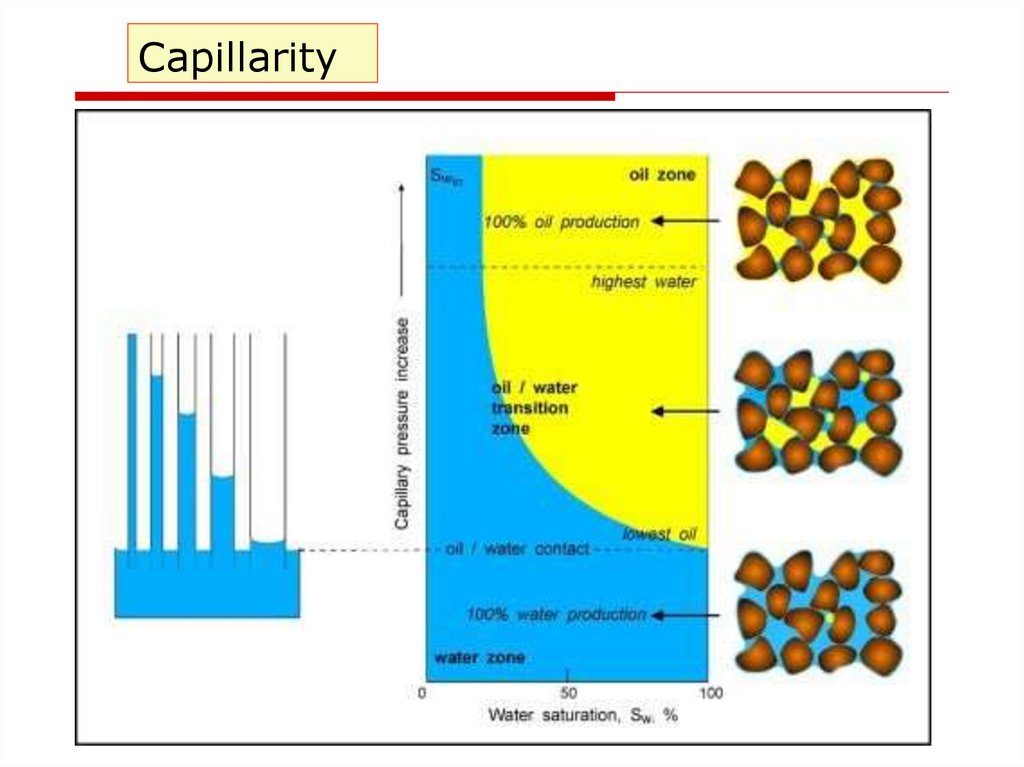
CapillarityWhen liquid wets the surface of a fine bore glass capillary tube,
surface tension around the circumference of the contact pulls
the liquid interface up the tube until an equilibrium is reached
with the downward force due to the liquid column height.
In the reservoir, although the pore spaces do not form the
uniform capillary tubes, they do interconnect to form a complex
capillary systems which in turn gives rise to capillary forces.
These forces can be measured under laboratory conditions for a
given rock – fluid(s) system and, in turn, the capillary height can
be calculated if the density difference of the fluid system is
known.
13.
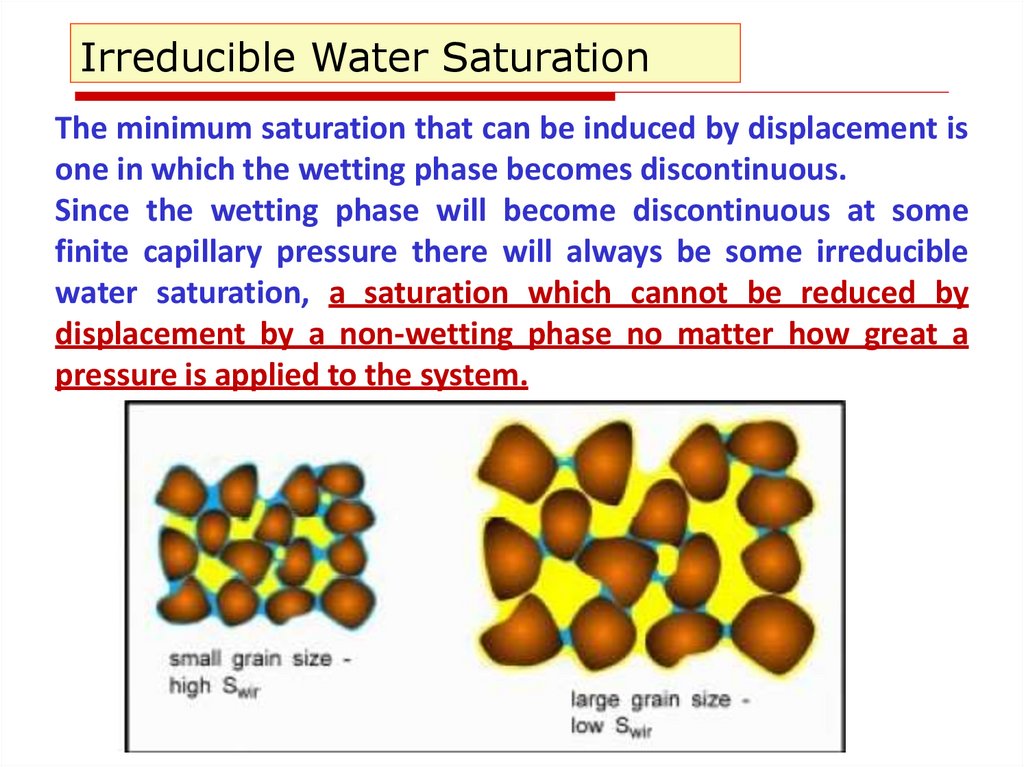
Irreducible Water SaturationThe minimum saturation that can be induced by displacement is
one in which the wetting phase becomes discontinuous.
Since the wetting phase will become discontinuous at some
finite capillary pressure there will always be some irreducible
water saturation, a saturation which cannot be reduced by
displacement by a non-wetting phase no matter how great a
pressure is applied to the system.
14.
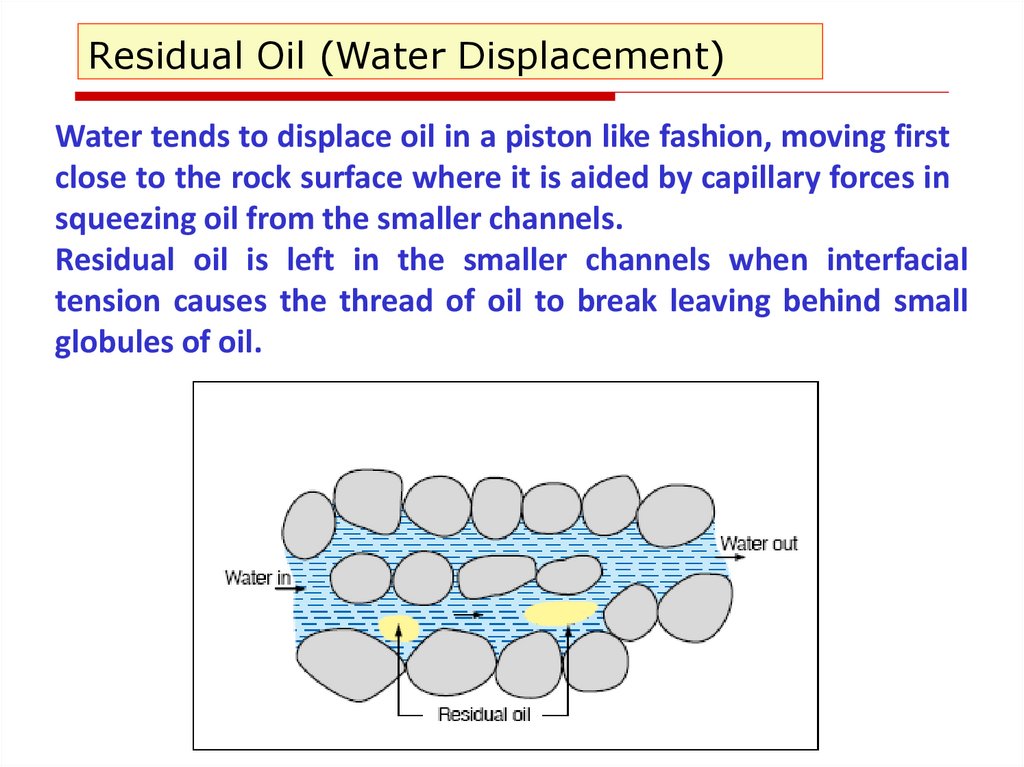
Residual Oil (Water Displacement)Water tends to displace oil in a piston like fashion, moving first
close to the rock surface where it is aided by capillary forces in
squeezing oil from the smaller channels.
Residual oil is left in the smaller channels when interfacial
tension causes the thread of oil to break leaving behind small
globules of oil.
15.
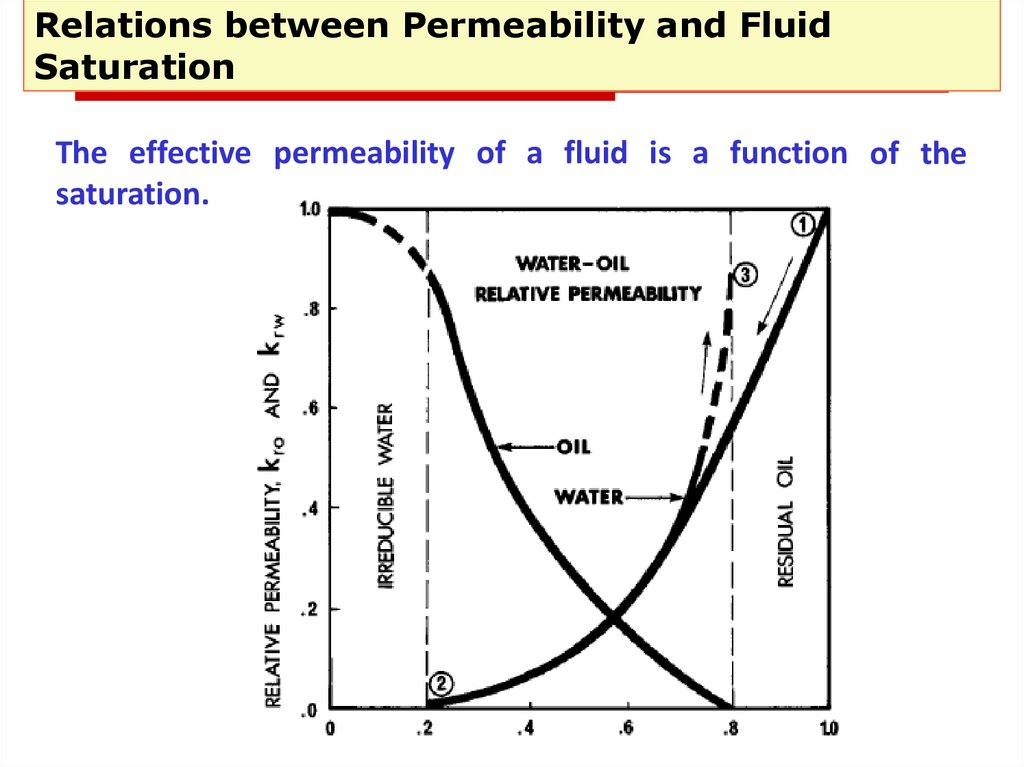
Relations between Permeability and FluidSaturation
The effective permeability of a fluid is a function of the
saturation.
16.
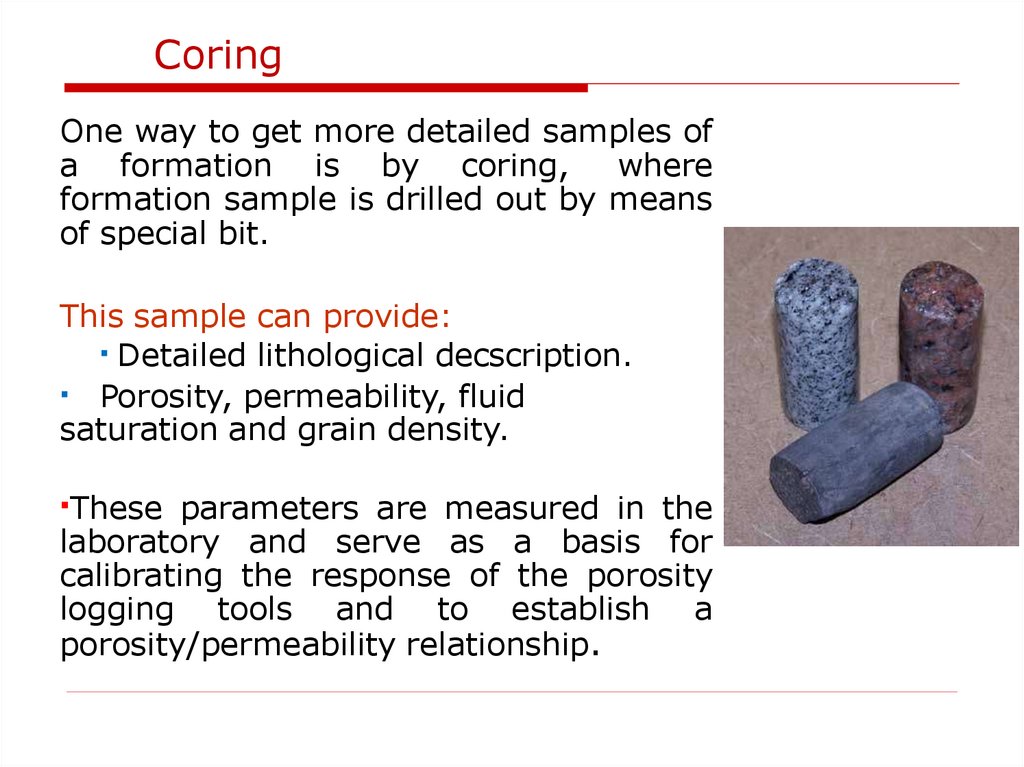
CoringOne way to get more detailed samples of
a formation is by coring,
where
formation sample is drilled out by means
of special bit.
This sample can provide:
▪ Detailed lithological decscription.
▪ Porosity, permeability, fluid
saturation and grain density.
▪These parameters are measured in the
laboratory and serve as a basis for
calibrating the response of the porosity
logging tools and to establish a
porosity/permeability relationship.
17.
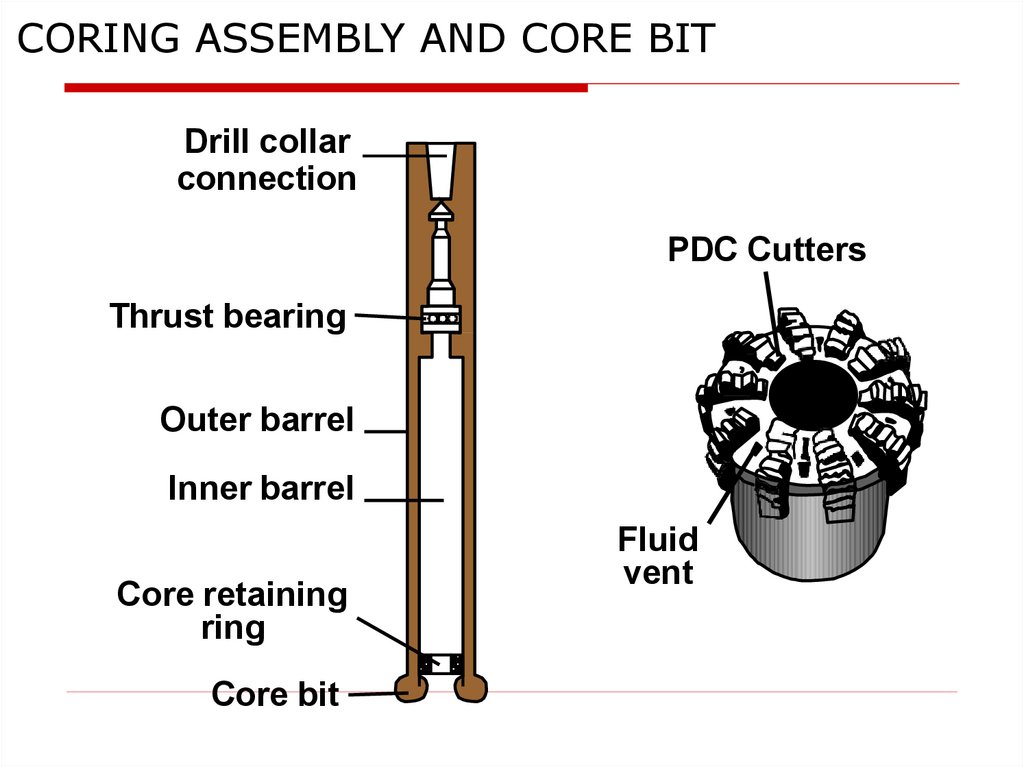
CORING ASSEMBLY AND CORE BITDrill collar
connection
PDC Cutters
Thrust bearing
Outer barrel
Inner barrel
Core retaining
ring
Core bit
Fluid
vent
18.
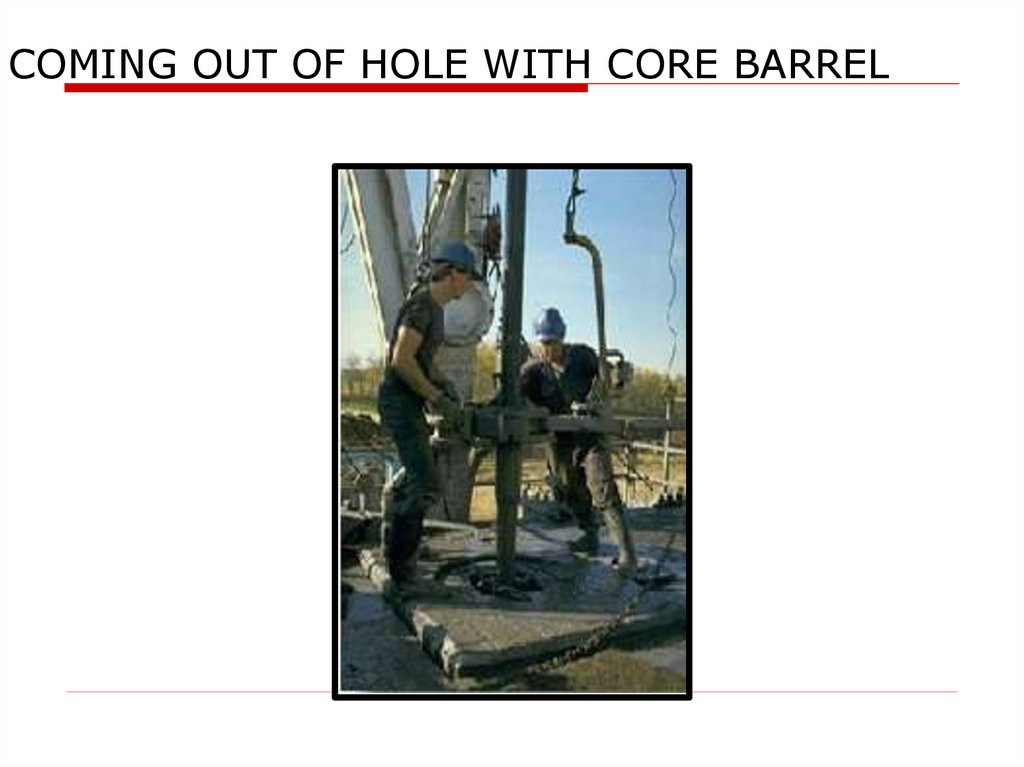
COMING OUT OF HOLE WITH CORE BARREL19.
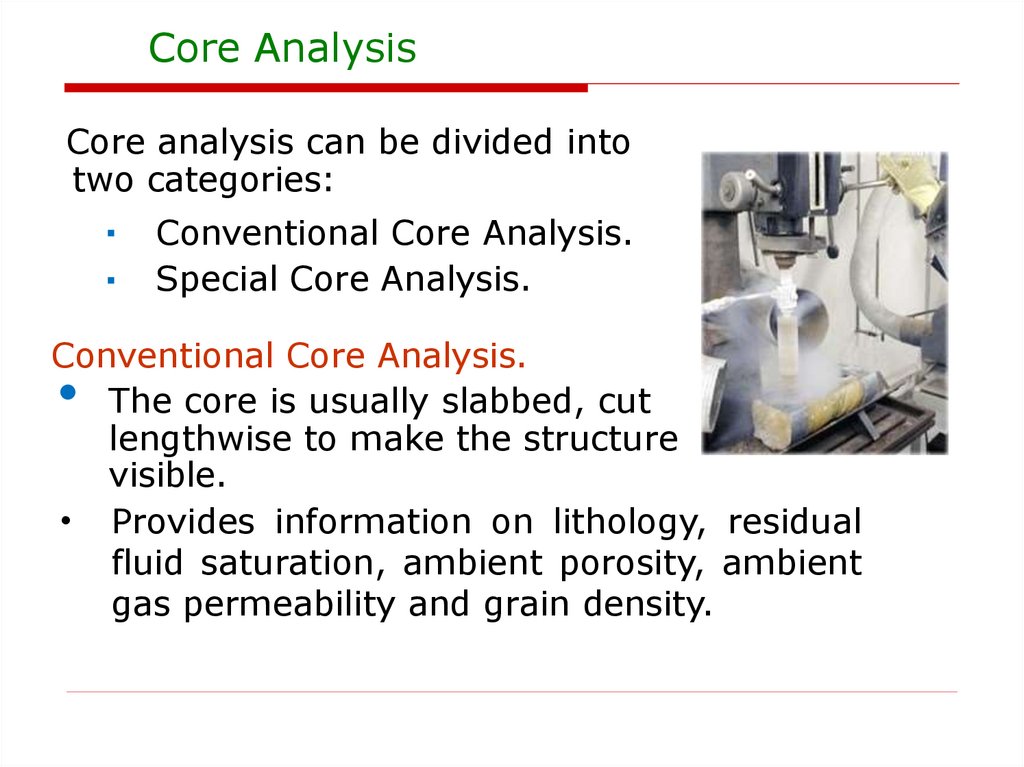
Core AnalysisCore analysis can be divided into
two categories:
▪ Conventional Core Analysis.
▪ Special Core Analysis.
Conventional Core Analysis.
The core is usually slabbed, cut
lengthwise to make the structure
visible.
• Provides information on lithology, residual
fluid saturation, ambient porosity, ambient
gas permeability and grain density.
20.
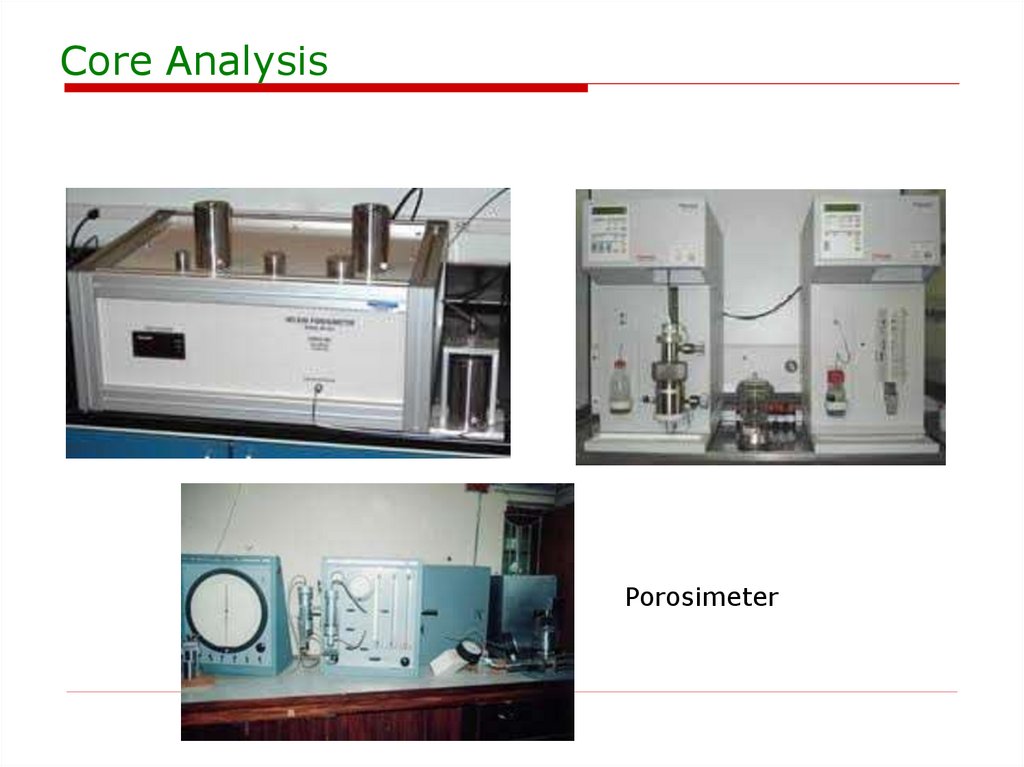
Core AnalysisGas Permeameter
Liquid Permeameter
21.
Core AnalysisPorosimeter
22.
Core AnalysisSpecial Core Analysis :
Provides the following information:
▪ Porosity and permeability at elevated
▪
▪
▪
▪
▪
confining stress.
Electrical properties such as formation factor
and resistivity index.
Capillary pressure.
Wettability and relative permeability.
Mechanical rock properties such as
compressibility.
Water flood sensitivity for injectivity and well
performance.
23.
Fluid Properties24.
Fluid PropertiesNaturally occurring petroleum accumulations are made up of
large number of organic compounds, primarily hydrocarbons.
Seldom are two crude oil samples identical and seldom are two
crude oils made up of the same proportions of the various
compounds.
Reasons to examine the Reservoir fluids
a)A chemical engineer may be interested in a crude oil’s
composition as to the amount of commercial products the oil
will yield after refining.
b)An exploration might have an interest in an oil or water’s
composition as it sheds light on the origin, maturation and
degradation of the oil for geological interpretation.
c)The petroleum engineer is particularly concerned to
determine their behavior under varying conditions of pressure
and temperature that occur in the reservoir and piping systems
during the production process.
25.
Products from Petroleum□ The distillation of crude oil results in various fractions
which boils at different temperatures
□ If the residue which remains after distillation is a wax like
solid consisting of largely of paraffin hydrocarbons the
crude is designated as paraffin base
□ If the residue is a black pitch like solid the crude is called
asphalt base
Various fractions of petroleum
Fractions obtained from distillation
Temperature Range
Petroleum Ether
Upto 160 0f
Gasoline
160-400 0f
Kerosene
400-575 0f
Fuel oil
Above 575 0f
26.
Requirements to Study the Reservoir Fluid BehaviorReservoir fluids are generally complex mixtures of
hydrocarbons existing as liquid-gas systems under
high pressures & temperatures
An important aspect of petroleum engineering is
predicting the future behavior of a petroleum reservoir
when it is put on production
Therefore, it is necessary to know the behavior of
reservoir fluids as a function of temperature and
pressure
To understand the behavior of complex systems
existing in petroleum reservoir, the derivations from
ideal behavior are used.
27.
Phase Behavior of Hydrocarbon SystemsA phase is a definite portion of a system which is homogeneous
throughout and can be separated from other phases by distinct
boundaries.
Solids, liquids and gases are phases of matter which can occur,
depending on pressure and temperature. Commonly, two or
three different fluid phases exist together in a reservoir.
Any analysis of reservoir fluids depends on the relationships
between pressure, volume and temperature of the fluids
commonly referred to as the PVT relationship.
It is customary to represent the phase behaviour of
hydrocarbon reservoir fluids on the P-T plane showing the limits
over which the fluid exists as a single phase and the proportions
of oil and gas in equilibrium over the two phase P-T range.
28.
Single Component SystemsSingle component hydrocarbons are not found in nature,
however it is beneficial to observe the behaviour of a pure
hydrocarbon under varying pressures and temperatures to gain
insight into more complex systems.
As an example, the PVT cell is charged with ethane at 60° F and
1000 psia. Under these conditions, ethane is in a liquid state. If
the cell volume is increased while holding the temperature
constant, the pressure will fall rapidly and first bubble of gas
appears. This is called the bubble point.
Further increases of cylinder volume at constant temperature
does not reduce the pressure. The gas volume increases until
the point is reached where all the liquid is vaporized. This is
called the dew point.
Further increase of cylinder volume results in a hyperbolic
reduction in pressure as the ethane gas expands.
29.
Single Component P-V30.
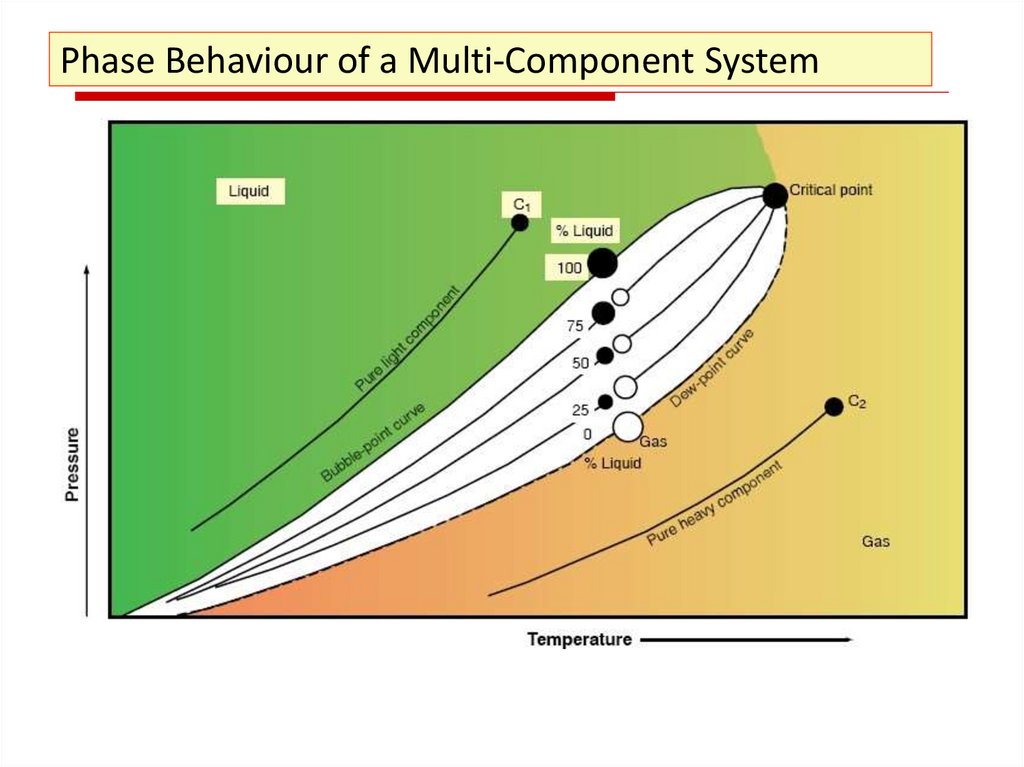
Phase Behaviour of a Multi-Component SystemConsider the phase behavior of a 50:50 mixture of two pure
hydrocarbon components on the P-T plane.
The vapor pressure and bubble point lines do not coincide but
form an envelope enclosing a broad range of temperatures and
pressures at which two phases (gas and oil) exist in equilibrium.
The dew and bubble point curves terminate at that
temperature and pressure at which liquid and vapour (gas)
phases have identical intensive properties, density, specific
volume, Etc.
31.
Phase Behaviour of a Multi-Component System32.
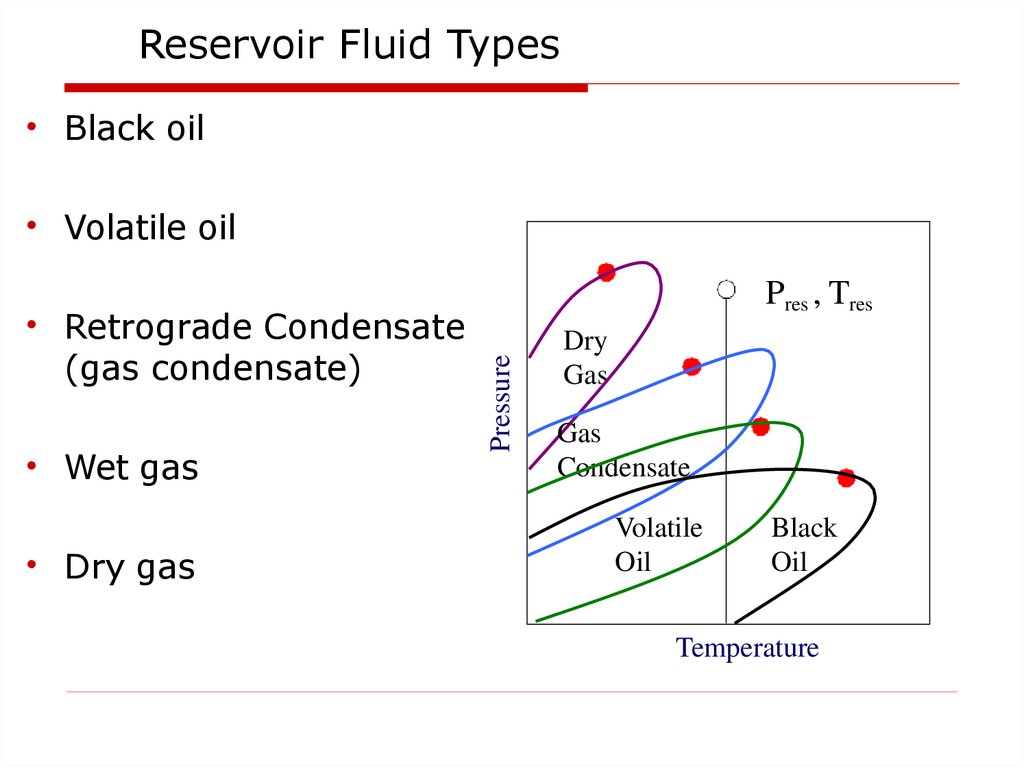
Reservoir Fluid Types• Black oil
• Volatile oil
• Wet gas
• Dry gas
Pressure
• Retrograde Condensate
(gas condensate)
Pres , Tres
Dry
Gas
Gas
Condensate
Volatile
Oil
Black
Oil
Temperature
33.
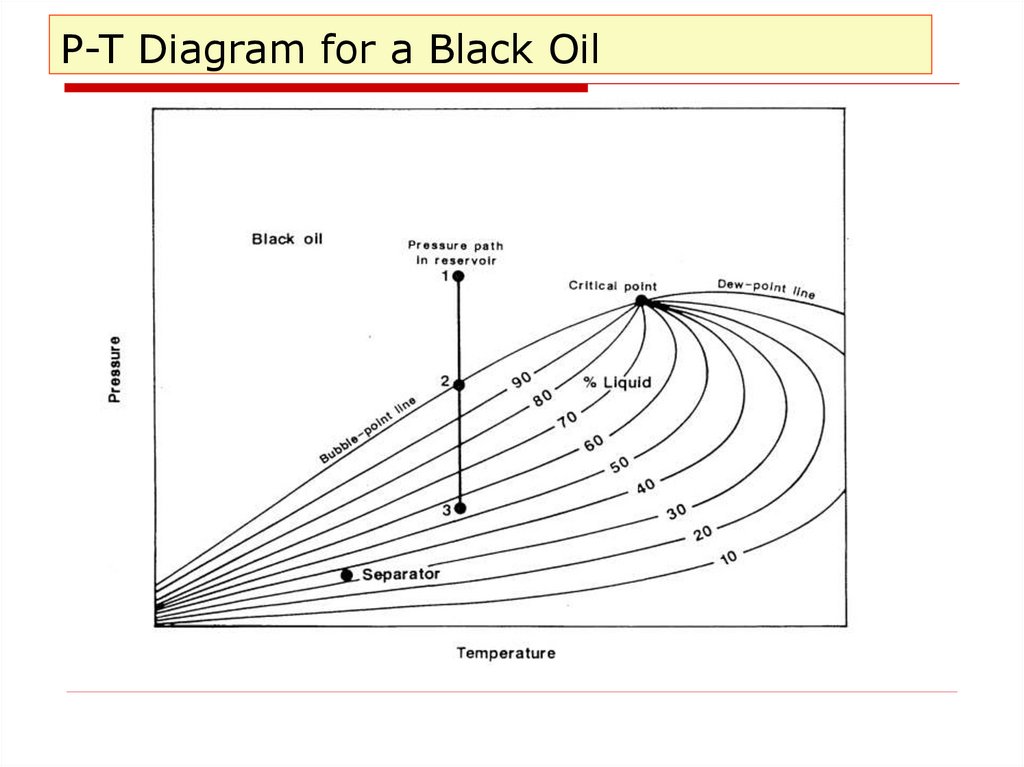
P-T Diagram for a Black Oil34.
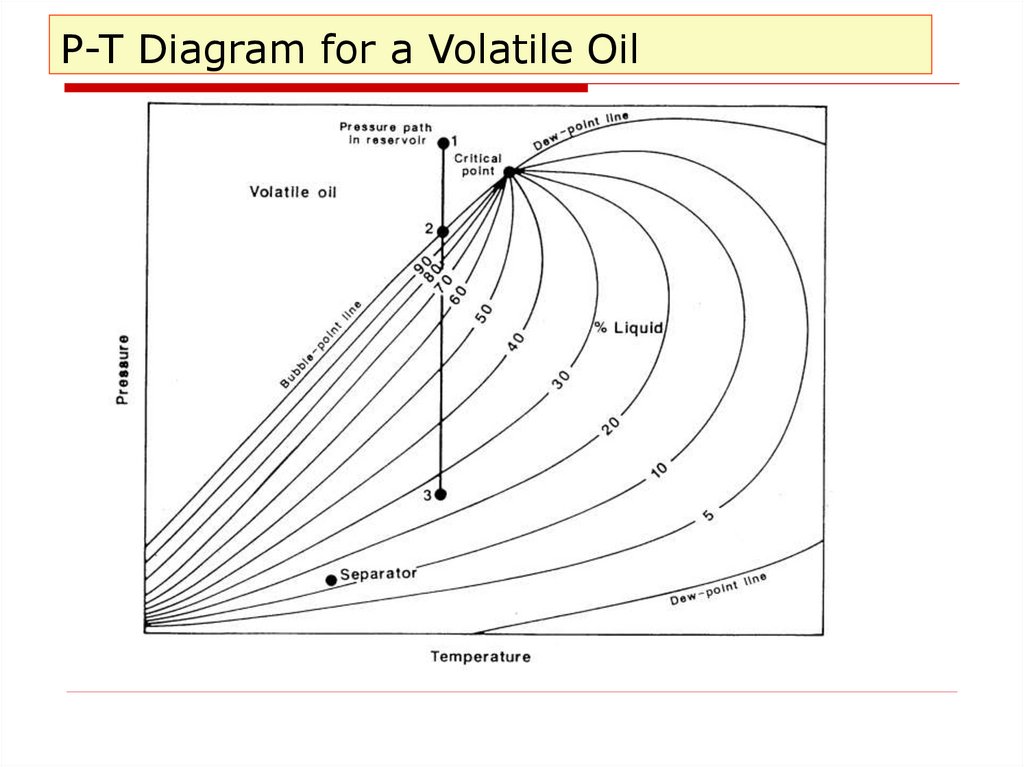
P-T Diagram for a Volatile Oil35.
P-T Diagram for gas condensate36.
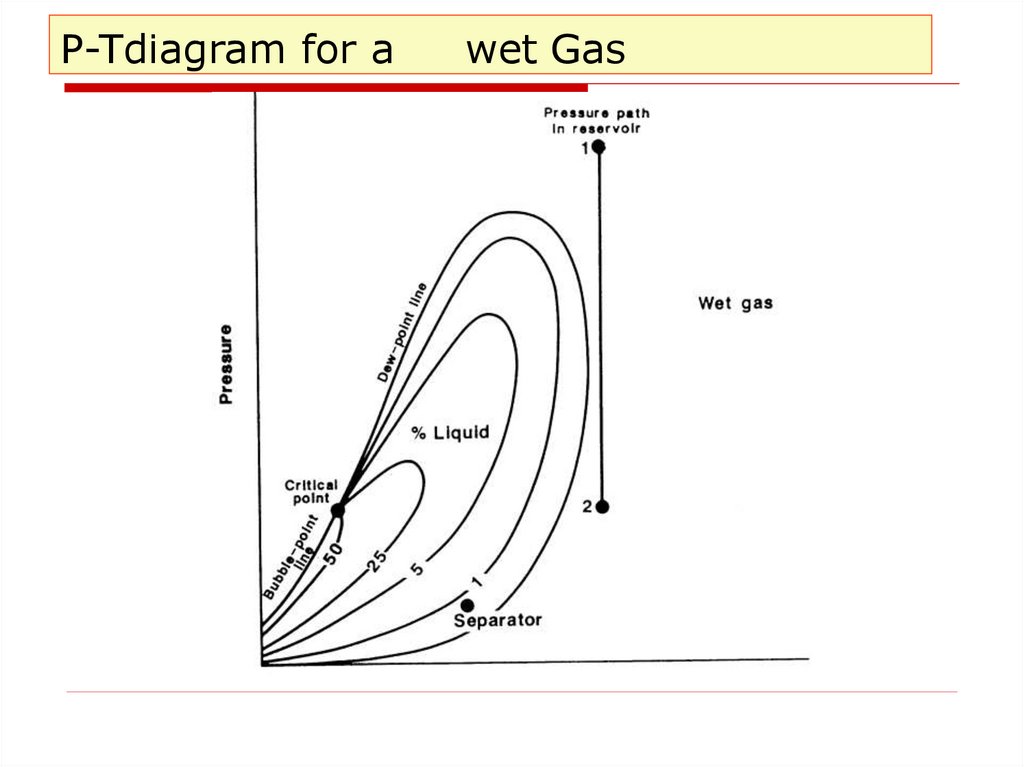
P-Tdiagram for awet Gas
37.
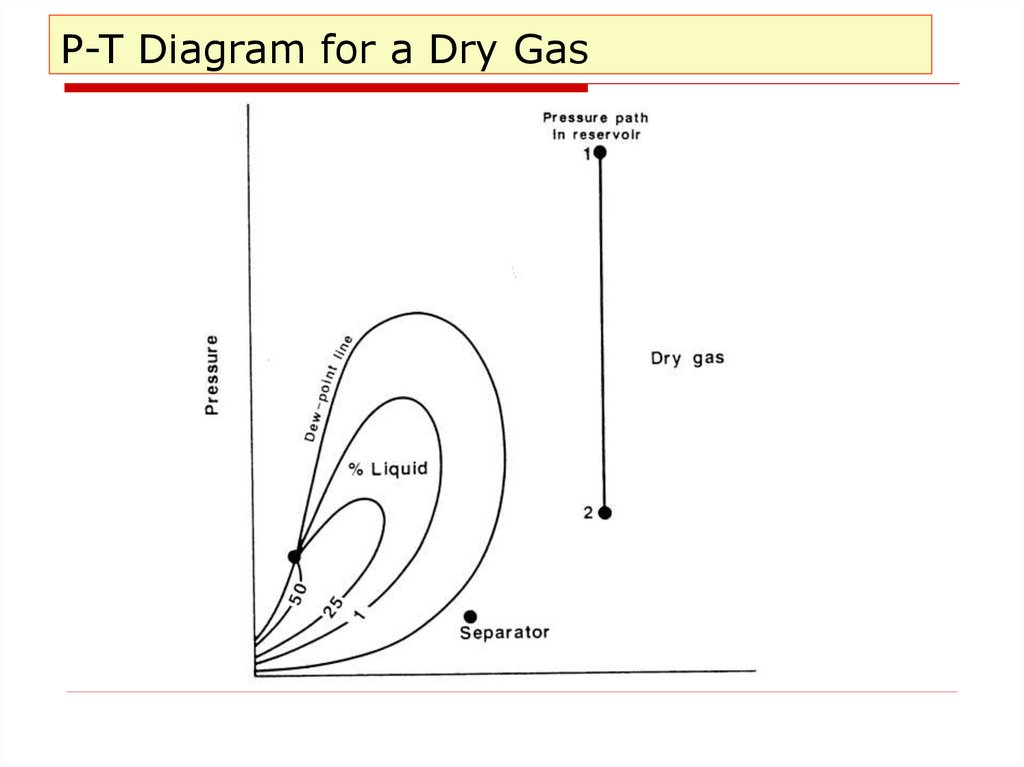
P-T Diagram for a Dry Gas38.
Reservoir Fluid Properties• Oil Compressibility
• Saturation Pressure
• Live Oil Viscosity
• Live Oil Density
• Oil Formation Volume Factor
• Gas-Oil Ratio
• Liberated Gas Formation Volume factor
• Incremental Liberated Gas-Gravity
• Cumulative liberated Gas-Gravity
39.
Sampling of Reservoir Fluids• The purpose of sampling is to obtain a representative
sample of reservoir fluid identical to the initial reservoir
fluid.
• For this reason, sampling operations should ideally be
conducted on virgin reservoirs (having not yet produced) or
in new wells completed in no depleted zones, containing
fluids identical to the initial reservoir fluids.
• If the production fluids are still identical to the initial fluids,
the sampling procedure will be very similar to that of new
wells.
• If the produced fluid is not identical to the fluid initially in
place in the reservoir, one cannot hope to obtain
representative samples.
40.
Well Conditioning for SamplingThe objective of well conditioning is to replace the nonrepresentative reservoir fluid located around the wellbore
with original reservoir fluid by displacing it into and up the
wellbore.
A flowing oil well is conditioned by producing it at
successively lower rates until the non representative oil has
been produced.
The well is considered to be conditioned when further
reductions in flow rate have no effect on the stabilized gas-oil
ratio.
Stable well conditions: Pressure, Rate, GOR, WGR,
Temperature
41.
Types of SamplingDownhole
DST strings
Wireline sample
Surface
Wellhead samples
Separator samples
42.
Sub-surface samplingfor Oil Reservoirs
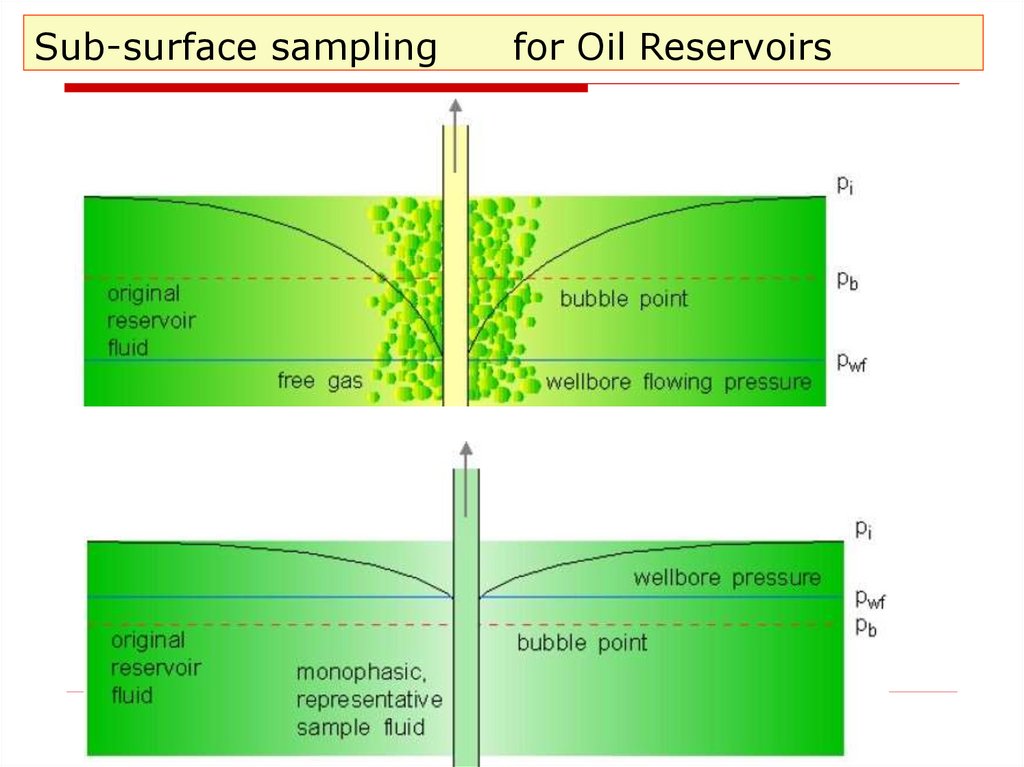
Subsurface samples are generally taken with the well shut-in.
The sample should be taken under single-phase conditions,
Pres > Pb
The well should be fully cleaned up
A static pressure gradient survey should be performed either
prior to or during sampling to check for the presence of water
at the bottom of the well
43.
Sub-surface samplingfor Oil Reservoirs
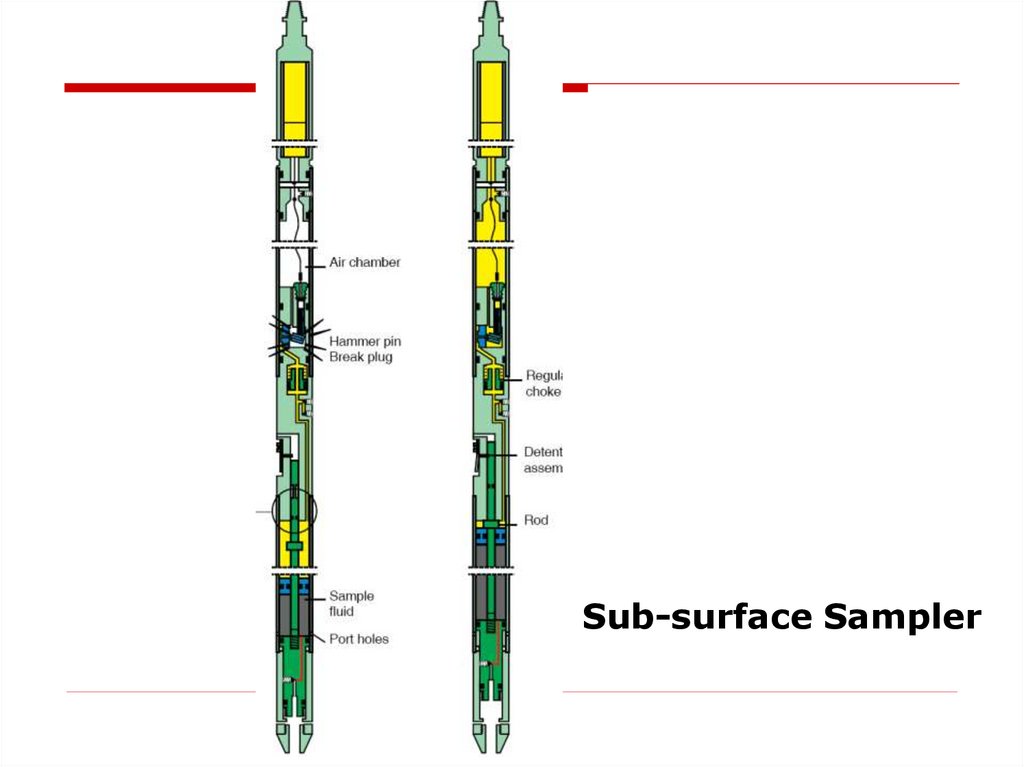
44.
Sub-surface Sampler45.
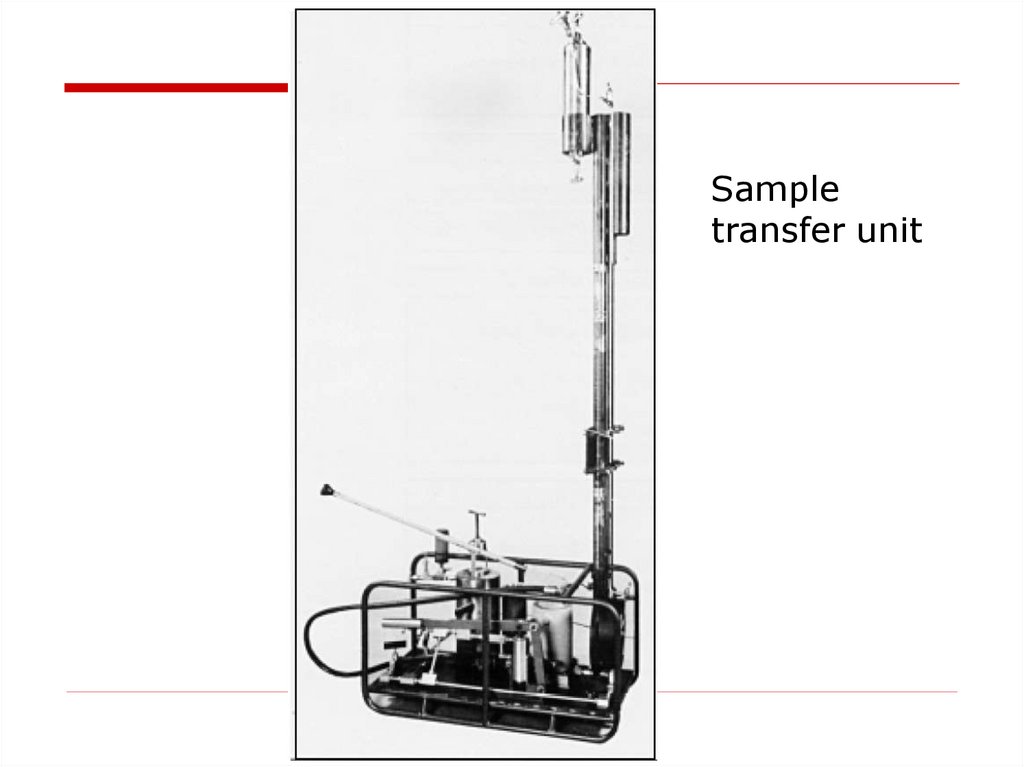
Sampletransfer unit
46.
Surface samplingfor Oil/gas Reservoirs
Sampling at the wellhead
Valid fluid samples are only likely to be obtained if the
fluid is single-phase at the wellhead
Poses safety hazards (high-pressure fluid...)
Sampling at the separator
Easier, safer, cheaper
Only reliable surface method if fluid is two-phase at the
wellhead
47.
Wellhead samplingSample point should be as near wellhead as possible, and
upstream of choke manifold
It is possible to obtain mono phasic wellhead samples for
very high pressure gas condensates
Pres = 15,000 psia
Pwh = 11,000 psia
Pdew = 5500 psia
But beware of flashing occurring at sample point
48.
Separator samplingThe most important factor in separator sampling is
stability of conditions
Stabilised gas and oil flow rates (and therefore GOR)
Stabilised temperature
Stabilised wellhead pressure
Gas and liquid samples should be taken simultaneously,
as they are a matched pair
Oil and gas rates must be measured carefully
Sample points must be as close to the separator as
possible
49.
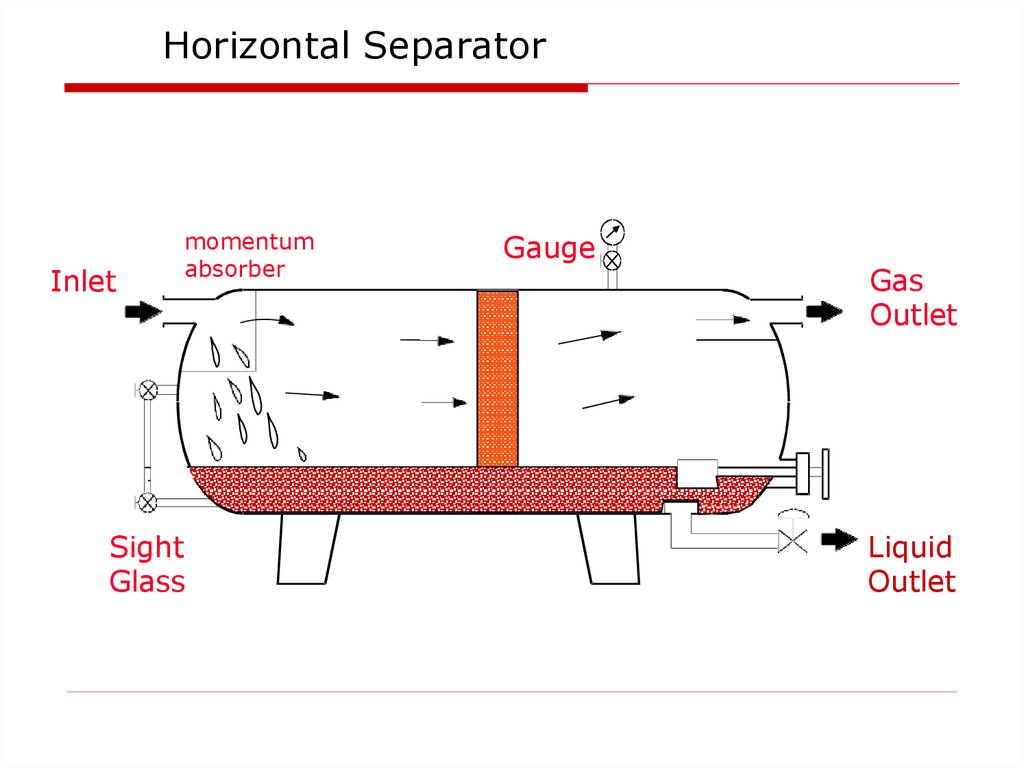
Horizontal SeparatorInlet
momentum
absorber
Sight
Glass
Gauge
Gas
Outlet
Liquid
Outlet
50.
Sample TransferSingle-phase sub-surface samples become two-phase as
they are brought to surface as a result of a large reduction
in pressure due to cooling
The sample chamber must be re-pressured to singlephase conditions prior to transfer to sample bottles
Single-phase positive displacement samplers are now
common place, and maintain single-phase conditions in
the chamber as it is brought to surface
51.
Gas-Condensate SamplingSub-surface sampling is generally not the preferred method
in condensate reservoirs
Well-head sampling preferred if single-phase
Separator sampling preferred for other cases
If Pwf < Pdew, the choice of flow-rate during sampling is a
balance between the following:
High rates cause excessive liquid drop-out in the
reservoir
•Low rates prevent liquids formed in the wellbore from being
produced to surface
52.
Recombination of surfaceSample
Separator samples are recombined using the ratio calculated
from measured gas and liquid flow-rates
Care must also be taken to preserve consistency between
field and laboratory values of separator liquid shrinkage
In what ratio should the oil and gas samples be recombined?
53.
The PVT CellUsed for examining the behaviour of fluids at reservoir
pressures and temperatures
Temperature thermostatically controlled
The volume of the cell can be changed by using a positive
displacement pump
Sampling points are provided
Most cells are fitted with an observation window
54.
Basic PVT Experiments□ Constant Composition Expansion (CCE)
□ Constant Volume Depletion (CVD)
□ Differential Vaporisation (Liberation) (DV)
□ Multi-stage Separator Tests
55.
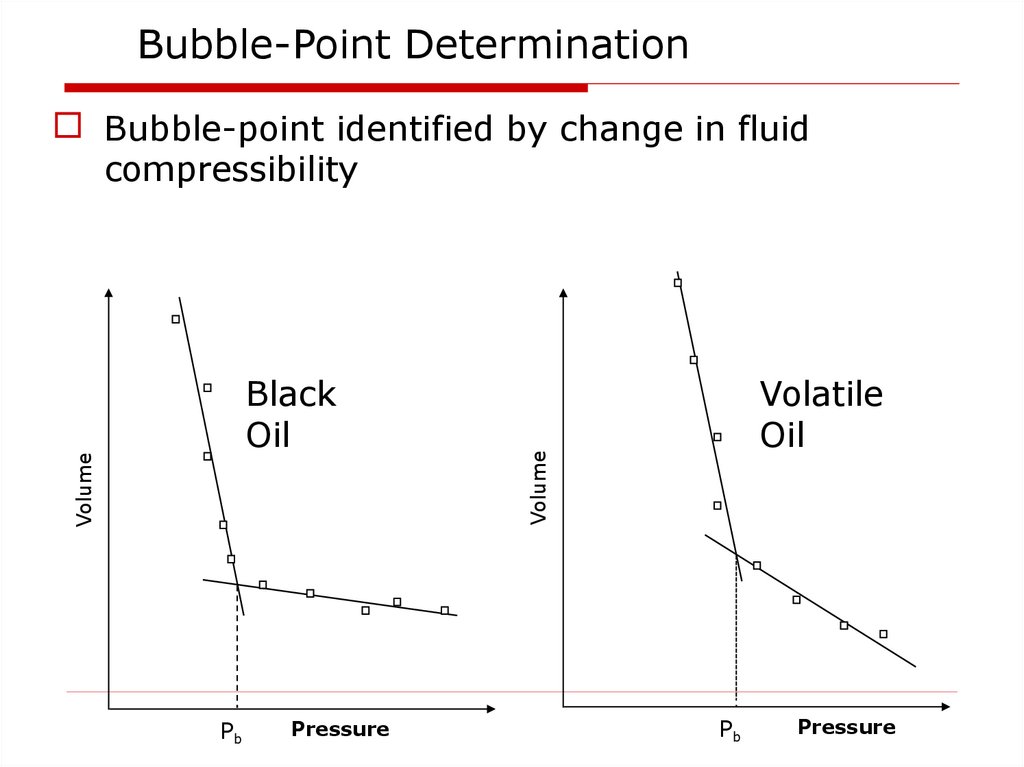
Bubble-Point Determination□ Bubble-point identified by change in fluid
compressibility
Pb
Pressure
Volatile
Oil
Volume
Volume
Black
Oil
Pb
Pressure
56.
Isothermal Flash□ The Isothermal Flash is the basis for most
laboratory PVT experiments
□ Single-phase fluid is loaded into the PVT cell at
temperature T and pressure P1
□ The temperature is kept constant throughout
the experiment (PVT cell is placed in a heat
bath)
□ The fluid is expanded to a new pressure P2
(P2<P1)
□ The flash results in a change in total volume
and may result in phase changes
57.
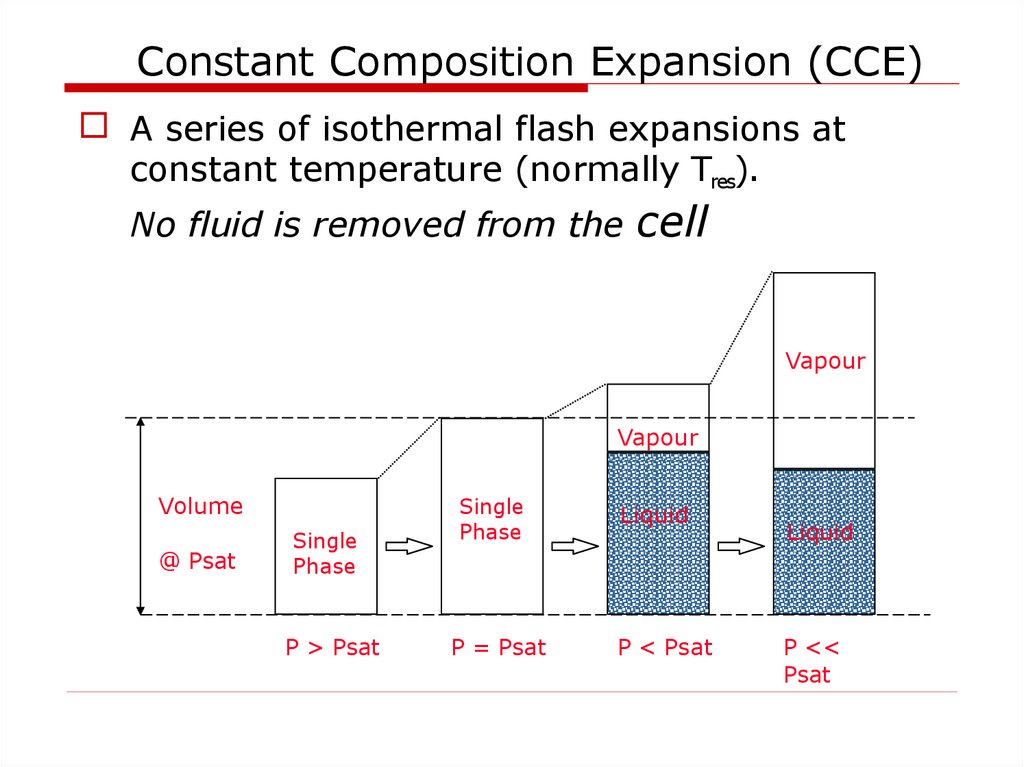
Constant Composition Expansion (CCE)□ A series of isothermal flash expansions at
constant temperature (normally Tres).
No fluid is removed from the cell
Vapour
Vapour
Volume
@ Psat
Single
Phase
P > Psat
Single
Phase
Liquid
P = Psat
P < Psat
Liquid
P <<
Psat
58.
Constant Volume Depletion (CVD)□ A series of flash expansions at T
□ At each pressure, vapour is withdrawn to
restore original cell volume at Psat
Vapour
Vapour
Vapour
Vapour
Vapour
Psat
Vapour
Vapour
Liquid
Liquid
Liquid
Liquid
P1
P1
P2
P2
59.
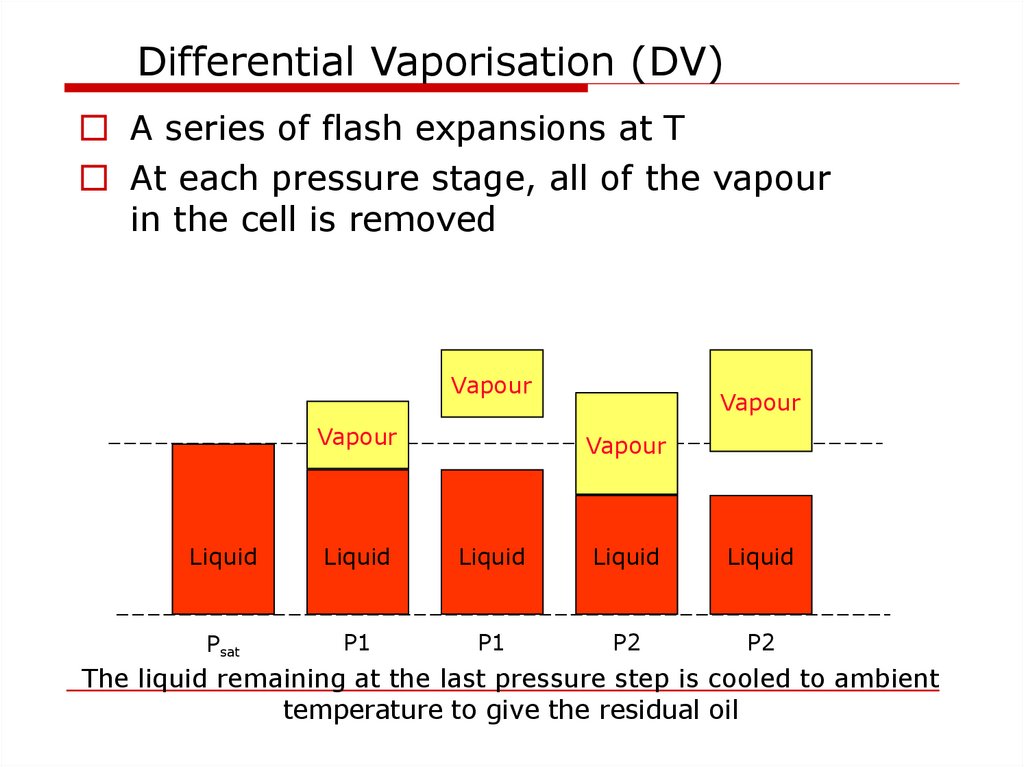
Differential Vaporisation (DV)□ A series of flash expansions at T
□ At each pressure stage, all of the vapour
in the cell is removed
Vapour
Vapour
Vapour
Vapour
Liquid
Liquid
Liquid
Liquid
Liquid
Psat
P1
P1
P2
P2
The liquid remaining at the last pressure step is cooled to ambient
temperature to give the residual oil
60.
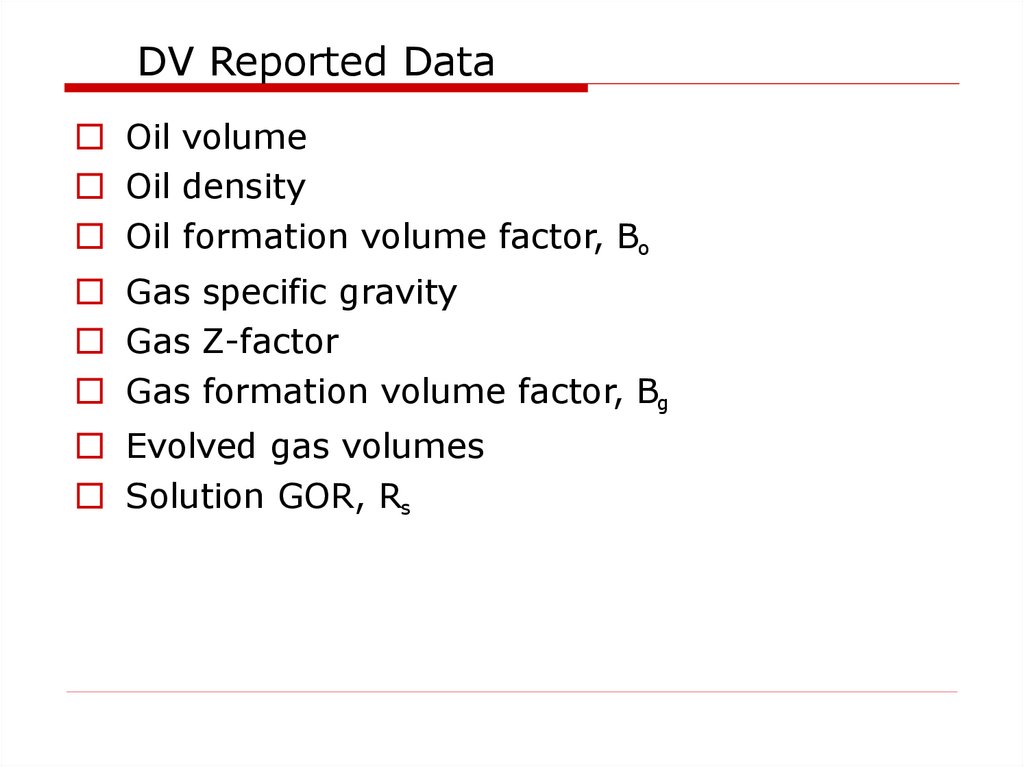
DV Reported Data□ Oil volume
□ Oil density
□ Oil formation volume factor, Bo
□ Gas specific gravity
□ Gas Z-factor
□ Gas formation volume factor, Bg
□ Evolved gas volumes
□ Solution GOR, Rs
61.
Drive mechanism62.
Reservoir Drive MechanismsWhat causes oil to flow from reservoirs?
Pressure difference between reservoir fluids and the
wellbore pressure
If reservoir pressure declines quickly, recovery by
natural flow will be small
There are several ways in which oil can be displaced
and produced from a reservoir, and these may be
termed mechanisms or “drives”.
Where one replacement mechanism is dominant, the
reservoir may be said to be operating under a
particular “drive.”
63.
Reservoir Drive MechanismsFor the proper understanding of reservoir behavior
and predicting future performance, it is necessary to
have knowledge of the driving mechanism that
controls the behavior of fluids within reservoirs.
Overall performance of the oil reservoir is largely
determined by the nature of the energy ( driving
mechanism) available for moving the oil to the
wellbore
Where does this energy come from???
64.
Reservoir Drive MechanismsPossible sources of replacement for produced fluids are:
a)Expansion of under saturated oil above the bubble
point.
b) Expansion of rock and of connate water.
c)Expansion of gas released from solution in the oil
below the bubble point.
d)Invasion of the original oil bearing reservoir by the
expansion of the gas from a free gas cap.
e)Invasion of the original oil bearing reservoir by the
expansion of the water from an adjacent or underlying
aquifer.
65.
Understanding the Reservoir Drive MechanismThe recovery of oil by any of the natural drive
mechanisms is called primary recovery. During primary
recovery, hydrocarbons are produced from reservoir
without the use of any process (such as fluid injection)
to supplement the natural energy of the reservoir.
Each drive mechanism has certain typical performance
in terms of:
Pressure-decline rate
Gas-oil ratio
Water production
Ultimate recovery factor
66.
SOURCES OF RESERVOIR ENERGY❖ GAS DISSOLVED IN OIL
❖ OIL OVERLAIN BY FREE GAS
❖ OIL UNDERLAIN BY COMPRESSED WATER
❖ GRAVITY FORCE, &
❖ COMBINATION OF THE ABOVE
67.
RESERVOIR DRIVE MECHANISM- TypesIn oil reservoirs, there are basically six drive
mechanisms that provide the natural energy
necessary for recovery:
• Depletion drive
• Gas cap drive
• Water drive
• Gravity drainage drive
• Combination drive
• Liquid expansion and rock compaction drive
68.
DEPLETION DRIVE MECHANISMIn this type of reservoir, the principal source of
energy is a result of gas liberation from the crude oil
and the subsequent expansion of the solution gas as
the reservoir pressure is reduced.
If a reservoir at its bubble point is put on production,
the pressure will fall below the bubble point pressure
and gas will come out of solution. Initially, this gas
may be dispersed, discontinuous phase, but, in any
case, gas will be essentially immobile until some
minimum saturation or critical gas saturation, is
attained.
69.
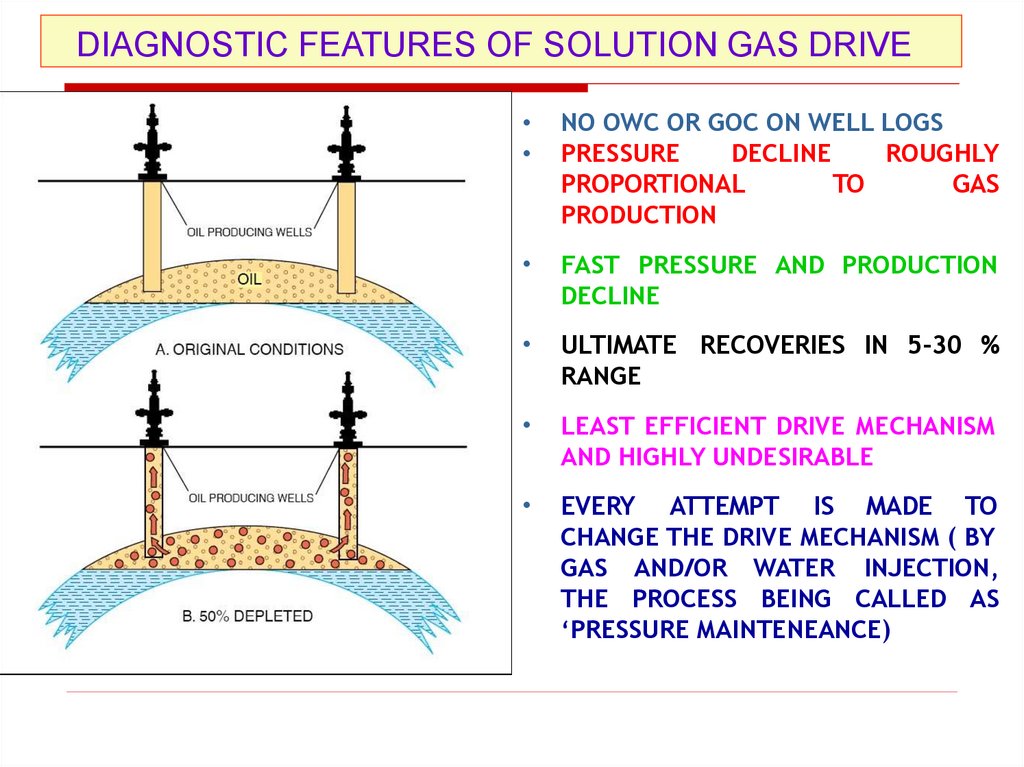
DIAGNOSTIC FEATURES OF SOLUTION GAS DRIVENO OWC OR GOC ON WELL LOGS
PRESSURE
DECLINE
ROUGHLY
PROPORTIONAL
TO
GAS
PRODUCTION
FAST PRESSURE AND PRODUCTION
DECLINE
ULTIMATE RECOVERIES IN 5-30 %
RANGE
LEAST EFFICIENT DRIVE MECHANISM
AND HIGHLY UNDESIRABLE
EVERY ATTEMPT IS MADE TO
CHANGE THE DRIVE MECHANISM ( BY
GAS AND/OR WATER INJECTION,
THE PROCESS BEING CALLED AS
‘PRESSURE MAINTENEANCE)
70.
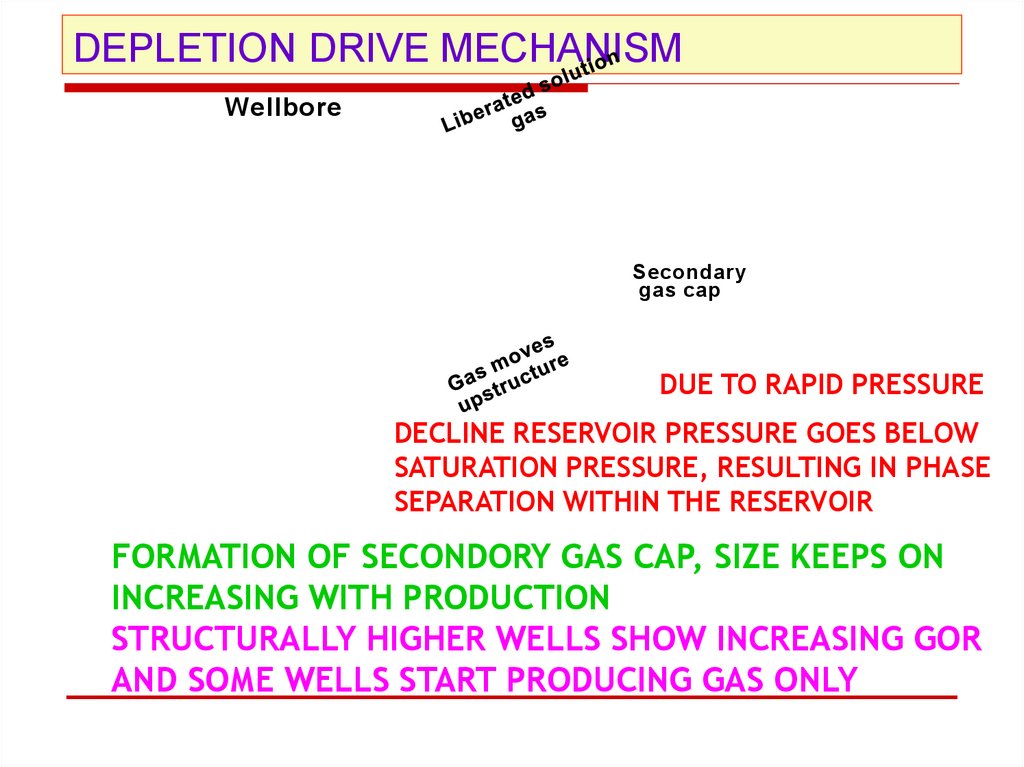
DEPLETION DRIVE MECHANISMWellbore
Secondary
gas cap
DUE TO RAPID PRESSURE
DECLINE RESERVOIR PRESSURE GOES BELOW
SATURATION PRESSURE, RESULTING IN PHASE
SEPARATION WITHIN THE RESERVOIR
FORMATION OF SECONDORY GAS CAP, SIZE KEEPS ON
INCREASING WITH PRODUCTION
STRUCTURALLY HIGHER WELLS SHOW INCREASING GOR
AND SOME WELLS START PRODUCING GAS ONLY
71.
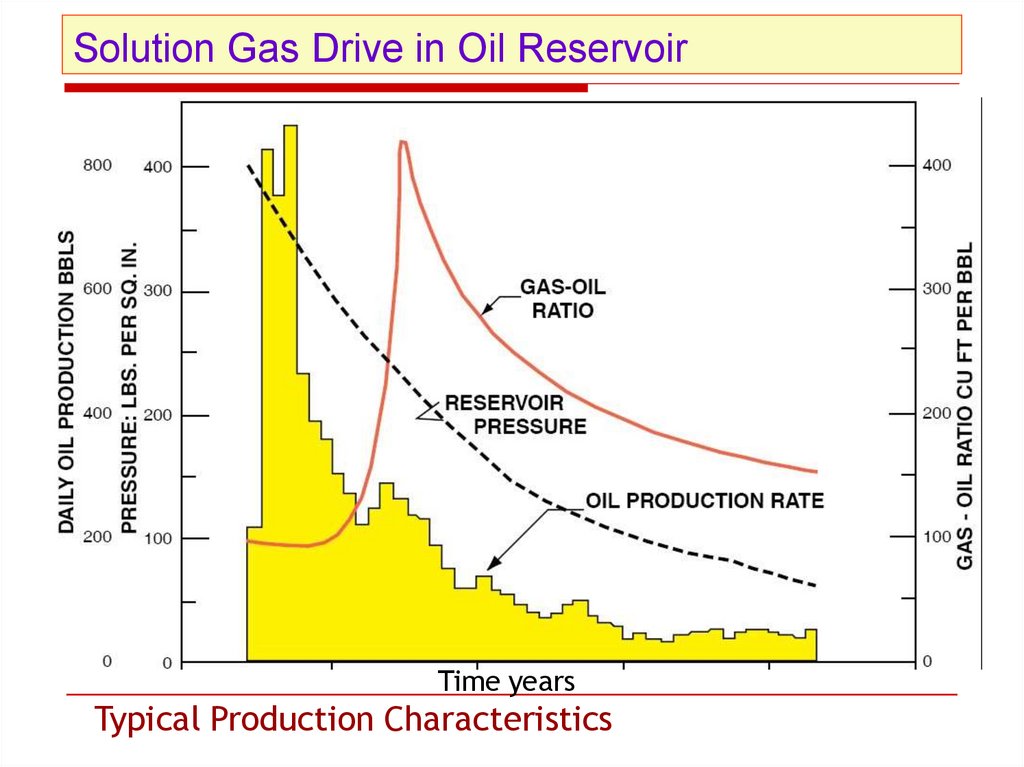
Solution Gas Drive in Oil ReservoirTime years
Typical Production Characteristics
72.
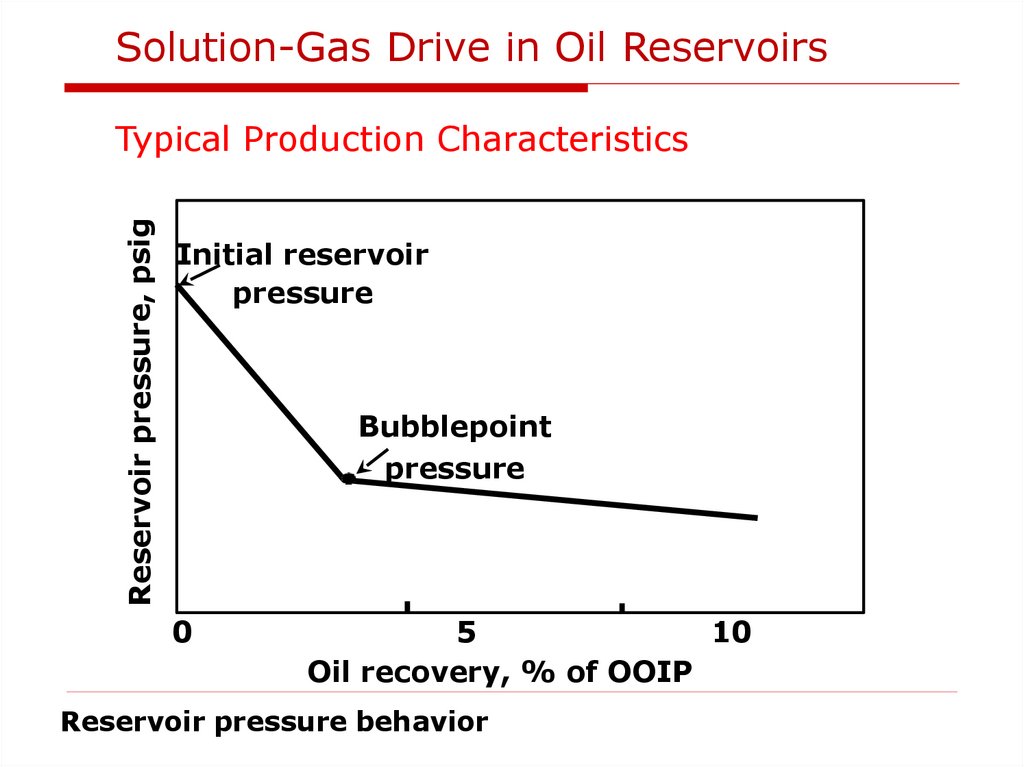
Solution-Gas Drive in Oil ReservoirsReservoir pressure, psig
Typical Production Characteristics
Initial reservoir
pressure
Bubblepoint
pressure
0
5
10
Oil recovery, % of OOIP
Reservoir pressure behavior
73.
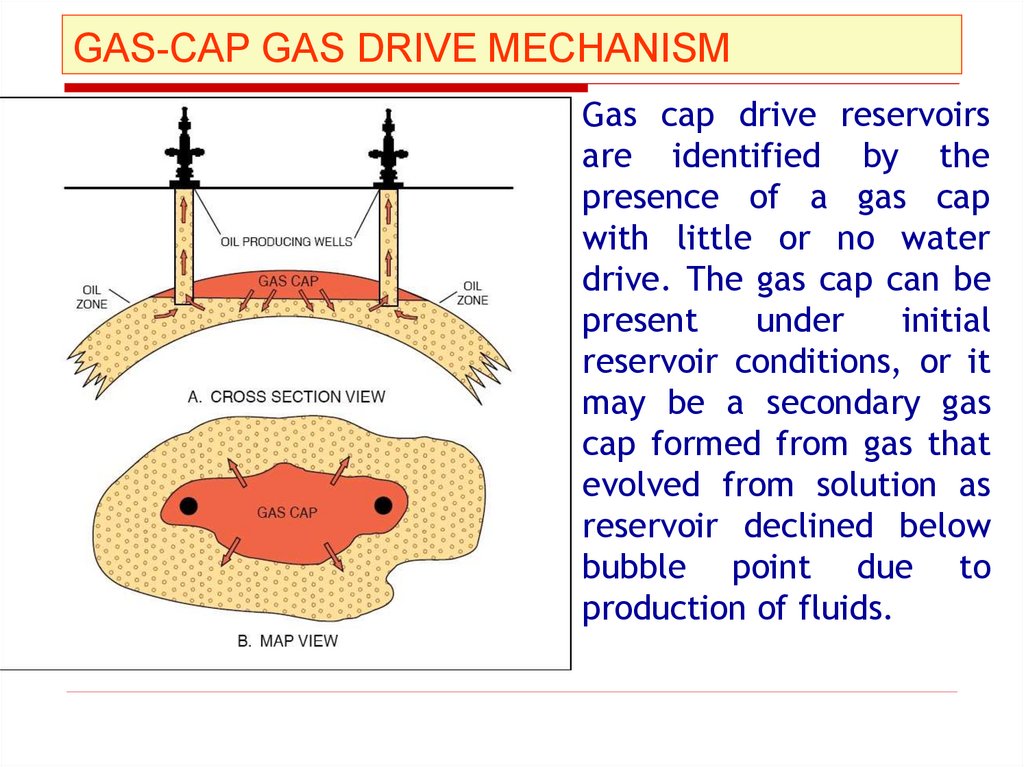
GAS-CAP GAS DRIVE MECHANISMGas cap drive reservoirs
are identified by the
presence of a gas cap
with little or no water
drive. The gas cap can be
present
under
initial
reservoir conditions, or it
may be a secondary gas
cap formed from gas that
evolved from solution as
reservoir declined below
bubble point due to
production of fluids.
74.
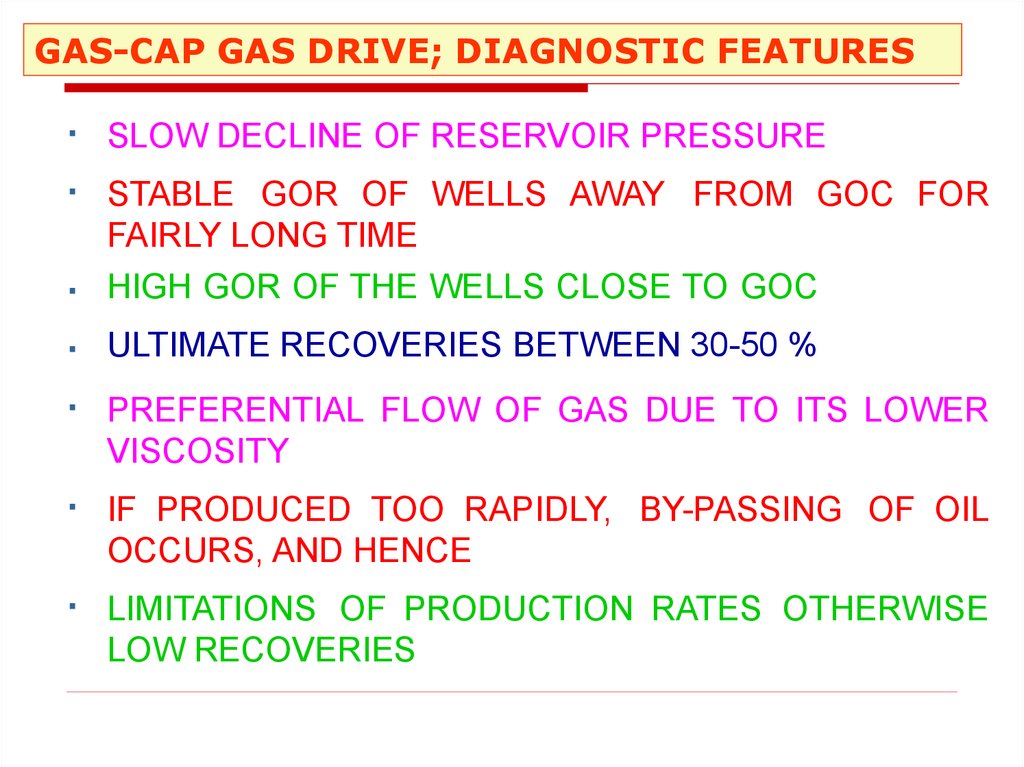
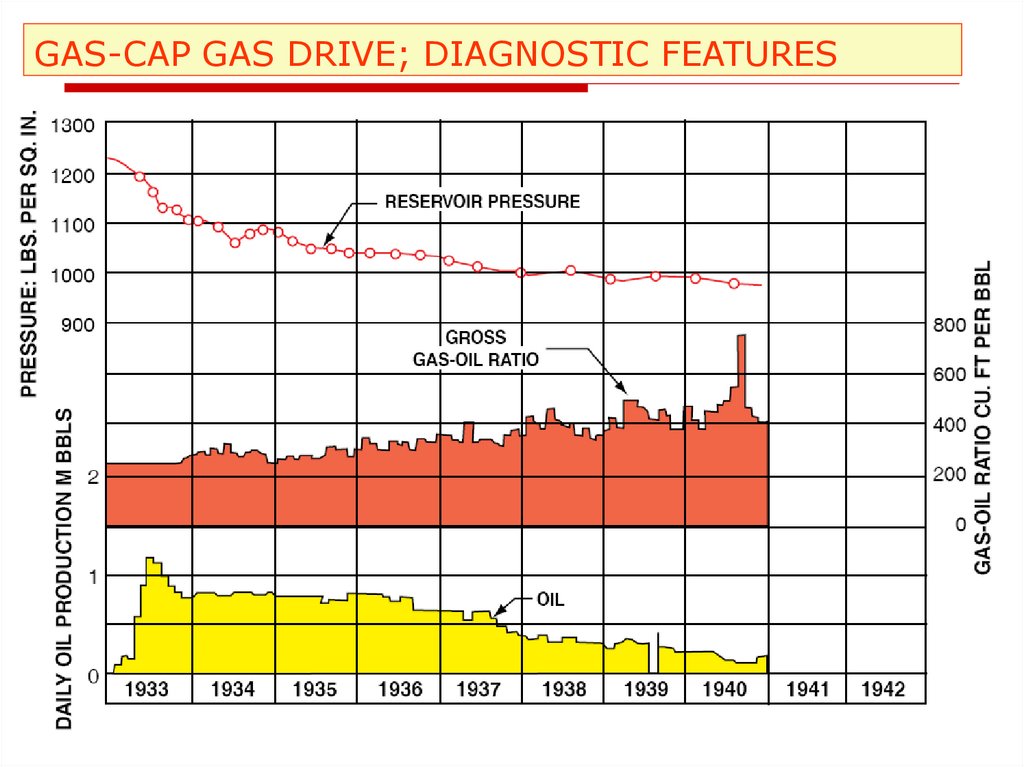
GAS-CAP GAS DRIVE; DIAGNOSTIC FEATURES▪ SLOW DECLINE OF RESERVOIR PRESSURE
▪ STABLE GOR OF WELLS AWAY FROM GOC FOR
FAIRLY LONG TIME
▪ HIGH GOR OF THE WELLS CLOSE TO GOC
▪ ULTIMATE RECOVERIES BETWEEN 30-50 %
▪ PREFERENTIAL FLOW OF GAS DUE TO ITS LOWER
VISCOSITY
▪ IF PRODUCED TOO RAPIDLY, BY-PASSING OF OIL
OCCURS, AND HENCE
▪ LIMITATIONS OF PRODUCTION RATES OTHERWISE
LOW RECOVERIES
75.
GAS-CAP GAS DRIVE; DIAGNOSTIC FEATURES76.
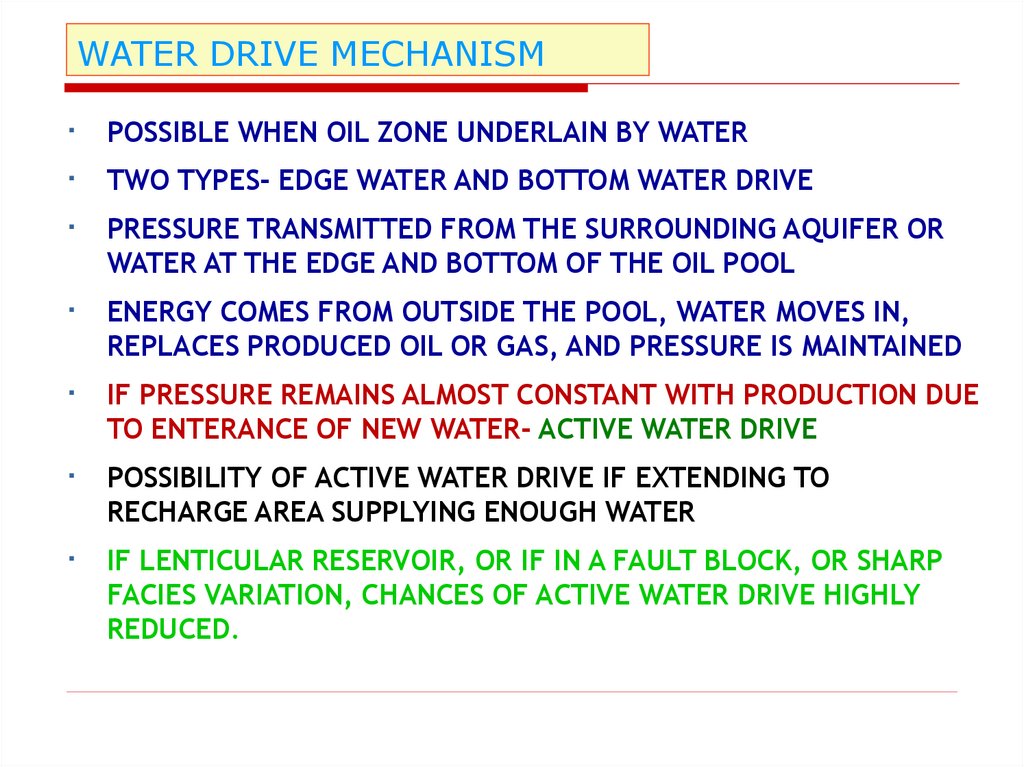
WATER DRIVE MECHANISM▪
POSSIBLE WHEN OIL ZONE UNDERLAIN BY WATER
▪
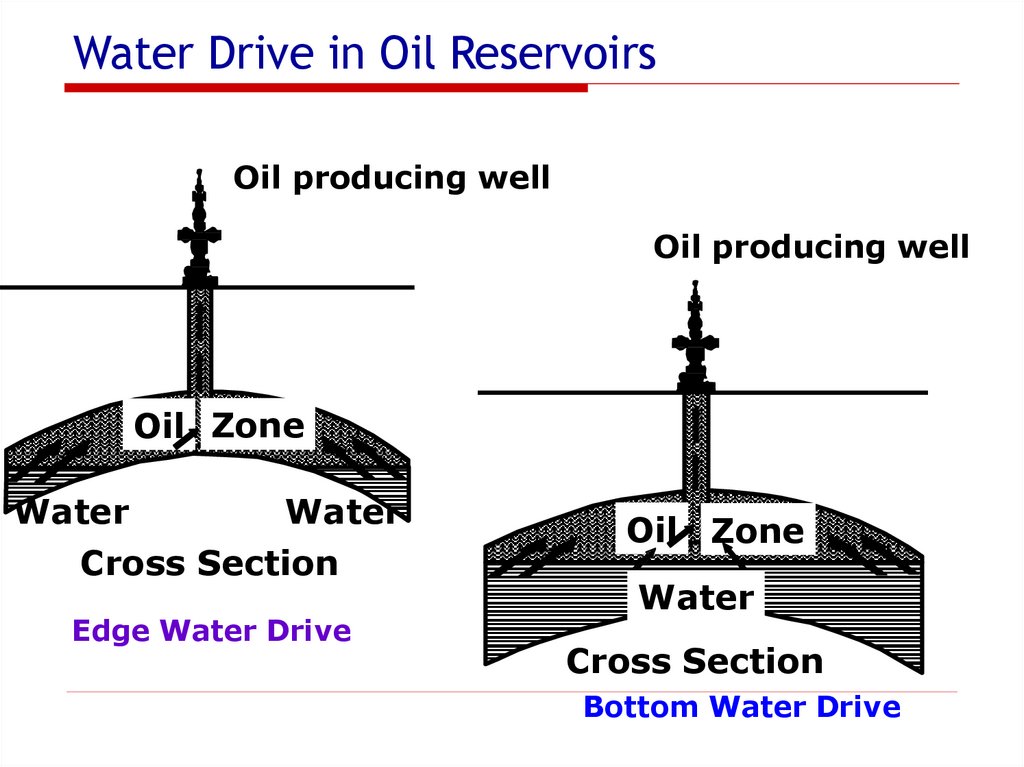
TWO TYPES- EDGE WATER AND BOTTOM WATER DRIVE
▪
PRESSURE TRANSMITTED FROM THE SURROUNDING AQUIFER OR
WATER AT THE EDGE AND BOTTOM OF THE OIL POOL
▪
ENERGY COMES FROM OUTSIDE THE POOL, WATER MOVES IN,
REPLACES PRODUCED OIL OR GAS, AND PRESSURE IS MAINTAINED
▪
IF PRESSURE REMAINS ALMOST CONSTANT WITH PRODUCTION DUE
TO ENTERANCE OF NEW WATER- ACTIVE WATER DRIVE
▪
POSSIBILITY OF ACTIVE WATER DRIVE IF EXTENDING TO
RECHARGE AREA SUPPLYING ENOUGH WATER
▪
IF LENTICULAR RESERVOIR, OR IF IN A FAULT BLOCK, OR SHARP
FACIES VARIATION, CHANCES OF ACTIVE WATER DRIVE HIGHLY
REDUCED.
77.
Water Drive in Oil ReservoirsOil producing well
Oil producing well
Oil Zone
Water
Water
Cross Section
Edge Water Drive
Oil Zone
Water
Cross Section
Bottom Water Drive
78.
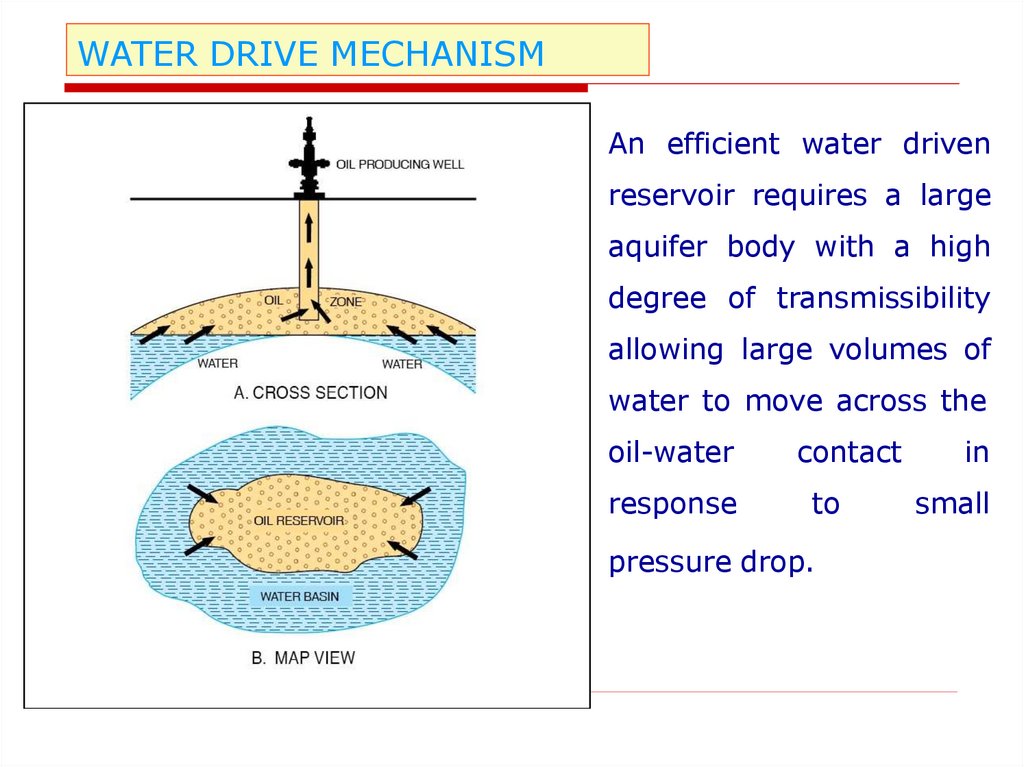
WATER DRIVE MECHANISMAn efficient water driven
reservoir requires a large
aquifer body with a high
degree of transmissibility
allowing large volumes of
water to move across the
oil-water
contact
response
to
pressure drop.
in
small
79.
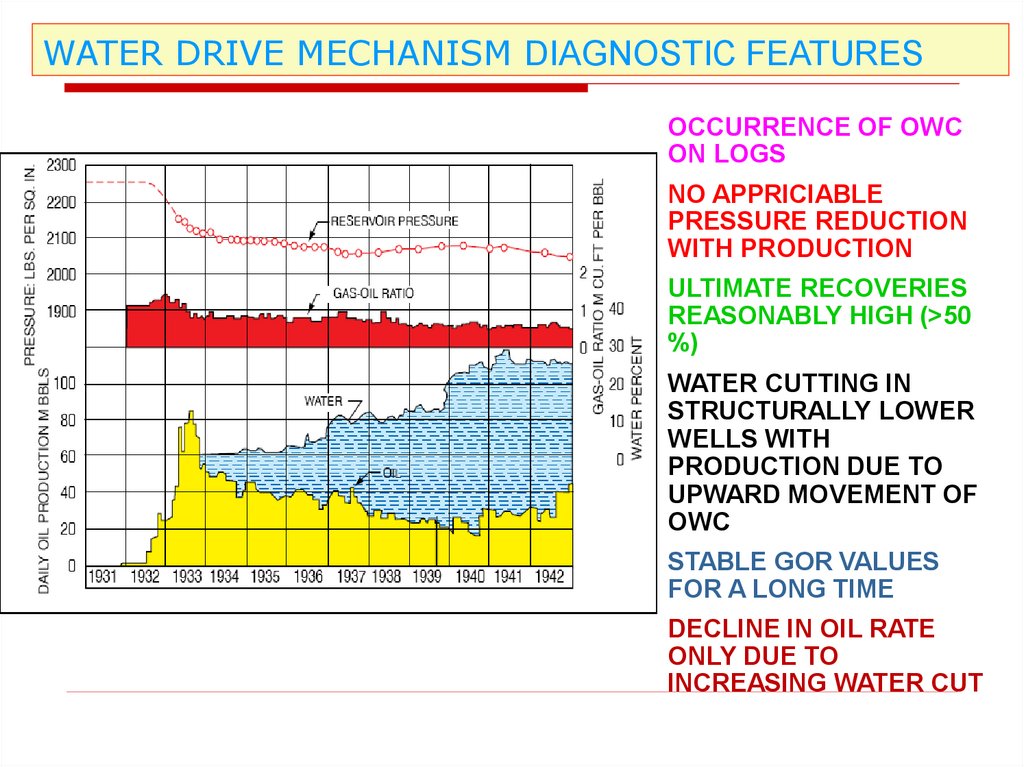
WATER DRIVE MECHANISM DIAGNOSTIC FEATURESOCCURRENCE OF OWC
ON LOGS
NO APPRICIABLE
PRESSURE REDUCTION
WITH PRODUCTION
ULTIMATE RECOVERIES
REASONABLY HIGH (>50
%)
WATER CUTTING IN
STRUCTURALLY LOWER
WELLS WITH
PRODUCTION DUE TO
UPWARD MOVEMENT OF
OWC
STABLE GOR VALUES
FOR A LONG TIME
DECLINE IN OIL RATE
ONLY DUE TO
INCREASING WATER CUT
80.
Gravity Drainage in Oil ReservoirsGravitational forces:
Gravitational segregation is tendency of fluids in
reservoir to segregate, under inference of gravity, to position in
reservoir based on fluids' density (gas to move above oil, water
below oil).
Reservoir type
•Gravity drainage may occur in any type of reservoir.
•Gravity drainage is particularly important in solution-gas and
gas-cap drive oil reservoirs.
81.
Gravity Drainage in Oil Reservoirs82.
Gravity Drive MechanismGRAVITY ACTS AS A DRIVE MECHANISM THROUGHOUT
THE PRODUCING LIFE OF ALL THE POOLS
SIGNIFICANT IN HIGH RELIEF TRAPS
SEPARATION OF WATER, OIL AND GAS IS AIDED BY
GRAVITY ONLY
IN SOLUTION GAS DRIVE RESERVOIRS, GRAVITY DRIVE
BECOMES IMPORTANT IN LATER STAGES
IT PROLONGS THE LIFE OF MANY WELLS
83.
COMBINATION DRIVE MECHANISMTwo combinations of driving forces can be present in
combination drive reservoirs:
• Depletion drive and a weak water drive
•Depletion drive with small gas cap and a weak drive
Gravity segregation plays an important role in any of
the above mentioned drives
84.
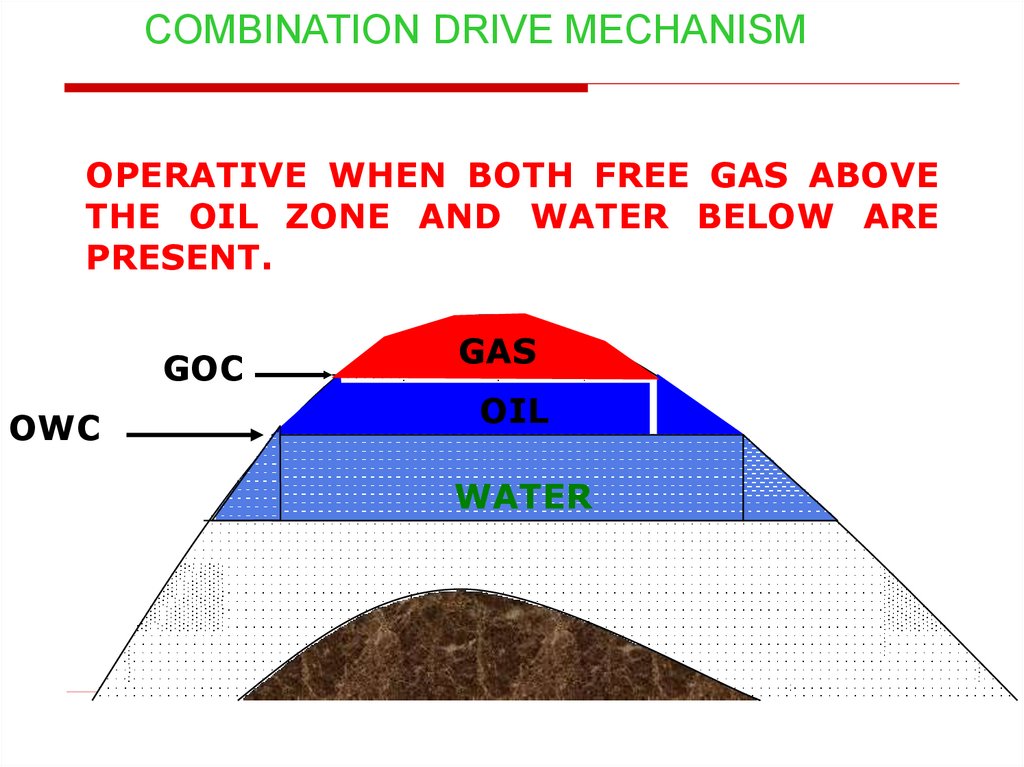
COMBINATION DRIVE MECHANISMOPERATIVE WHEN BOTH FREE GAS ABOVE
THE OIL ZONE AND WATER BELOW ARE
PRESENT.
GOC
OWC
GAS
OIL
WATER
85.
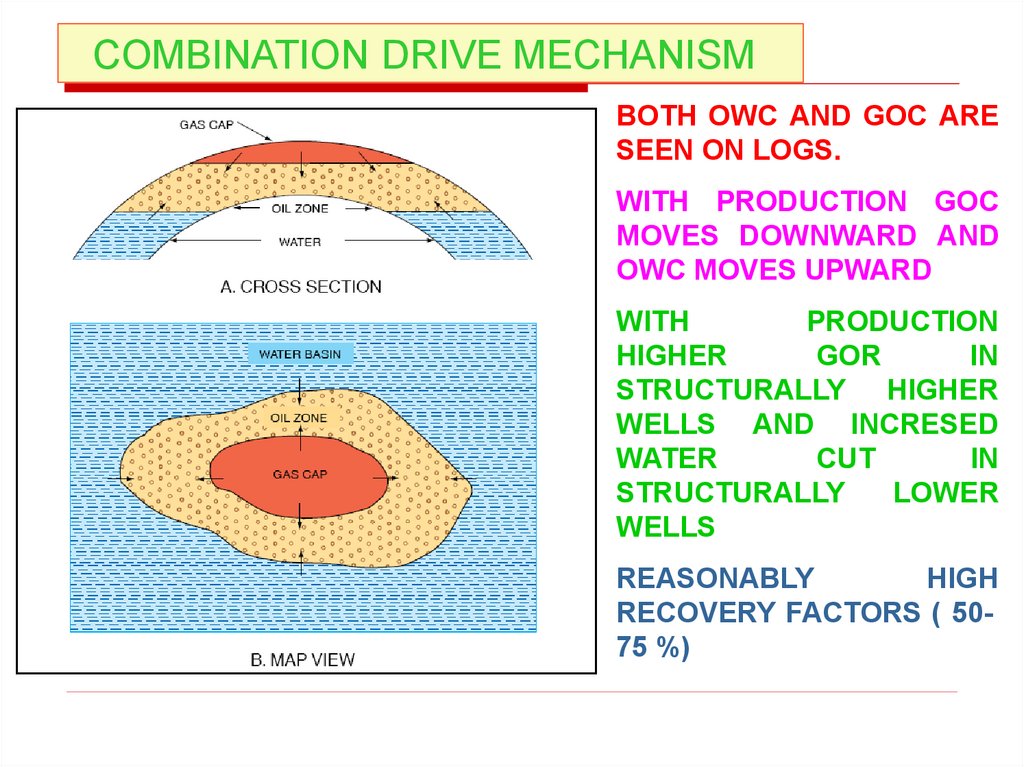
COMBINATION DRIVE MECHANISMBOTH OWC AND GOC ARE
SEEN ON LOGS.
WITH PRODUCTION GOC
MOVES DOWNWARD AND
OWC MOVES UPWARD
WITH
PRODUCTION
HIGHER
GOR
IN
STRUCTURALLY HIGHER
WELLS AND INCRESED
WATER
CUT
IN
STRUCTURALLY
LOWER
WELLS
REASONABLY
HIGH
RECOVERY FACTORS ( 5075 %)
86.
Thank You87.
COMPACTION DRIVE MECHANISM• The production of fluids from a reservoir will increase the difference
between overburden pressure and pore
pressure,
thereby
causing a reduction of pore volume of the
reservoir
and possible causing
• subsidence of the surface.
• Oil recovery by compaction
is significant
only if formation
that
have a drive
significant
compaction
drive are
is high.
Most reservoirs
shallow andcompressibility
poorly consolidated.
88.
GAS-CAP GAS DRIVE MECHANISMThe general behavior of gas drive reservoirs is similar to
that of solution gas drives reservoirs, except that the
presence of free gas retards the decline in pressure. The
characteristics trends of such reservoirs are:
• Reservoir pressure:
The reservoir pressure falls slowly and continuously. As
compared to depletiondrive, pressure tends to be
maintained at a higher level. The gas cap gas volume
compared to oil volume determines the degree of
pressure maintenance.
• Water production:
Nil or negligible water production
89.
GAS-CAP GAS DRIVE MECHANISM•Gas – Oil ratio
With the advancement of gas cap in the producing
intervals of up-structure wells, the gas – oil ratio
will increase to high values.
•Ultimate recovery:
Since gas cap expansion is basically a frontal drive
displacing mechanism, oil recovery is more efficient
as compared to depletion drive reservoirs. The
expected oil recoveries range from 20 to 40%.
90.
WATER DRIVE MECHANISMThe replacement mechanism has two particular
characteristics –
1.there must be pressure drops in order to have
expansion,
2.the aquifer response may lag substantially,
particularly if transmissibility deteriorates in the
aquifer.
A water drive reservoir is then particularly rate
sensitive, and so the reservoir behave almost as a
depletion reservoir for a long period if off-take rates
are very high, or as an almost complete pressure
maintained water drive reservoir if off-take rates are
low, for the given aquifer.
91.
WATER DRIVE MECHANISMThe following characteristics can be used for identification of
the water-drive mechanism:
•Reservoir pressure: The reservoir pressure decline is usually
very gradual.
•Water
production: Early water production occurs in
structurally low wells.
•Gas - Oil Ratio: There is normally little change in the
producing gas oil ratio during the life of reservoir.
•Ultimate oil recovery: Ultimate recovery from water-drive
reservoirs is usually much larger than recovery under any other
mechanism. Recovery is dependent upon the efficiency of the
flushing action of the water as it displaces the oil.
92.
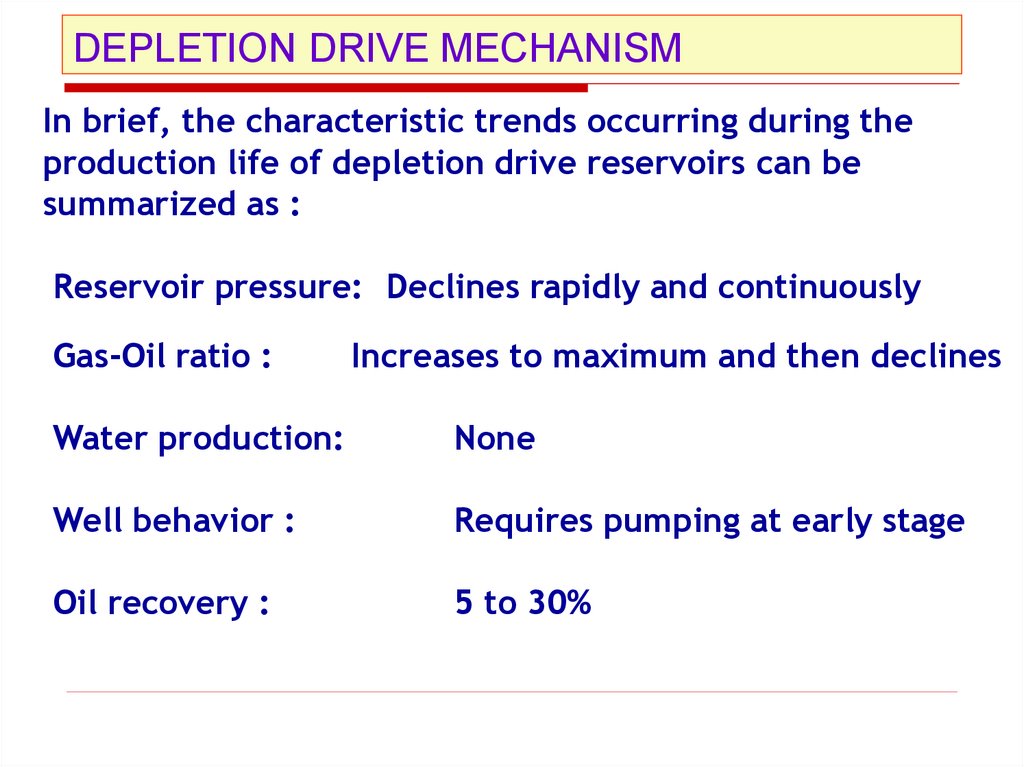
DEPLETION DRIVE MECHANISMIn brief, the characteristic trends occurring during the
production life of depletion drive reservoirs can be
summarized as :
Reservoir pressure: Declines rapidly and continuously
Gas-Oil ratio :
Increases to maximum and then declines
Water production:
None
Well behavior :
Requires pumping at early stage
Oil recovery :
5 to 30%
93.
Capillarity94.
Tars and Asphalts□ These solid and semi solid substances are also known as
bitumen, waxes and resins
□ They are very complex substances and relatively little is
known regarding their chemical composition
□ These materials are formed in nature from petroleum oils
by evaporation of the more volatile constituents and
oxidation and polymerization of residue
95.
Chemical composition of petroleum depositsPetroleum deposits obtained from different reservoirs will vary
widely in chemical composition and may have entirely different
physical and Chemical Properties
They may be present in the reservoir in liquid and/or gas form
depending upon the pressure, temperature and composition
In spite of this diversity, the bulk of the chemical compounds
found in Petroleum are hydrocarbons:
1. Paraffin hydrocarbons (CnH2n+2)
2.Naphthalene hydrocarbons
3.Aromatic hydrocarbons
96.
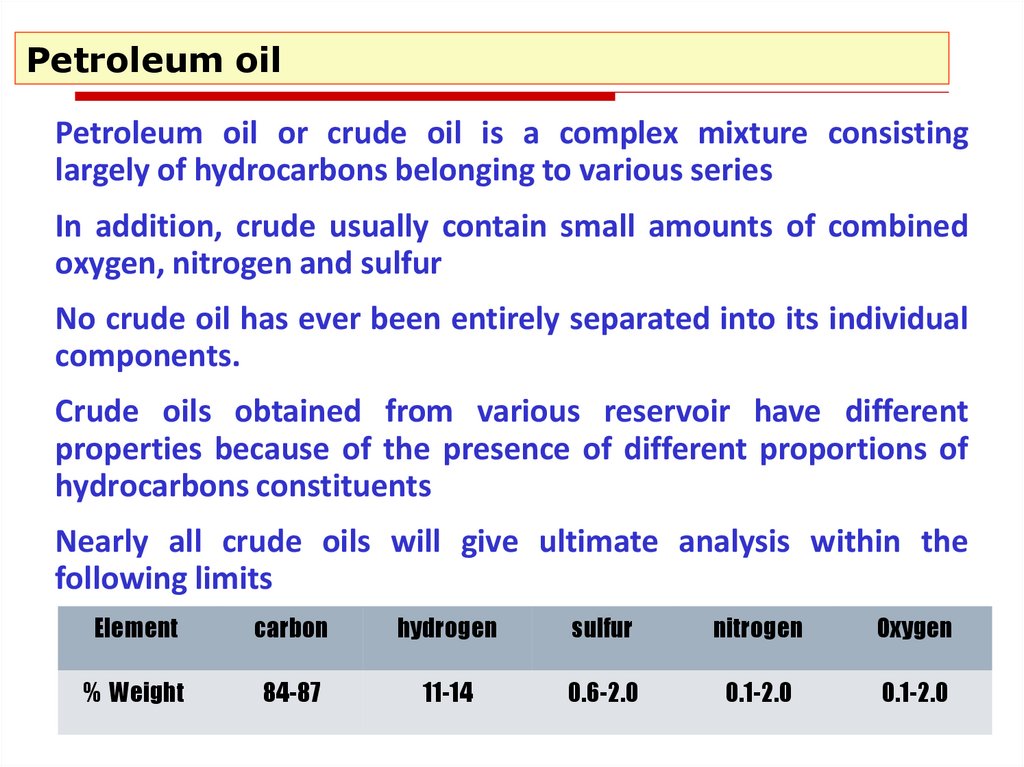
Petroleum oilPetroleum oil or crude oil is a complex mixture consisting
largely of hydrocarbons belonging to various series
In addition, crude usually contain small amounts of combined
oxygen, nitrogen and sulfur
No crude oil has ever been entirely separated into its individual
components.
Crude oils obtained from various reservoir have different
properties because of the presence of different proportions of
hydrocarbons constituents
Nearly all crude oils will give ultimate analysis within the
following limits
Element
carbon
hydrogen
sulfur
nitrogen
Oxygen
% Weight
84-87
11-14
0.6-2.0
0.1-2.0
0.1-2.0
97.
Natural GasNatural gas can occur by itself or in combination with liquid
petroleum oils
It consists mainly of the more volatile members of the paraffin
series containing from one to four carbon atoms
Small amount of higher molecular weight hydrocarbons can
also be present
In addition, natural gases may contain varying amount of
carbon dioxide, nitrogen, hydrogen sulfide, helium and water
vapor
Natural gas can be classified as sweet or sour and as wet or dry