 Empirical rule - Probabilities")
 about their ages is here below:")


 mathematics
Similar presentations:
")
")
")
")
")
")
")
")
")
")
Empirical rule - Probabilities. Week 5 (1)
1. BBA182 Applied Statistics Week 5 (1) Empirical rule - Probabilities
DR SUSANNE HANSEN SARALEMAIL: SUSANNE.SARAL@OKAN.EDU.TR
HT TPS://PIAZZA.COM/CLASS/IXRJ5MMOX1U2T8?CID=4#
WWW.KHANACADEMY.ORG
DR SUSANNE HANSEN SARAL
1
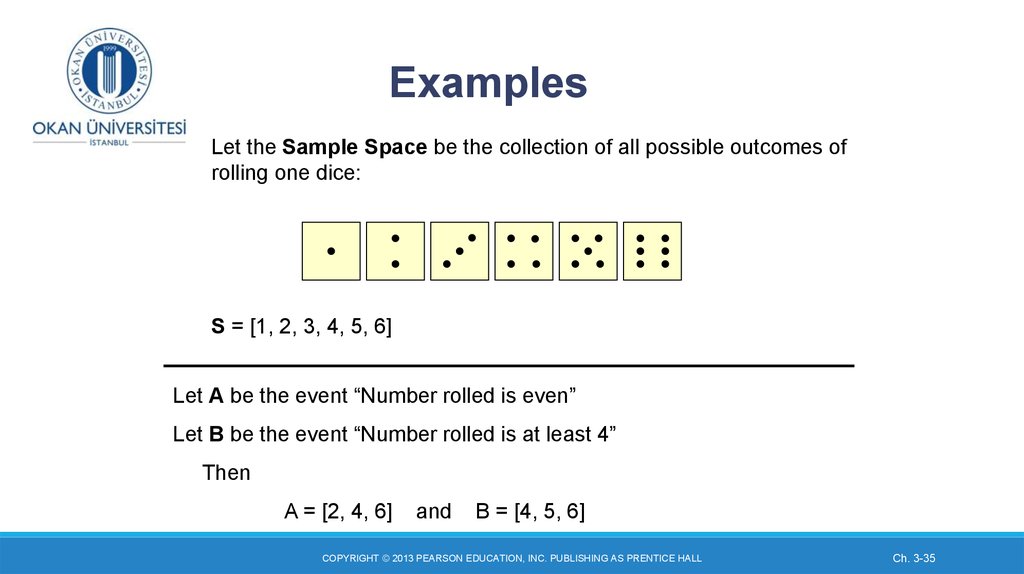
2. Interpretation of summary statistics A random sample of people attended a recent soccer match. The summary statistics (Excel output) about their ages is here below:
People who attended a soccer matchWhat is the sample size?
What is the mean age?
What is the median?
What shape does the distribution of ages
have? (symmetric or non-symmetric)
What is the measure/s for spread in the data?
Is this a large spread?
What is the Coefficient of variation for
this data?
Mean
Median
Mode
Standard Deviation
Sample Variance
Kurtosis
Skewness
Range
Minimum
Maximum
Sum
Count
28.77143
27
23
12.70268
161.358
0.421354
0.854589
53
12
65
1007
35
3. Deviations from the normal distribution - Kurtosis
A distribution with positive kurtosis is pointy and a distribution with a negative kurtosis isflatter than a normal distribution
DR SUSANNE HANSEN SARAL, SUSANNE.SARAL@GMAIL.COM
4. Positively and negatively skewed
Positive skewed is when the distribution is skewed to the rightNegative skewed is when the distribution is skewed to the left
5. Symmetric distribution - Empirical rule
Knowing the mean and the standard deviation of a data set we can extract a lot ofinformation about the location of our data.
The information depends on the shape of the histogram (symmetric, skewed, etc.).
If the histogram is symmetric or bell-shaped, we can use the Empirical rule.
DR SUSANNE HANSEN SARAL, SUSANNE.SARAL@OKAN.EDU.TR
6. Probability as Area Under the Curve
The total area under the curve is 1.0, and the curve is symmetric, sohalf (50%) of the data in the data set is above the mean, half (50%) is
below
f(X)
P( X μ) 0.5
0.5
P(μ X ) 0.5
0.5
μ
X
P( X ) 1.0
DR SUSANNE HANSEN SARAL
Ch. 5-6
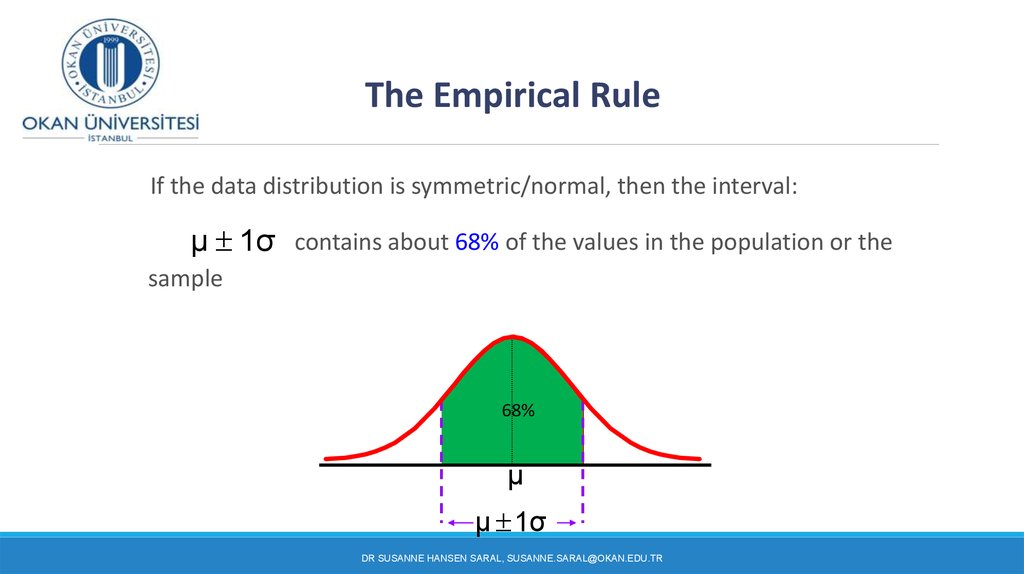
7.
The Empirical RuleIf the data distribution is symmetric/normal, then the interval:
μ 1σ contains about 68% of the values in the population or the
sample
68%
μ
μ 1σ
DR SUSANNE HANSEN SARAL, SUSANNE.SARAL@OKAN.EDU.TR
8.
The Empirical Rule(continued)
μ 2σ
contains about 95% of the values in the population or the sample
μ 3σ
contains almost all (about 99.7%) of the values in the population
or the sample
95%
99.7%
μ 2σ
μ 3σ
DR SUSANNE HANSEN SARAL, SUSANNE.SARAL@OKAN.EDU.TR
9. Empirical rule: Application
A company produces batteries with a mean lifetime of 1’200 hours and a standarddeviation of 50 hours.
Find the interval for (what values fall into the following interval?):
μ 1σ
μ 2σ
μ 3σ
DR SUSANNE HANSEN SARAL, SUSANNE.SARAL@OKAN.EDU.TR
10. Empirical rule: Application
A company produces batteries with a mean lifetime of 1’200 hours and a standarddeviation of 50 hours.
The mean is 1’200 and standard deviation is 50, we find the following intervals:
= 1’200 ± 1x(50) = (1’150 and 1’250)
μ 1σ
= 1’200 ± 2x(50) = (1’100 and 1’300)
μ 2σ
= 1’200 ± 3x(50) = (1’050 and 1’350)
μ 3σ
DR SUSANNE HANSEN SARAL, SUSANNE.SARAL@OKAN.EDU.TR
11. Interpretation of the Empirical rule: Lightbulb lifetime example
If the shape of the distribution is normal, then we can conclude :That approximately 68% of the batteries will last between 1’150 and 1’250 hours
That approximately 95% of the batteries will last between 1’100 and 1’300 hours
and
That 99.7% (almost all batteries) will last between 1’050 and 1’350 hours.
It would be very unusual for a battery to loose it’s energy in ex. 600 hours or
1’600 hours. Such values are possible, but not very likely. Their lifetimes would
be considered to be outliers
DR SUSANNE HANSEN SARAL, SUSANNE.SARAL@OKAN.EDU.TR