 Measures of variation")


")


")
")
")
")
")


")


")


 mathematics
Similar presentations:
")
")
")
")
")
")
")
. Week 2 (2)")
")

Measures of variation. Week 4 (2)
1. BBA182 Applied Statistics Week 4 (2) Measures of variation
DR SUSANNE HANSEN SARALEMAIL: SUSANNE.SARAL@OKAN.EDU.TR
HT TPS://PIAZZA.COM/CLASS/IXRJ5MMOX1U2T8?CID=4#
WWW.KHANACADEMY.ORG
DR SUSANNE HANSEN SARAL
1
2. Average distance to the mean: Standard deviation
Most commonly used measure of variabilityMeasures the standard (average) distance of all data points from the mean.
3/22/2017
3. Using Microsoft Excel
Descriptive Statistics can be obtained fromMicrosoft® Excel
◦ Select:
data / data analysis / descriptive statistics
◦ Enter details in dialog box
COPYRIGHT © 2013 PEARSON EDUCATION, INC. PUBLISHING AS PRENTICE HALL
Ch. 2-3
4. Using Excel to find Descriptive Statistics
Select data / data analysis / descriptive statisticsCOPYRIGHT © 2013 PEARSON EDUCATION, INC. PUBLISHING AS PRENTICE HALL
Ch. 2-4
5. Using Excel to find Descriptive Statistics
Enter input rangedetails
Check box for
summary statistics
Click OK
COPYRIGHT © 2013 PEARSON EDUCATION, INC. PUBLISHING AS PRENTICE HALL
Ch. 2-5
6. Excel output
Microsoft Exceldescriptive statistics output,
using the house price data:
House Prices:
$2,000,000
500,000
300,000
100,000
100,000
COPYRIGHT © 2013 PEARSON EDUCATION, INC. PUBLISHING AS PRENTICE HALL
Ch. 2-6
7. Comparing Standard Deviations of 3 different data sets
Mean = 15.5 for each data sets = 3.338
Data A
11
Data B
11
12
13
12 13
14
15 16 17 18 19 20 21
14 15
16 17 18 19 20 21
(compare to the two cases
below)
s = 0.926
(values are concentrated
near the mean)
s = 4.570
Data C
11
12
13
14
15 16
17
18
19 20 21
(values are dispersed far
from the mean)
COPYRIGHT © 2013 PEARSON EDUCATION, INC. PUBLISHING AS PRENTICE HALL
Ch. 2-7
8.
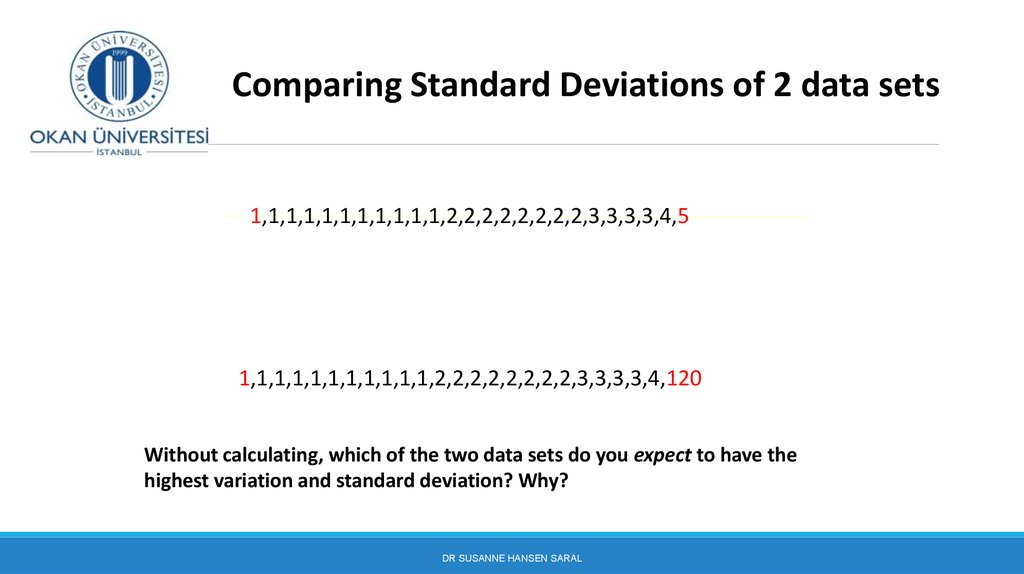
Comparing Standard Deviations of 2 data sets1,1,1,1,1,1,1,1,1,1,1,2,2,2,2,2,2,2,2,3,3,3,3,4,5
1,1,1,1,1,1,1,1,1,1,1,2,2,2,2,2,2,2,2,3,3,3,3,4,120
Without calculating, which of the two data sets do you expect to have the
highest variation and standard deviation? Why?
DR SUSANNE HANSEN SARAL
9. Describing distributions – what to pay attention to!
Pay attention to:its’ shape (symmetric, right or left skewed)
its’ center (mean, median, mode)
Its’ spread (variance, standard deviation)
DR SUSANNE HANSEN SARAL, SUSANNE.SARAL@GMAIL.COM
10. Effect of the size of the standard deviation on the shape of a distribution
The standard deviation affects the shape of a distribution:When there are small distances between the data points, most of the scores in the data set will be
close to the mean and the resulting standard deviation will be small. The distribution will be narrow.
When there are large distances between data points, the scores will be further away from the mean
and the standard deviation is larger. The distribution will be wide.
As illustrated in the following slide:
COPYRIGHT © 2013 PEARSON EDUCATION, INC. PUBLISHING AS PRENTICE HALL
Ch. 2-10
11. Effect of the size of the standard deviation on the shape of a distribution
Small standard deviation-the meanrepresents the data well
Large standard deviation – mean
a bad representation of the data
COPYRIGHT © 2013 PEARSON EDUCATION, INC. PUBLISHING AS PRENTICE HALL
Ch. 2-11
12. Examples of applications of the standard deviation in business
Logistics:Measurement of timeliness/reliability/consistency
Financial sector:
Measurement of risk (difference between actual rate of
return and the expected rate of return)
Production:
Quality control management. Measurement of consistency and
reliability of manufacturing processes
DR SUSANNE HANSEN SARAL, SUSANNE.SARAL@OKAN.EDU.TR
13. Standard deviation a measure for risk in Finance
Comparing 2 different assets, asset A and asset B with the same mean:DR SUSANNE HANSEN SARAL, SUSANNE.SARAL@OKAN.EDU.TR
14. Standard deviation a measure for consistency in quality control (Consistency in Turkish: Tutarlılık)
Comparing two manufacturing processes for number of defects in a sample, with similar meansof defects:
Process 1:
Mean
Median
Mode
Standard Deviation
Sample Variance
Count
Process 2
10.4
11
#N/A
4.393177
19.3
5
Mean
Median
Mode
Standard Deviation
Sample Variance
Count
DR SUSANNE HANSEN SARAL, SUSANNE.SARAL@OKAN.EDU.TR
10
10
#N/A
1.581139
2.5
5
15. Measuring standard deviation
Small standard deviationLow risk/high consistency
Large standard deviation
High risk/low consistency