 english
Similar presentations:


")


")


Construct validity of the survey questions on household finance. Lecture 4
1.
Lecture 4 Construct validity of the surveyquestions on household finance
Higher School of Economics , Moscow, 2011
www.hse.ru
2.
“The world is full of well-meaning people who believethat anyone who can write plain English and has a
modicum of common sense can produce a questionnaire”
Oppenheim (1992:1)
Cited in Bourke, J., Kirby, A., & Doran, J. (2016). p.3.
https://search.ebscohost.com/login.aspx?direct=true&db=nlebk&AN=1460401&ebv=EB&ppid=pp
_3
3.
What is this lecture about?• How to compose survey questions
• How to create item scales
• How to build questionnaires
photo
4.
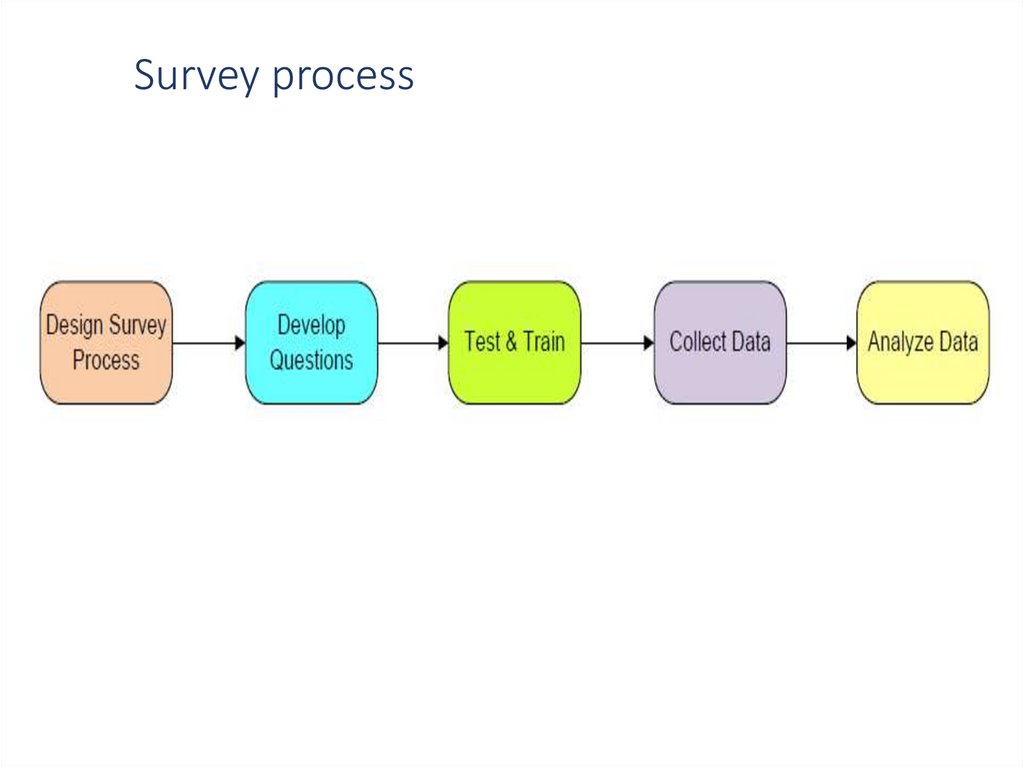
Survey processphoto
Higher School of Economics , Moscow, 2011
5.
Survey questionsYour choices will be influenced by
• your research goals and timeline,
• how sensitive or complex the study topic is,
• the characteristics, abilities and resources of potential respondents (e.g.,
their access to and experience with technology),
• your budget.
The choices you make will affect the quality, cost and timeliness of your
results.
A survey question is a measuring device for things that are not directly
observable, in the same way that a bathroom scale is a measuring
instrument for weight. In order for your survey results to be useful and
meaningful, the questions you ask must have two characteristics: reliability
and validity.
https://www.lonestar.edu/departments/honorsprogram/A%20Guide%20to%20Designing%20and%20Implementing%20Surveys.pdf not available online – see in readings
6.
Survey questionsWriting good survey questions requires keeping the goal of the survey firmly in
mind and then formulating each question from the perspective of the
respondent!
It may be tempting to ask questions simply because it would be interesting to
know the answers, but this should be avoided - if questions are not essential to
the goal of the survey, such questions can actually detract from your survey
results.
Unnecessary questions distract respondents or cause confusion.
Respondents’ abilities to provide accurate and useful information are enhanced
when they can immediately understand what is being asked and the purpose
of the question.
The placement of a question within the survey also has an impact on the
photo
results.
7.
The Importance of StandardisationIn survey research:
The goal of standardisation is that each respondent be exposed
to the same question experience, and that the recording of the
answer be the same, too, so that any differences in the answers
can be correctly interpreted as reflecting differences between
respondents rather than differences in the process that
produced the same answer.
Fowler & Mangione (1990:14)
Cited in Bourke, J., Kirby, A., & Doran, J. (2016), p. 10.
8.
The Importance of StandardisationThe Importance of Exact Wording
Two priests, a Dominican and a Jesuit, are discussing whether it is a sin to
smoke and pray at the same time. After failing to reach a conclusion, each
goes off to consult his respective superior. The next week they meet again.
The Dominican says, “Well, what did your superior say?” The Jesuit
responds, “He said it was all right”. “That’s funny,” the Dominican replies,
“My superior said it was a sin”. “Well, what did you ask him?”, asks the
Jesuit. “I asked him if it was alright to smoke while praying”, the Dominican
replies. “Oh”, says the Jesuit, “I asked my superior if it was alright to pray
while smoking”.
Sudman & Bradburn (1983:1)
Cited in Bourke, J., Kirby, A., & Doran, J. (2016), p.10.
9.
ReliabilityJust as you want to be able to rely on your bathroom scale to
always give the same reading if your weight is unchanged, you
want your survey questions to be reliable.
Reliability is the extent to which repeatedly measuring the same
property produces the same result.
Ideally, each survey question will mean the same thing to
everyone, including those administering the survey. This takes
careful design and refinement.
photo
10.
ValidityValidity is the extent to which a survey question measures the
property it is supposed to measure.
For example, a yardstick would not produce a valid measure of the
weight of an object.
Your bathroom scale is more likely to produce valid readings, but
if it’s old and abused, the readings may be systematically
inaccurate.
photo
11.
Some tips for writing good questionsWhenever possible, build on what’s been done before!
Somewhere, sometime, someone has tried to get the same or similar
information.
Access previous surveys conducted by your unit or elsewhere on campus or
investigate online repositories of questions so you don’t have to start from
scratch.
An effective survey question provides the respondent with a context for the
question by announcing the topic and defining the timeframe for events or
behaviors that are to be included in the response.
For example,
“This question is about commuting to work. When answering, please consider
only events that occurred during the fall semester.”
This pre-question information or context is known as the “preamble.” The preamble
photo
is an important means of ensuring the reliability and validity of the question.
12.
Vocabulary of the questionsIf the words used in the question are not in the vocabulary of some respondents,
they won’t understand what has been asked – leads to bias in the data.
Three levels of vocabulary:
1. Core words with clear and common understanding
2. Words that they recognize but do not use themselves – partial
understanding
3. Words which they neither recognize nor understand - no understanding
The recipe:
• Use common words from the core vocabulary of the least sophisticated
respondent!
• When writing questions write as you speak!
Do you trust financial institutions? Wrong.
photo
Do you trust banks/insurance companies/pension funds? Better.
13.
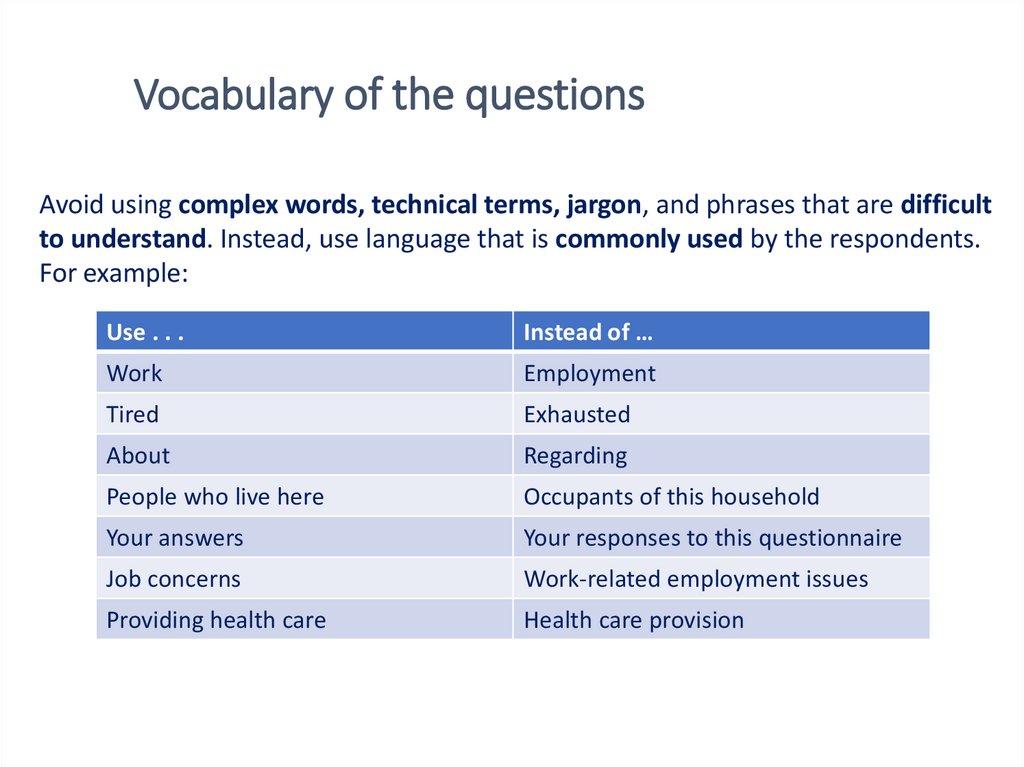
Vocabulary of the questionsAvoid using complex words, technical terms, jargon, and phrases that are difficult
to understand. Instead, use language that is commonly used by the respondents.
For example:
Use . . .
Instead of …
Work
Employment
Tired
Exhausted
About
Regarding
People who live here
Occupants of this household
Your answers
Your responses to this questionnaire
Job concerns
Work-related employment issues
Providing health care
Health care provision
photo
14.
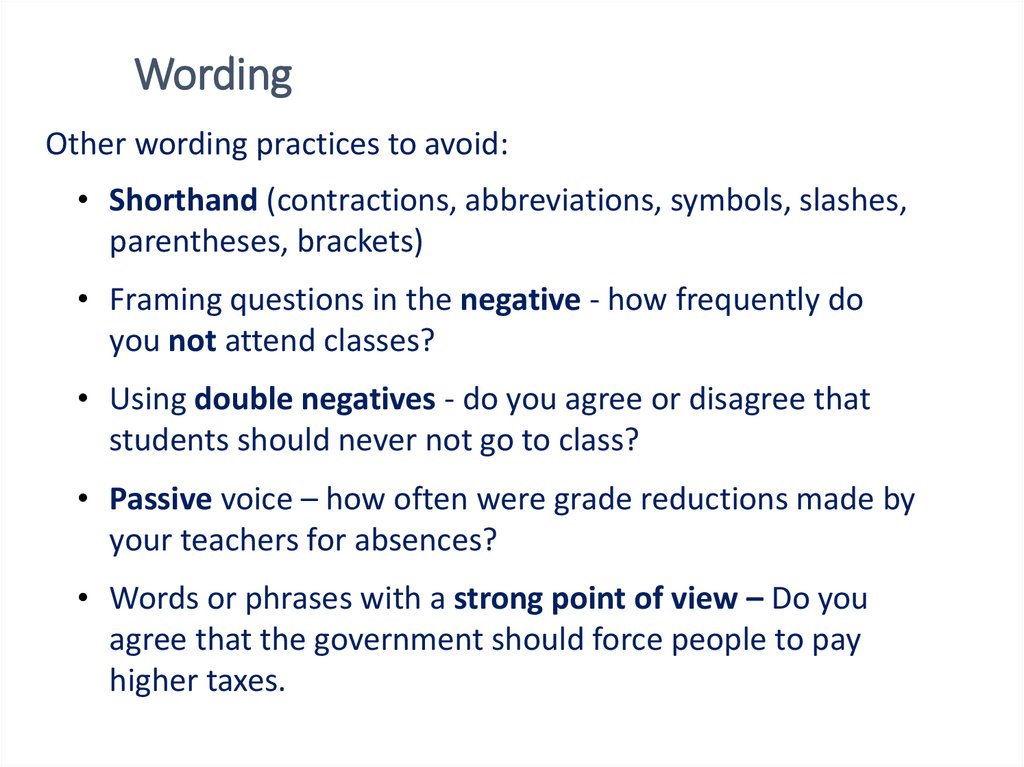
WordingOther wording practices to avoid:
• Shorthand (contractions, abbreviations, symbols, slashes,
parentheses, brackets)
• Framing questions in the negative - how frequently do
you not attend classes?
• Using double negatives - do you agree or disagree that
students should never not go to class?
• Passive voice – how often were grade reductions made by
your teachers for absences?
• Words or phrases with a strong point of view – Do you
agree that the government should force people to pay
photo
higher taxes.
15.
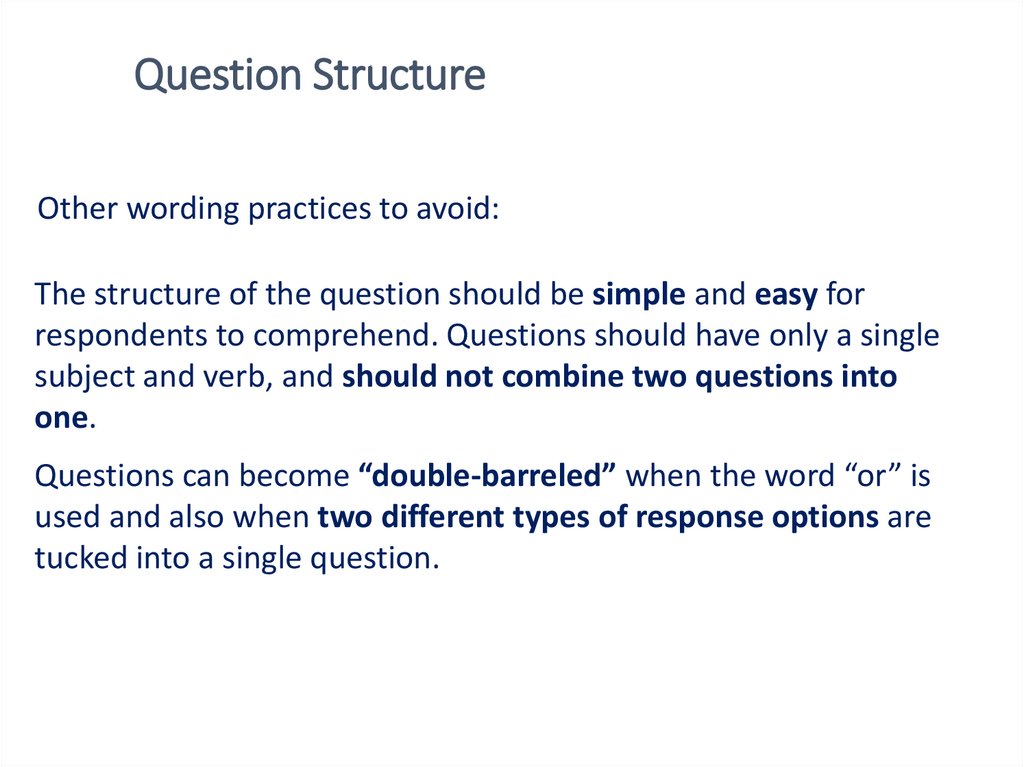
Question StructureOther wording practices to avoid:
The structure of the question should be simple and easy for
respondents to comprehend. Questions should have only a single
subject and verb, and should not combine two questions into
one.
Questions can become “double-barreled” when the word “or” is
used and also when two different types of response options are
tucked into a single question.
photo
Higher School of Economics , Moscow, 2011
16.
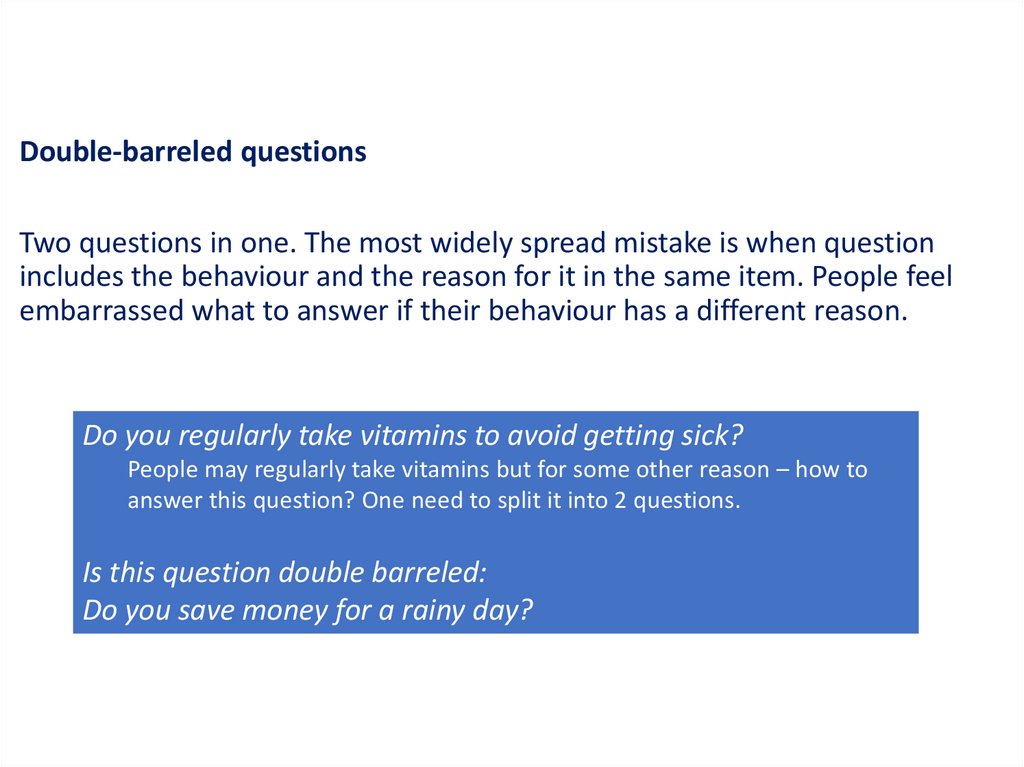
Double-barreled questionsTwo questions in one. The most widely spread mistake is when question
includes the behaviour and the reason for it in the same item. People feel
embarrassed what to answer if their behaviour has a different reason.
Do you regularly take vitamins to avoid getting sick?
People may regularly take vitamins but for some other reason – how to
answer this question? One need to split it into 2 questions.
Is this question double barreled:
Do you save money for a rainy day?
photo
Higher School of Economics , Moscow, 2011
17.
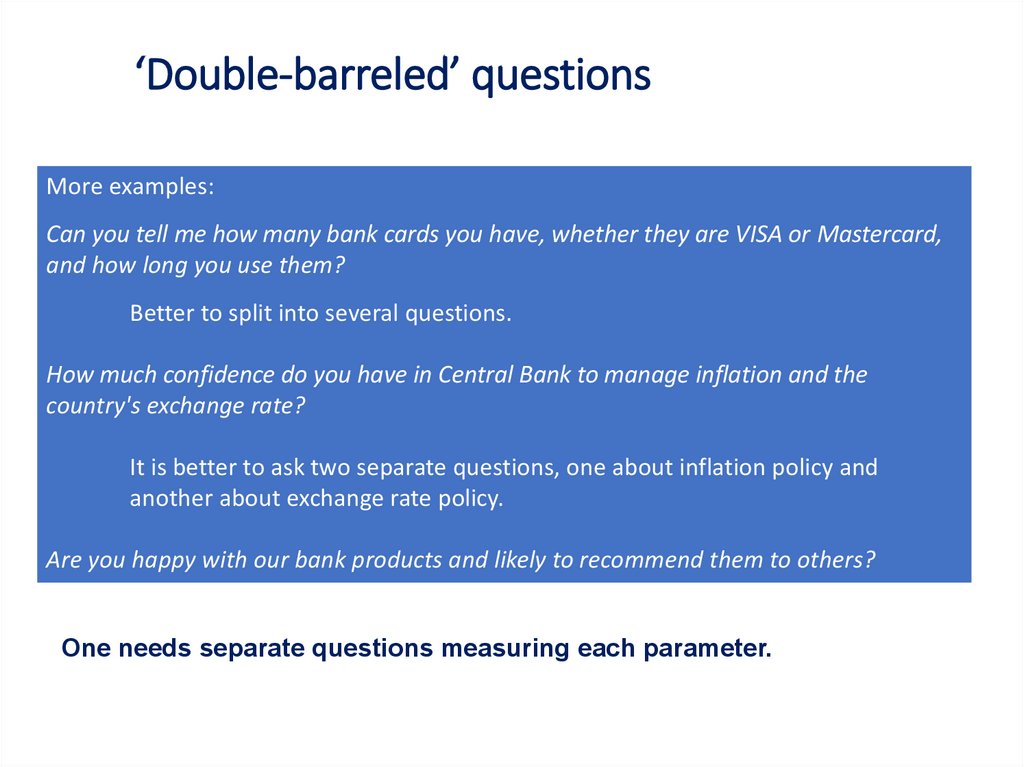
‘Double-barreled’ questionsMore examples:
Can you tell me how many bank cards you have, whether they are VISA or Mastercard,
and how long you use them?
Better to split into several questions.
How much confidence do you have in Central Bank to manage inflation and the
country's exchange rate?
It is better to ask two separate questions, one about inflation policy and
another about exchange rate policy.
Are you happy with our bank products and likely to recommend them to others?
One needs separate questions measuring each parameter.
Higher School of Economics , Moscow, 2011
photo
18.
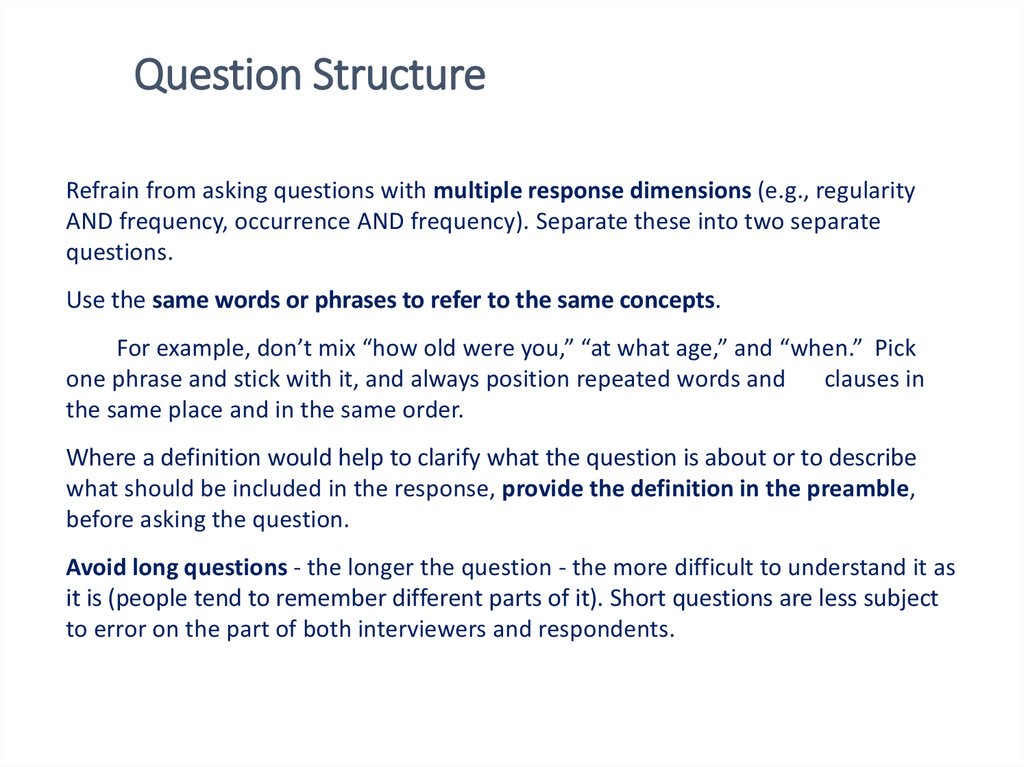
Question StructureRefrain from asking questions with multiple response dimensions (e.g., regularity
AND frequency, occurrence AND frequency). Separate these into two separate
questions.
Use the same words or phrases to refer to the same concepts.
For example, don’t mix “how old were you,” “at what age,” and “when.” Pick
one phrase and stick with it, and always position repeated words and clauses in
the same place and in the same order.
Where a definition would help to clarify what the question is about or to describe
what should be included in the response, provide the definition in the preamble,
before asking the question.
Avoid long questions - the longer the question - the more difficult to understand it as
it is (people tend to remember different parts of it). Short questions are less subject
to error on the part of both interviewers and respondents.
photo
Higher School of Economics , Moscow, 2011
19.
Basic attributes of survey questionsAll respondents MUST understand the
question in the same way!
If they do not the validity of the question is
very low.
If respondents understand the question in
a different way in fact they answer
different questions, so the aggregation
is not possible.
photo
Higher School of Economics , Moscow, 2011
20.
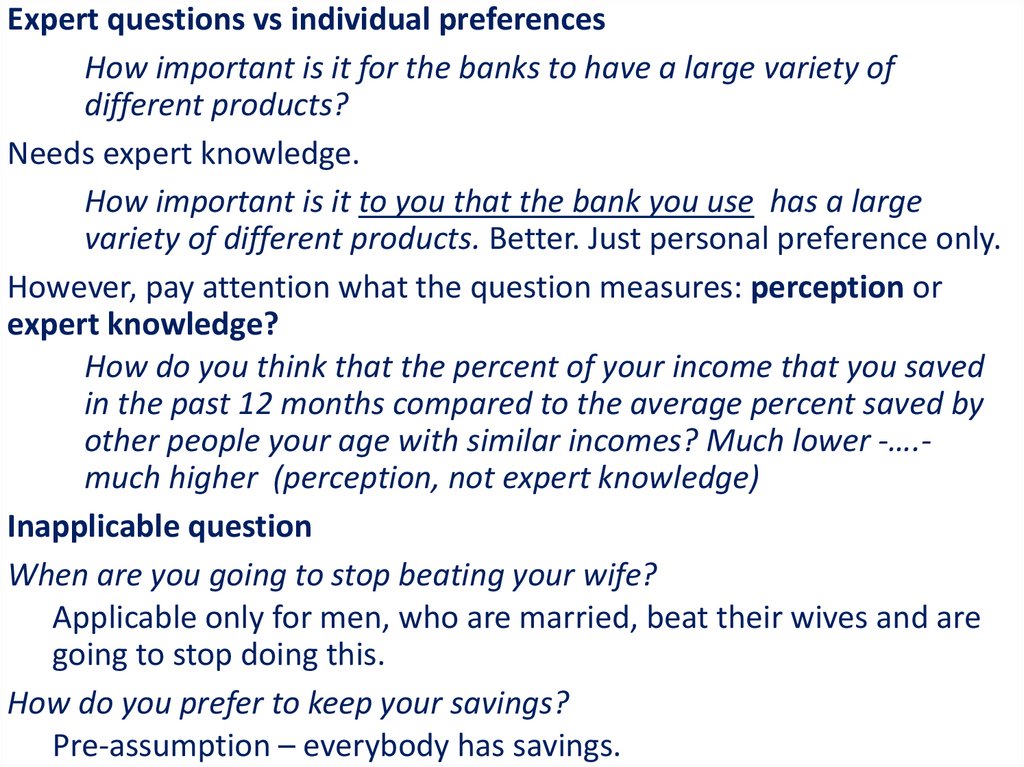
Expert questions vs individual preferencesHow important is it for the banks to have a large variety of
Instrumentation
bias and error
different
products?
Needs expert knowledge.
How important is it to you that the bank you use has a large
variety of different products. Better. Just personal preference only.
However, pay attention what the question measures: perception or
expert knowledge?
How do you think that the percent of your income that you saved
in the past 12 months compared to the average percent saved by
other people your age with similar incomes? Much lower -….much higher (perception, not expert knowledge)
Inapplicable question
When are you going to stop beating your wife?
Applicable only for men, who are married, beat their wives and are
photo
going to stop doing this.
How do you prefer to keep your savings?
Pre-assumption – everybody has savings.
Higher School of Economics , Moscow, 2011
21.
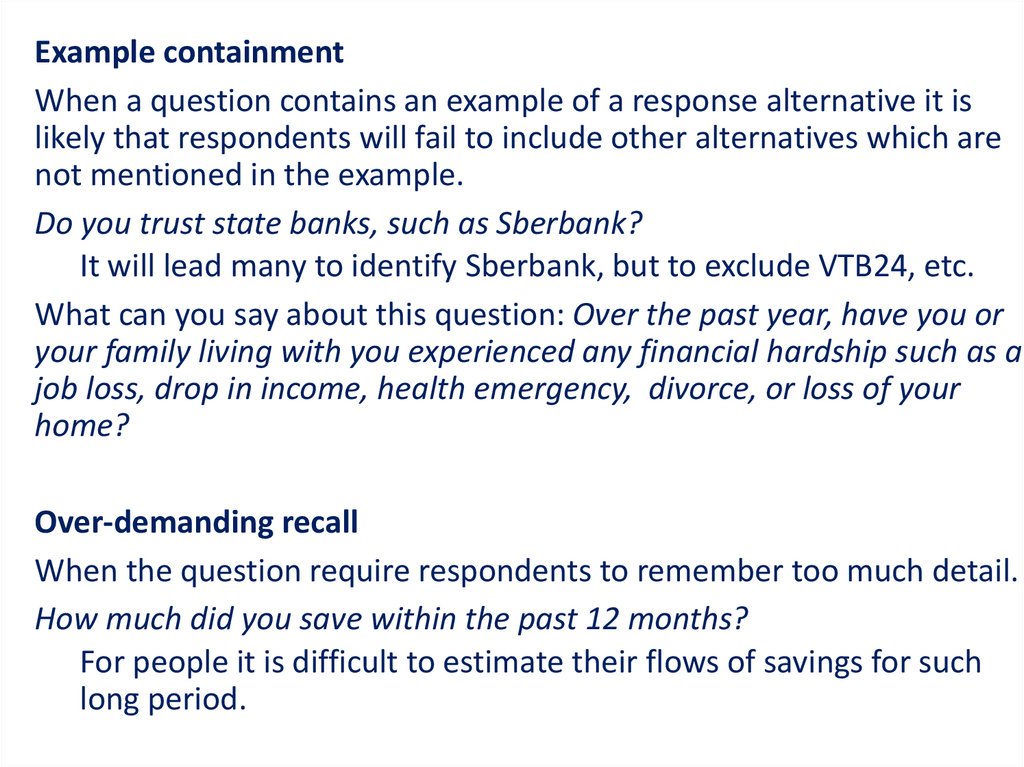
Example containmentWhen a question contains an example of a response alternative it is
likely that respondents will fail to include other alternatives which are
not mentioned in the example.
Do you trust state banks, such as Sberbank?
It will lead many to identify Sberbank, but to exclude VTB24, etc.
What can you say about this question: Over the past year, have you or
your family living with you experienced any financial hardship such as a
job loss, drop in income, health emergency, divorce, or loss of your
home?
Over-demanding recall
When the question require respondents to remember too much detail.
How much did you save within the past 12 months?
photo
For people it is difficult to estimate their flows of savings
for such
long period.
Higher School of Economics , Moscow, 2011
22.
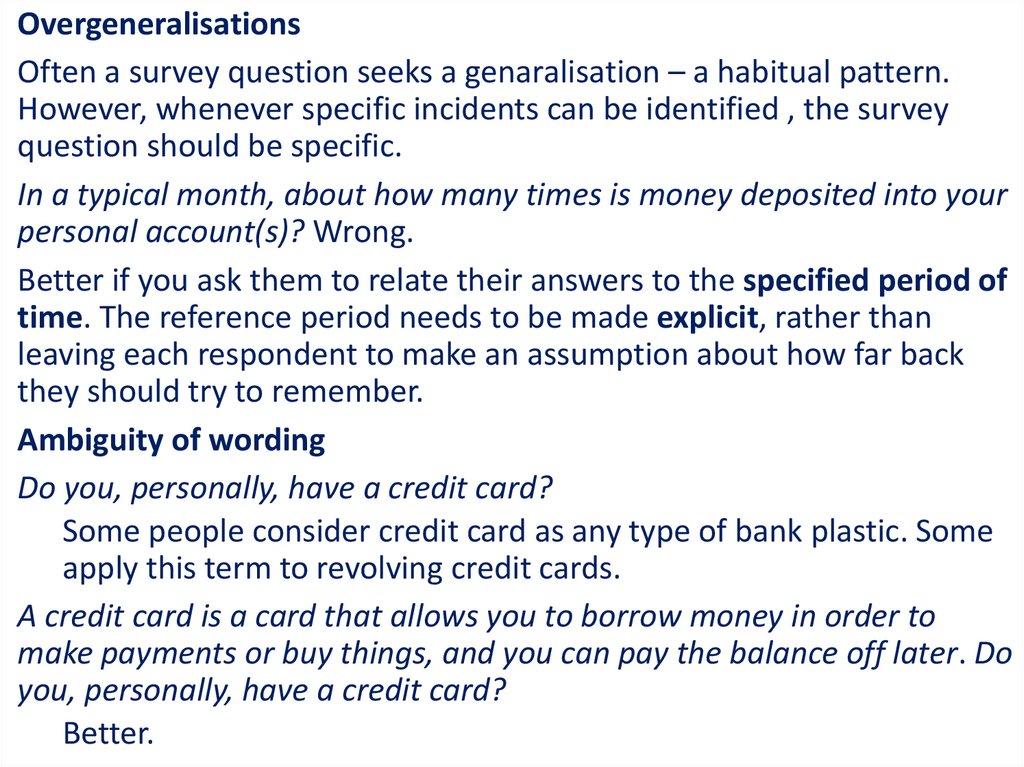
OvergeneralisationsOften a survey question seeks a genaralisation – a habitual pattern.
However, whenever specific incidents can be identified , the survey
question should be specific.
In a typical month, about how many times is money deposited into your
personal account(s)? Wrong.
Better if you ask them to relate their answers to the specified period of
time. The reference period needs to be made explicit, rather than
leaving each respondent to make an assumption about how far back
they should try to remember.
Ambiguity of wording
Do you, personally, have a credit card?
Some people consider credit card as any type of bank plastic. Some
apply this term to revolving credit cards.
A credit card is a card that allows you to borrow money in order to
make payments or buy things, and you can pay the balancephoto
off later. Do
you, personally, have a credit card?
Better.
Higher School of Economics , Moscow, 2011
23.
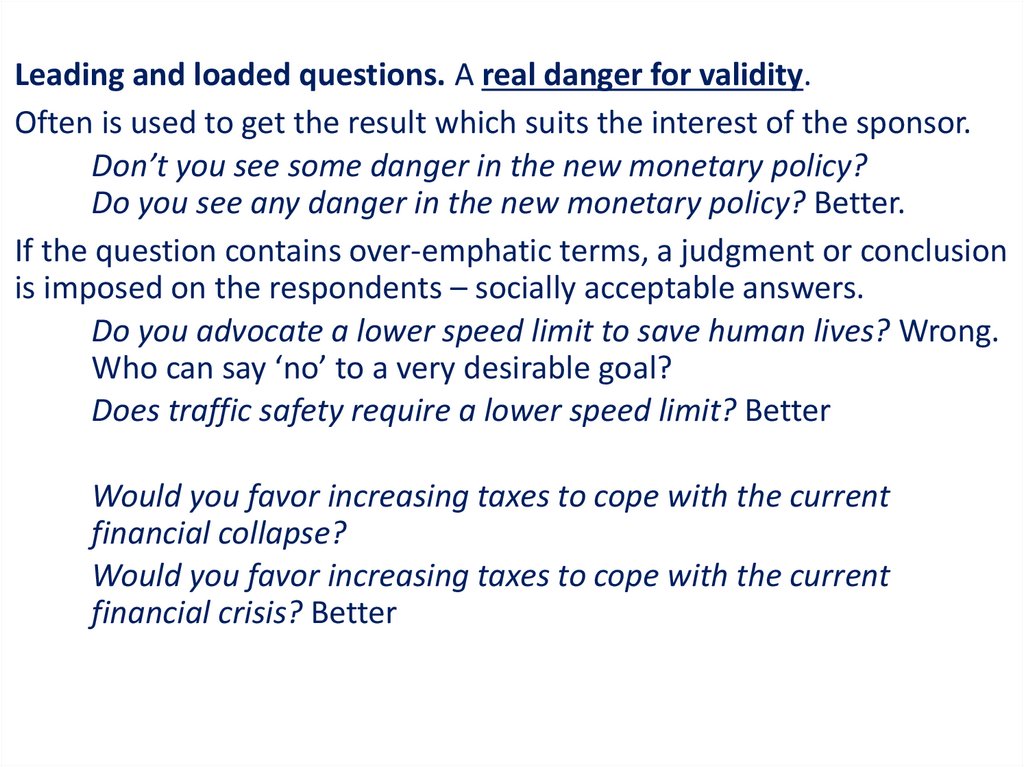
Leading and loaded questions. A real danger for validity.Often is used to get the result which suits the interest of the sponsor.
Don’t you see some danger in the new monetary policy?
Do you see any danger in the new monetary policy? Better.
If the question contains over-emphatic terms, a judgment or conclusion
is imposed on the respondents – socially acceptable answers.
Do you advocate a lower speed limit to save human lives? Wrong.
Who can say ‘no’ to a very desirable goal?
Does traffic safety require a lower speed limit? Better
Would you favor increasing taxes to cope with the current
financial collapse?
Would you favor increasing taxes to cope with the current
financial crisis? Better
photo
Higher School of Economics , Moscow, 2011
24.
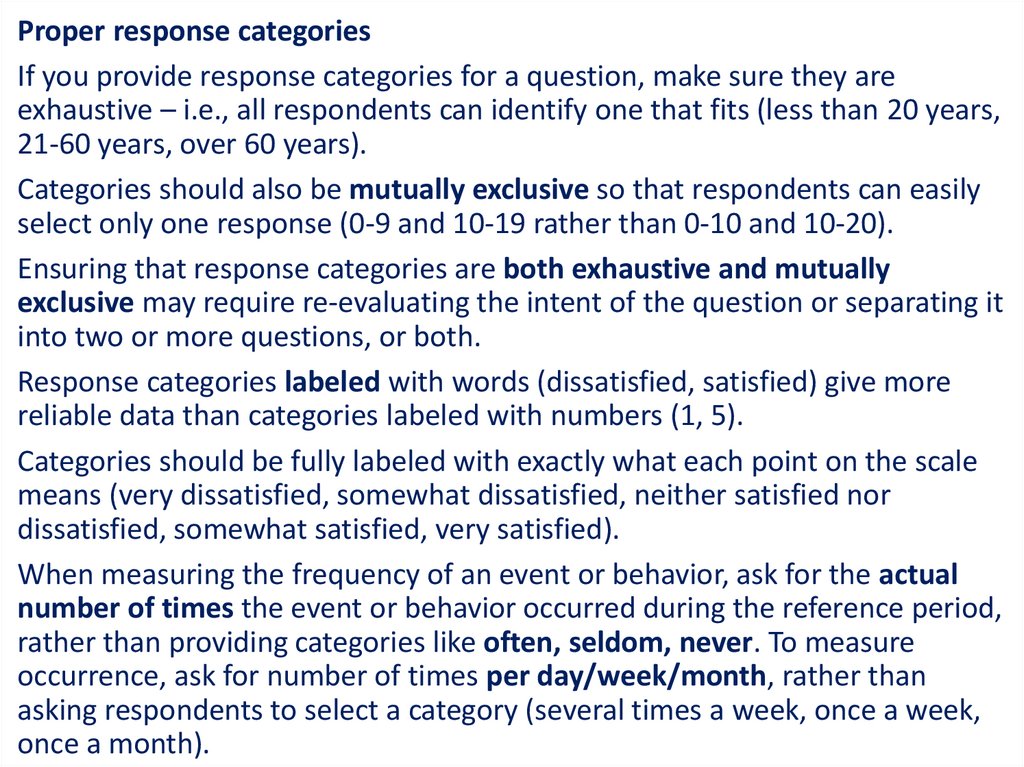
Proper response categoriesIf you provide
response categories forbias
a question,
make
sure they are
Instrumentation
and
error
exhaustive – i.e., all respondents can identify one that fits (less than 20 years,
21-60 years, over 60 years).
Categories should also be mutually exclusive so that respondents can easily
select only one response (0-9 and 10-19 rather than 0-10 and 10-20).
Ensuring that response categories are both exhaustive and mutually
exclusive may require re-evaluating the intent of the question or separating it
into two or more questions, or both.
Response categories labeled with words (dissatisfied, satisfied) give more
reliable data than categories labeled with numbers (1, 5).
Categories should be fully labeled with exactly what each point on the scale
means (very dissatisfied, somewhat dissatisfied, neither satisfied nor
dissatisfied, somewhat satisfied, very satisfied).
When measuring the frequency of an event or behavior, ask for the actual
number of times the event or behavior occurred during the reference period,
rather than providing categories like often, seldom, never. To measure
photo
occurrence, ask for number of times per day/week/month, rather than
asking respondents to select a category (several times a week, once a week,
once a month).
Higher School of Economics , Moscow, 2011
25.
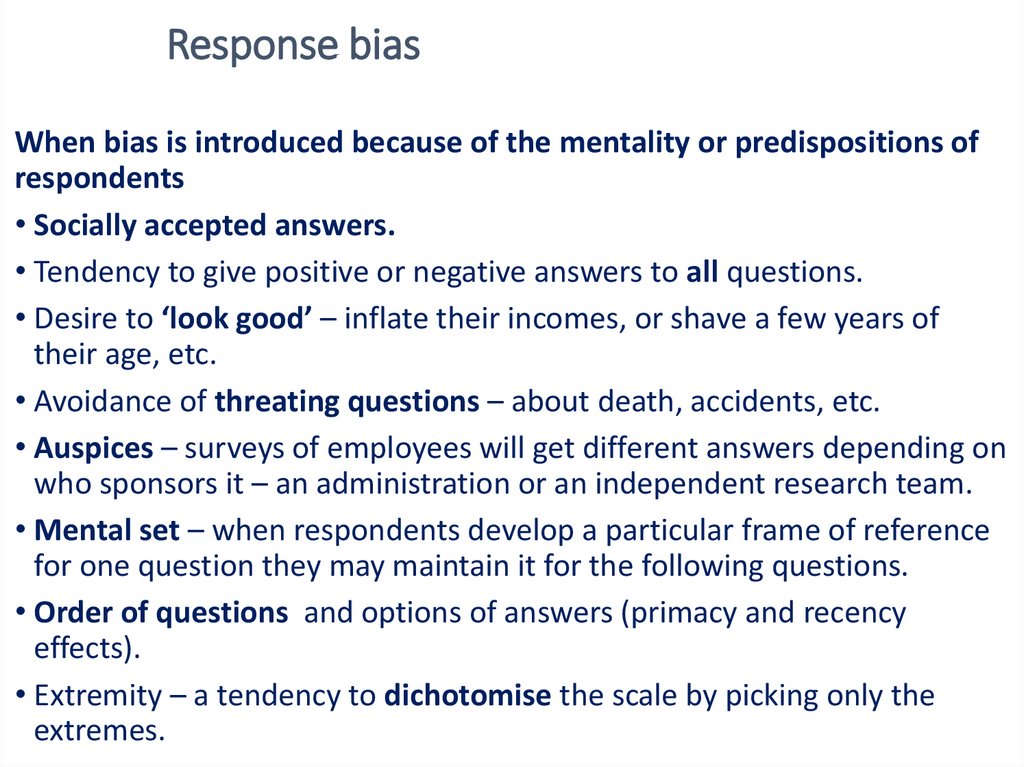
Response biasWhen bias is introduced because of the mentality or predispositions of
respondents
• Socially accepted answers.
• Tendency to give positive or negative answers to all questions.
• Desire to ‘look good’ – inflate their incomes, or shave a few years of
their age, etc.
• Avoidance of threating questions – about death, accidents, etc.
• Auspices – surveys of employees will get different answers depending on
who sponsors it – an administration or an independent research team.
• Mental set – when respondents develop a particular frame of reference
for one question they may maintain it for the following questions.
• Order of questions and options of answers (primacy and recency
photo
effects).
• Extremity – a tendency to dichotomise the scale by picking only the
extremes.
Higher School of Economics , Moscow, 2011
26.
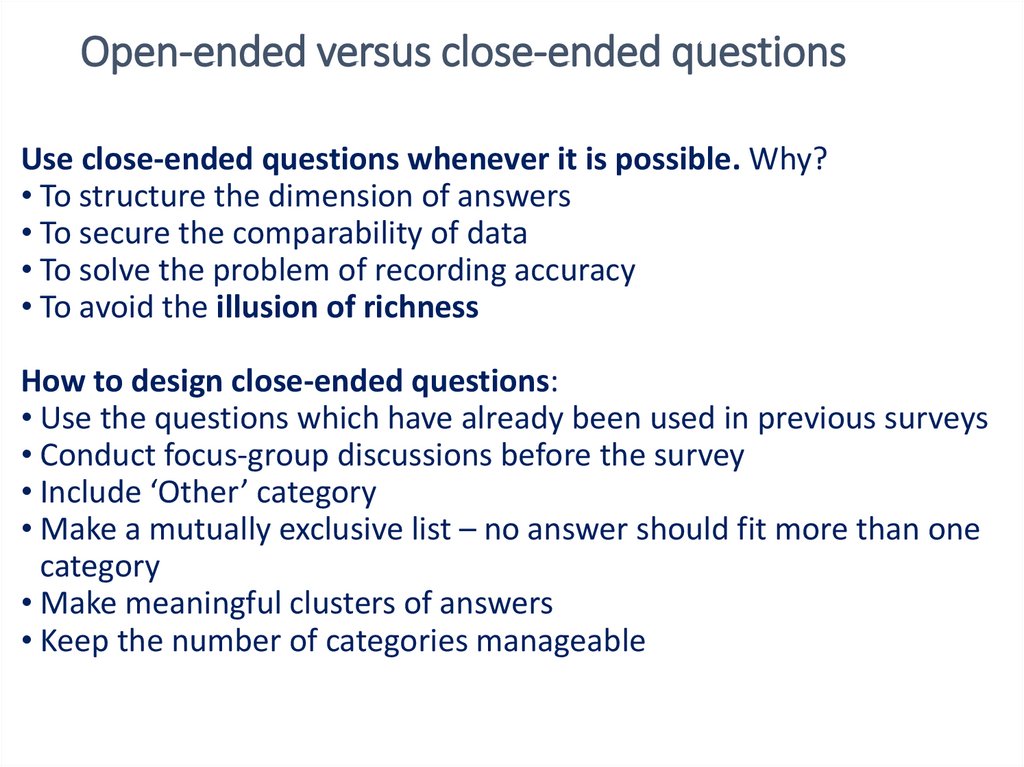
Open-ended versus close-ended questionsUse close-ended questions whenever it is possible. Why?
• To structure the dimension of answers
• To secure the comparability of data
• To solve the problem of recording accuracy
• To avoid the illusion of richness
How to design close-ended questions:
• Use the questions which have already been used in previous surveys
• Conduct focus-group discussions before the survey
• Include ‘Other’ category
• Make a mutually exclusive list – no answer should fit more than one
category
• Make meaningful clusters of answers
• Keep the number of categories manageable
photo
Higher School of Economics , Moscow, 2011
27.
HSE library books on survey methodology• Phillips, P. P., Aaron, B. C., & Phillips, J. J. (2013). Survey Basics.
American Society for Training & Development
https://search.ebscohost.com/login.aspx?direct=true&db=nlebk&AN
=802206&ebv=EK&ppid=Page-__-63
• Bourke, J., Kirby, A., & Doran, J. (2016). SURVEY & QUESTIONNAIRE
DESIGN : Collecting Primary Data to Answer Research Questions.
NuBooks.
https://search.ebscohost.com/login.aspx?direct=true&db=nlebk&AN
=1460401&lang=ru
10/16/11
28.
• How to compose questions• How to create item scales
• How to build questionnaires
photo
29.
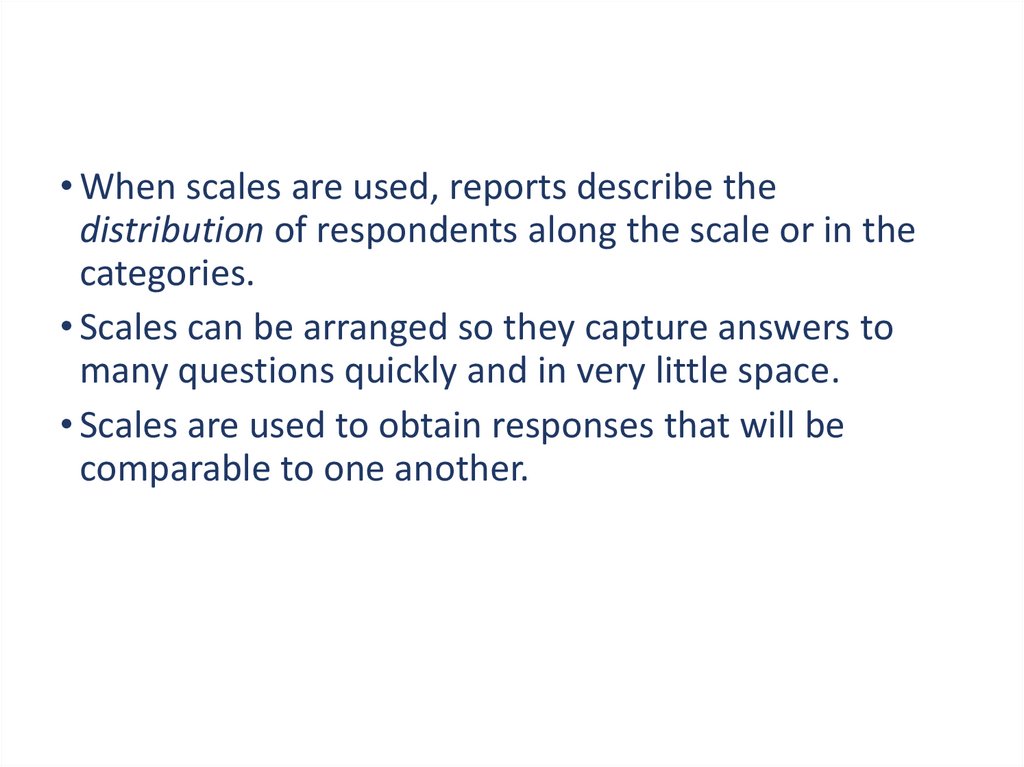
Why scales are used?• When scales are used, reports describe the
distribution of respondents along the scale or in the
categories.
• Scales can be arranged so they capture answers to
many questions quickly and in very little space.
• Scales are used to obtain responses that will be
comparable to one another.
photo
Higher School of Economics , Moscow, 2017
30.
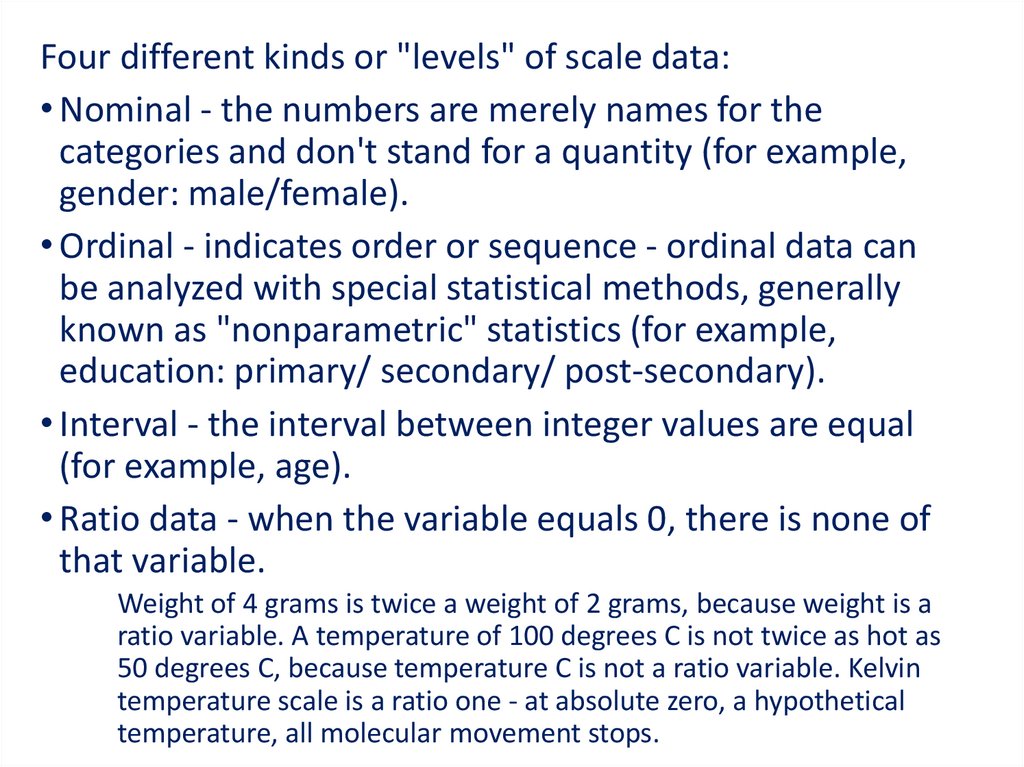
Four different kinds or "levels" of scale data:Scale Data Types
• Nominal - the numbers are merely names for the
categories and don't stand for a quantity (for example,
gender: male/female).
• Ordinal - indicates order or sequence - ordinal data can
be analyzed with special statistical methods, generally
known as "nonparametric" statistics (for example,
education: primary/ secondary/ post-secondary).
• Interval - the interval between integer values are equal
(for example, age).
• Ratio data - when the variable equals 0, there is none of
that variable.
Weight of 4 grams is twice a weight of 2 grams, because weight is a
ratio variable. A temperature of 100 degrees C is not twicephoto
as hot as
50 degrees C, because temperature C is not a ratio variable. Kelvin
temperature scale is a ratio one - at absolute zero, a hypothetical
temperature, all molecular movement stops.
Higher School of Economics , Moscow, 2017
31.
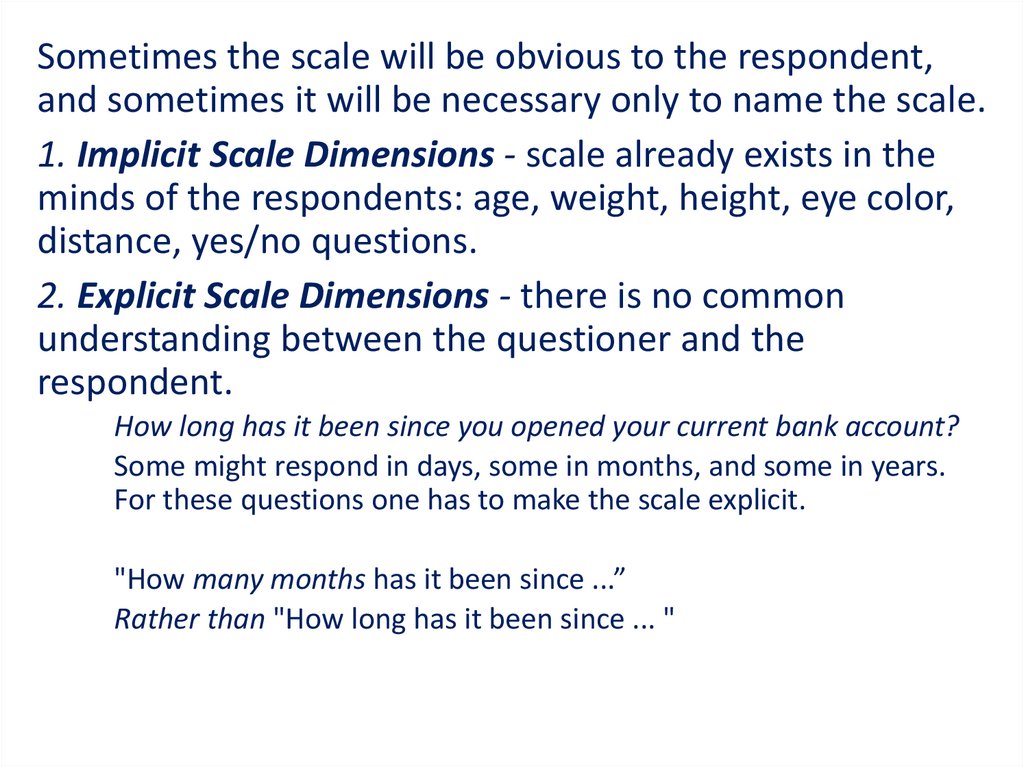
Sometimes the scale will be obvious to the respondent,Implicit
and
and sometimes
it will
be explicit
necessary scale
only to dimensions
name the scale.
1. Implicit Scale Dimensions - scale already exists in the
minds of the respondents: age, weight, height, eye color,
distance, yes/no questions.
2. Explicit Scale Dimensions - there is no common
understanding between the questioner and the
respondent.
How long has it been since you opened your current bank account?
Some might respond in days, some in months, and some in years.
For these questions one has to make the scale explicit.
"How many months has it been since ...”
Rather than "How long has it been since ... "
photo
Higher School of Economics , Moscow, 2017
32.
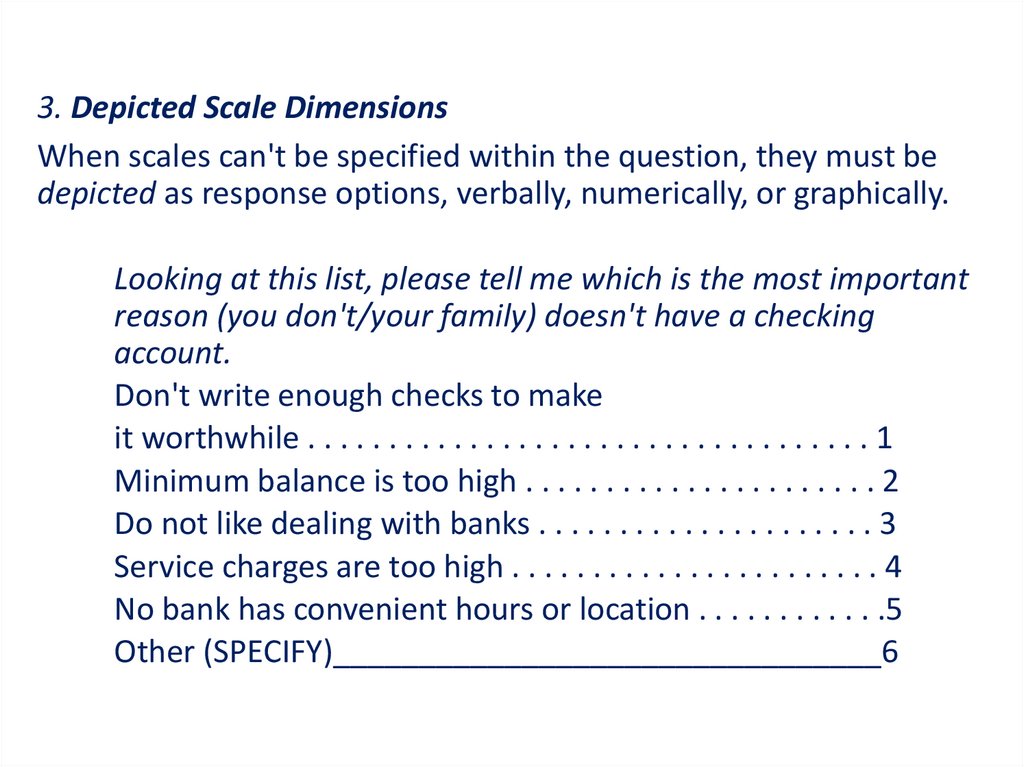
3. Depicted Scale DimensionsWhen scales can't be specified within the question, they must be
depicted as response options, verbally, numerically, or graphically.
Looking at this list, please tell me which is the most important
reason (you don't/your family) doesn't have a checking
account.
Don't write enough checks to make
it worthwhile . . . . . . . . . . . . . . . . . . . . . . . . . . . . . . . . . . . 1
Minimum balance is too high . . . . . . . . . . . . . . . . . . . . . . 2
Do not like dealing with banks . . . . . . . . . . . . . . . . . . . . . 3
Service charges are too high . . . . . . . . . . . . . . . . . . . . . . . 4
No bank has convenient hours or location . . . . . . . . . . . .5
photo
Other (SPECIFY)________________________________6
33.
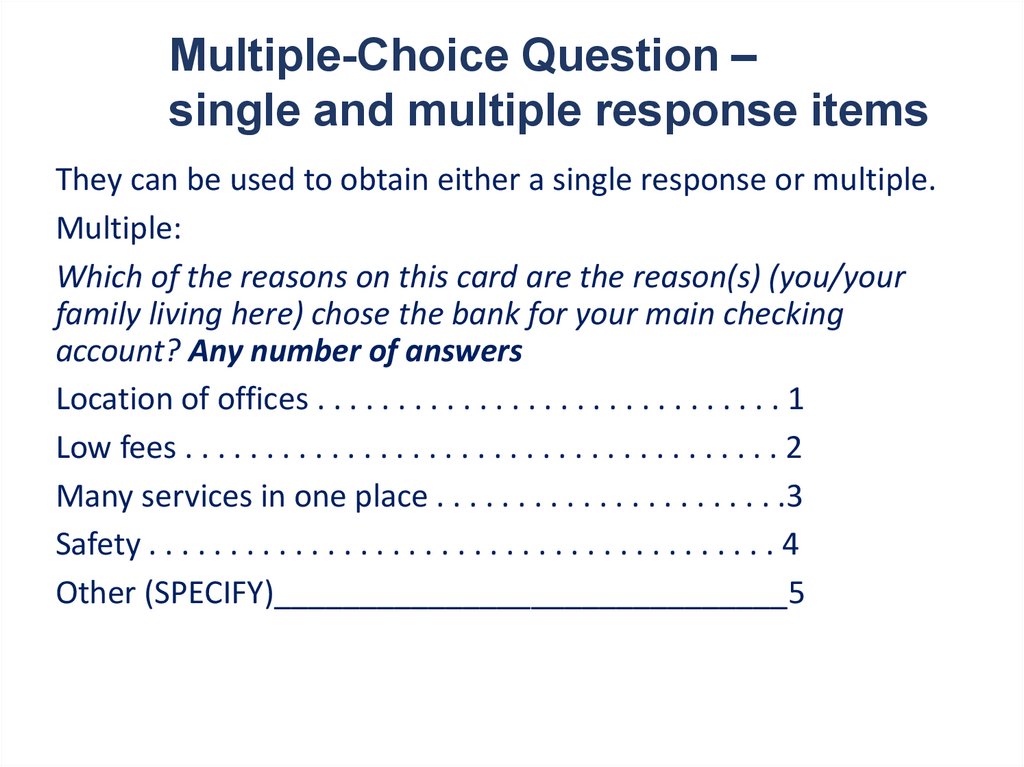
Multiple-Choice Question –single and multiple response items
They can be used to obtain either a single response or multiple.
Multiple:
Which of the reasons on this card are the reason(s) (you/your
family living here) chose the bank for your main checking
account? Any number of answers
Location of offices . . . . . . . . . . . . . . . . . . . . . . . . . . . . . 1
Low fees . . . . . . . . . . . . . . . . . . . . . . . . . . . . . . . . . . . . . 2
Many services in one place . . . . . . . . . . . . . . . . . . . . . .3
Safety . . . . . . . . . . . . . . . . . . . . . . . . . . . . . . . . . . . . . . . 4
Other (SPECIFY)______________________________5
photo
34.
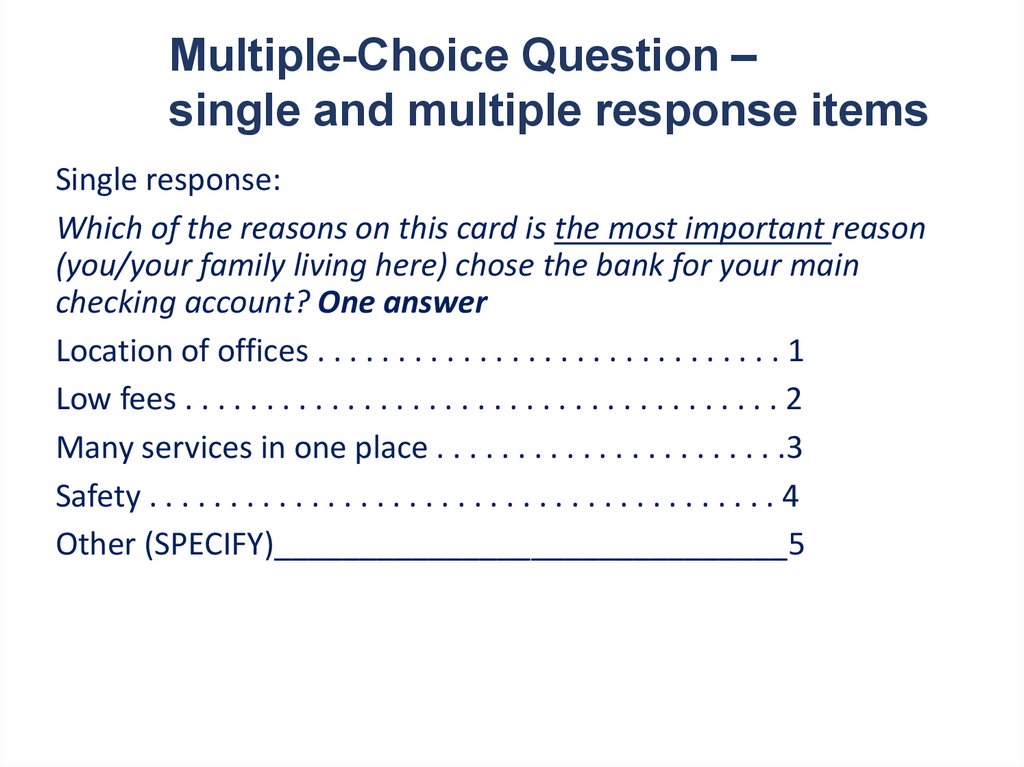
Multiple-Choice Question –single and multiple response items
Single response:
Which of the reasons on this card is the most important reason
(you/your family living here) chose the bank for your main
checking account? One answer
Location of offices . . . . . . . . . . . . . . . . . . . . . . . . . . . . . 1
Low fees . . . . . . . . . . . . . . . . . . . . . . . . . . . . . . . . . . . . . 2
Many services in one place . . . . . . . . . . . . . . . . . . . . . .3
Safety . . . . . . . . . . . . . . . . . . . . . . . . . . . . . . . . . . . . . . . 4
Other (SPECIFY)______________________________5
photo
Higher School of Economics , Moscow, 2017
35.
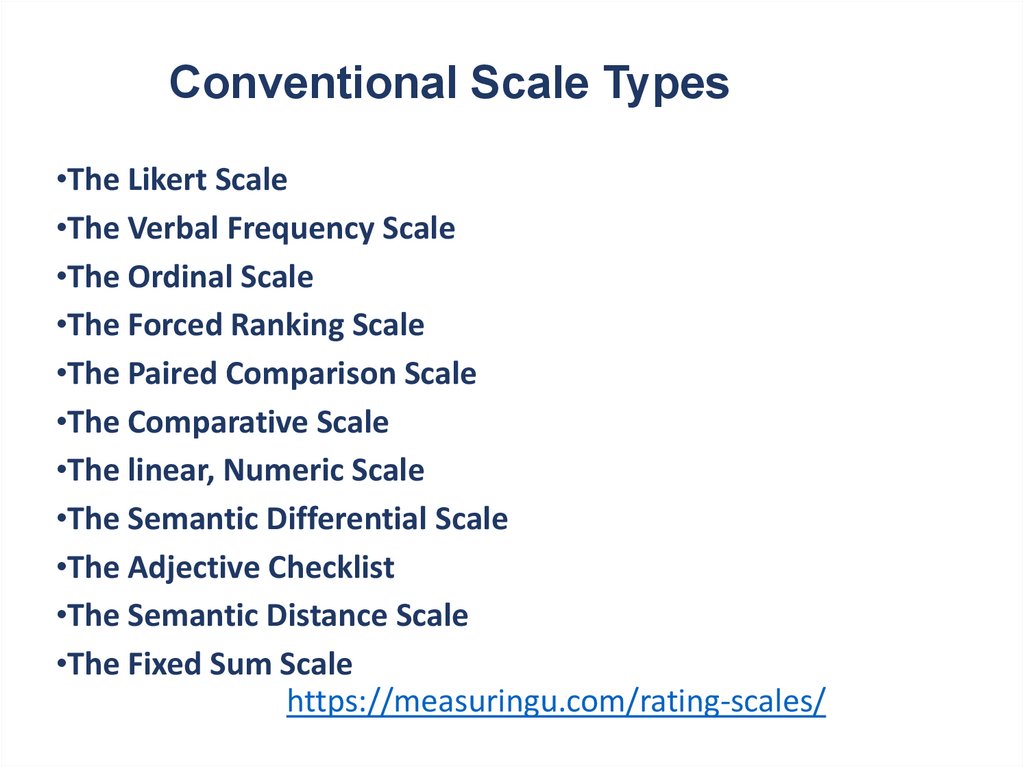
Conventional Scale Types•The Likert Scale
•The Verbal Frequency Scale
•The Ordinal Scale
•The Forced Ranking Scale
•The Paired Comparison Scale
•The Comparative Scale
•The linear, Numeric Scale
•The Semantic Differential Scale
•The Adjective Checklist
•The Semantic Distance Scale
photo
•The Fixed Sum Scale
https://measuringu.com/rating-scales/
36.
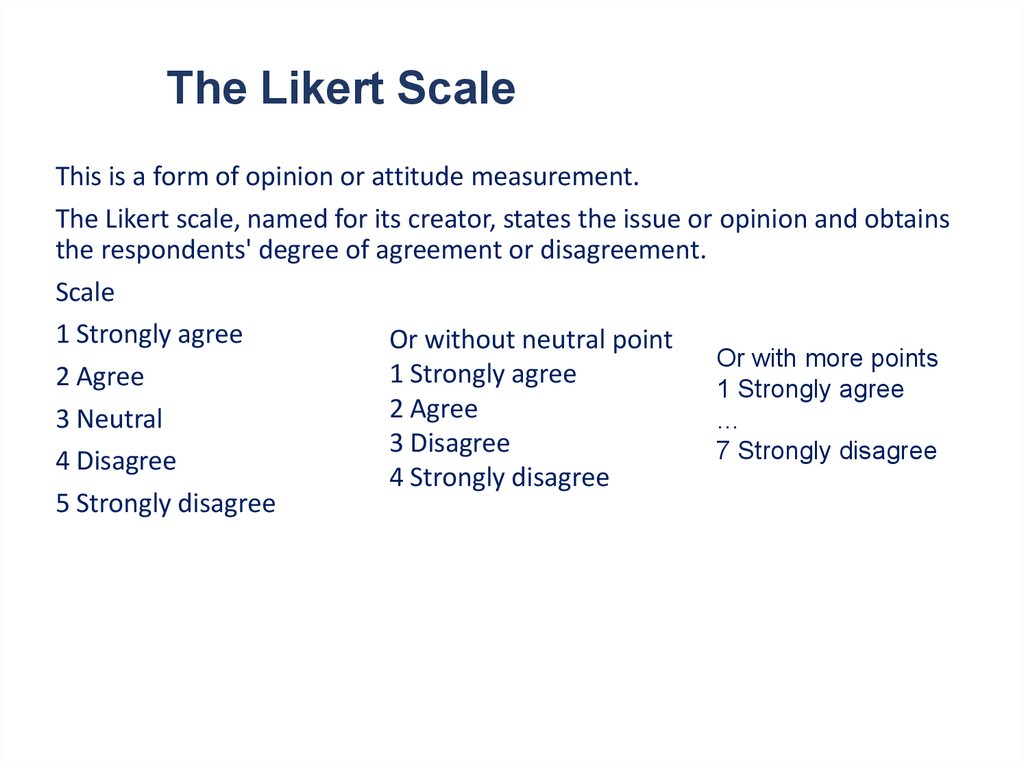
The Likert ScaleThis is a form of opinion or attitude measurement.
The Likert scale, named for its creator, states the issue or opinion and obtains
the respondents' degree of agreement or disagreement.
Scale
1 Strongly agree
Or without neutral point
Or with more points
1 Strongly agree
2 Agree
1 Strongly agree
2
Agree
3 Neutral
…
3 Disagree
7 Strongly disagree
4 Disagree
4 Strongly disagree
5 Strongly disagree
photo
37.
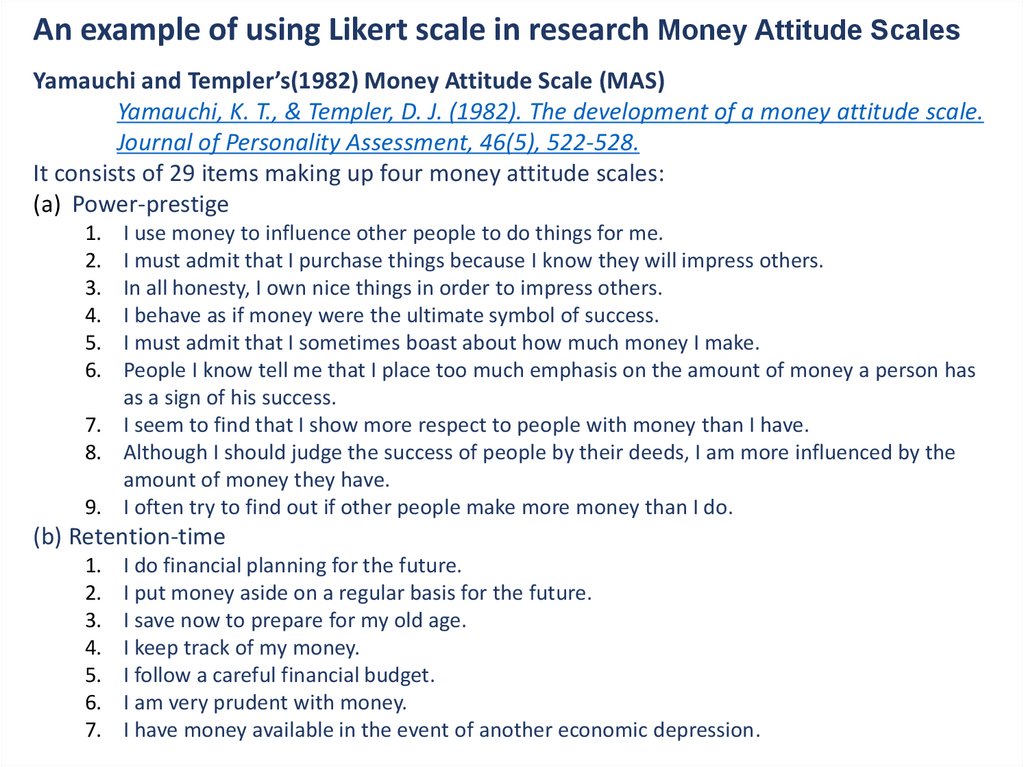
An example of using Likert scale in research Money Attitude ScalesYamauchi and Templer’s(1982) Money Attitude Scale (MAS)
Yamauchi, K. T., & Templer, D. J. (1982). The development of a money attitude scale.
Journal of Personality Assessment, 46(5), 522-528.
It consists of 29 items making up four money attitude scales:
(a) Power-prestige
1.
2.
3.
4.
5.
6.
I use money to influence other people to do things for me.
I must admit that I purchase things because I know they will impress others.
In all honesty, I own nice things in order to impress others.
I behave as if money were the ultimate symbol of success.
I must admit that I sometimes boast about how much money I make.
People I know tell me that I place too much emphasis on the amount of money a person has
as a sign of his success.
7. I seem to find that I show more respect to people with money than I have.
8. Although I should judge the success of people by their deeds, I am more influenced by the
amount of money they have.
9. I often try to find out if other people make more money than I do.
(b) Retention-time
1.
2.
3.
4.
5.
6.
7.
I do financial planning for the future.
I put money aside on a regular basis for the future.
I save now to prepare for my old age.
I keep track of my money.
I follow a careful financial budget.
I am very prudent with money.
I have money available in the event of another economic depression.
photo
38.
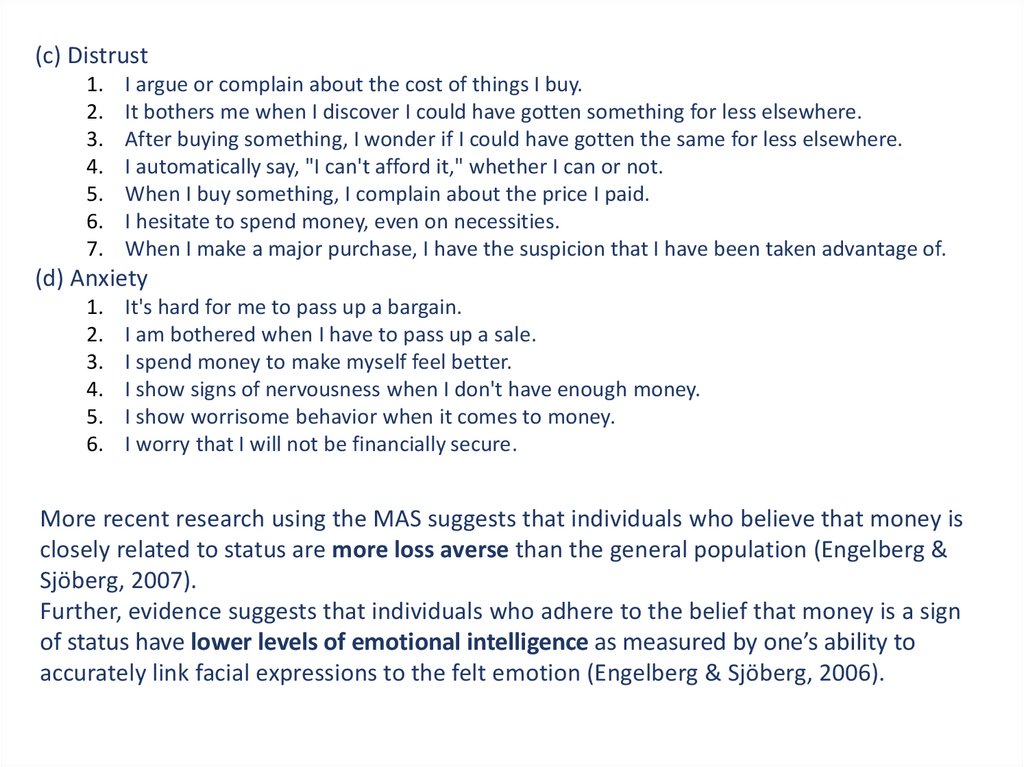
(с) Distrust1.
2.
3.
4.
5.
6.
7.
I argue or complain about the cost of things I buy.
It bothers me when I discover I could have gotten something for less elsewhere.
After buying something, I wonder if I could have gotten the same for less elsewhere.
I automatically say, "I can't afford it," whether I can or not.
When I buy something, I complain about the price I paid.
I hesitate to spend money, even on necessities.
When I make a major purchase, I have the suspicion that I have been taken advantage of.
(d) Anxiety
1.
2.
3.
4.
5.
6.
It's hard for me to pass up a bargain.
I am bothered when I have to pass up a sale.
I spend money to make myself feel better.
I show signs of nervousness when I don't have enough money.
I show worrisome behavior when it comes to money.
I worry that I will not be financially secure.
More recent research using the MAS suggests that individuals who believe that money is
closely related to status are more loss averse than the general population (Engelberg &
Sjöberg, 2007).
Further, evidence suggests that individuals who adhere to the belief that money is a sign
of status have lower levels of emotional intelligence as measured by one’s ability
photo to
accurately link facial expressions to the felt emotion (Engelberg & Sjöberg, 2006).
39.
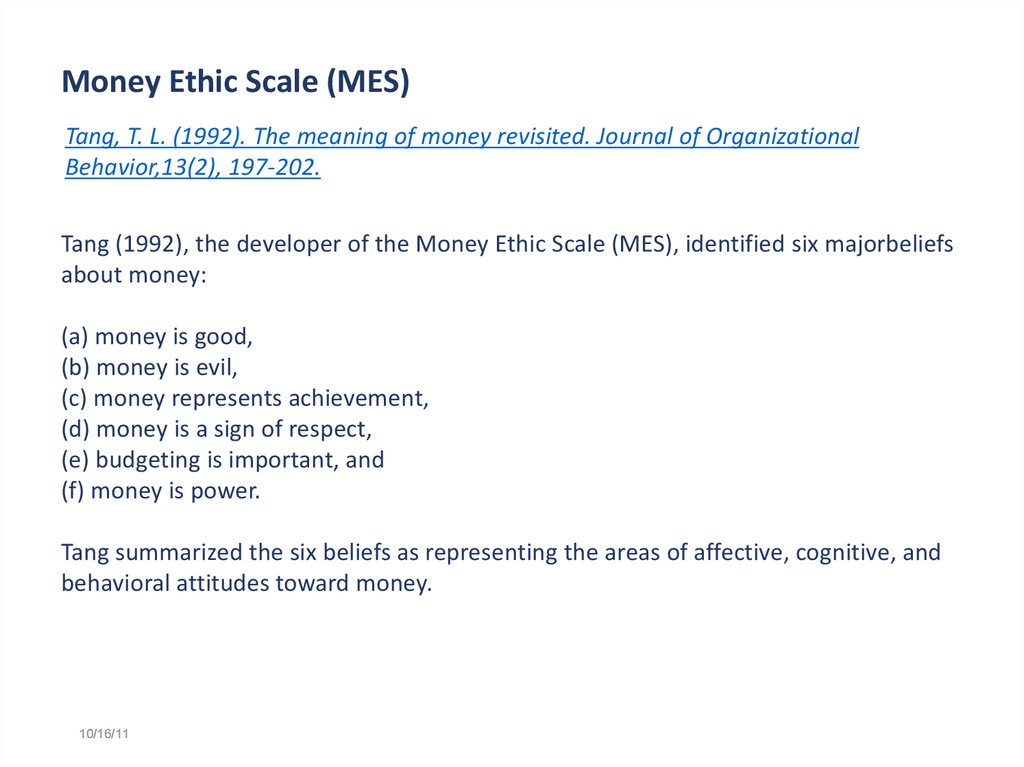
Money Ethic Scale (MES)Tang, T. L. (1992). The meaning of money revisited. Journal of Organizational
Behavior,13(2), 197-202.
Tang (1992), the developer of the Money Ethic Scale (MES), identified six majorbeliefs
about money:
(a) money is good,
(b) money is evil,
(c) money represents achievement,
(d) money is a sign of respect,
(e) budgeting is important, and
(f) money is power.
Tang summarized the six beliefs as representing the areas of affective, cognitive, and
behavioral attitudes toward money.
10/16/11
40.
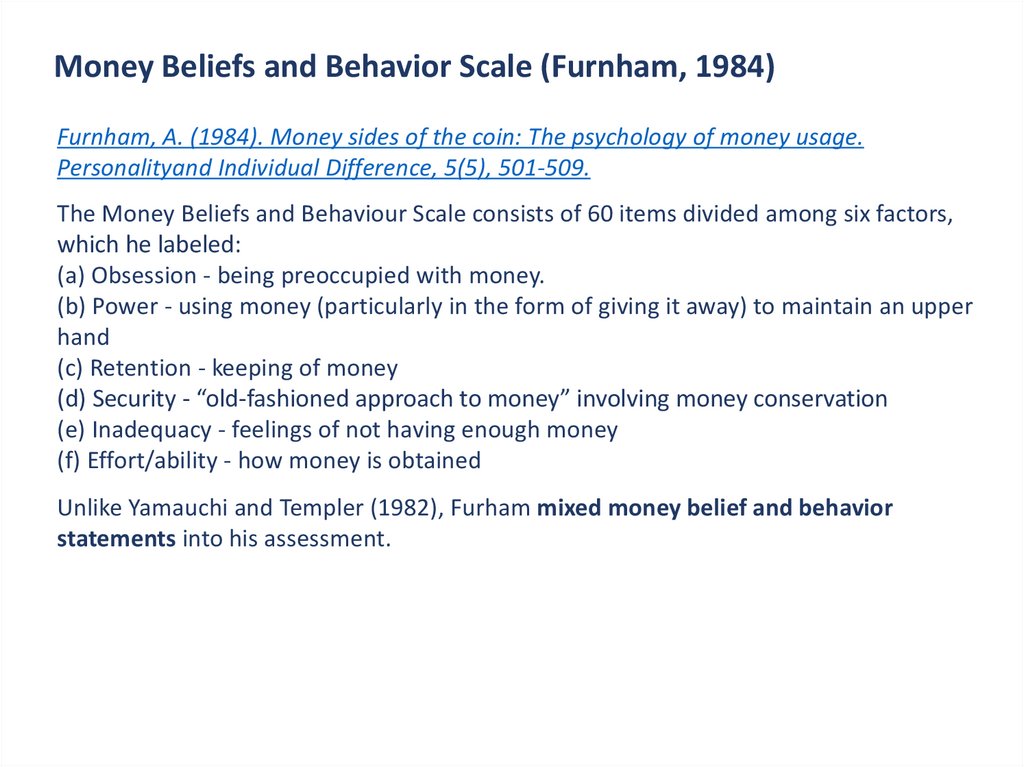
Money Beliefs and Behavior Scale (Furnham, 1984)Furnham, A. (1984). Money sides of the coin: The psychology of money usage.
Personalityand Individual Difference, 5(5), 501-509.
The Money Beliefs and Behaviour Scale consists of 60 items divided among six factors,
which he labeled:
(a) Obsession - being preoccupied with money.
(b) Power - using money (particularly in the form of giving it away) to maintain an upper
hand
(c) Retention - keeping of money
(d) Security - “old-fashioned approach to money” involving money conservation
(e) Inadequacy - feelings of not having enough money
(f) Effort/ability - how money is obtained
Unlike Yamauchi and Templer (1982), Furham mixed money belief and behavior
statements into his assessment.
photo
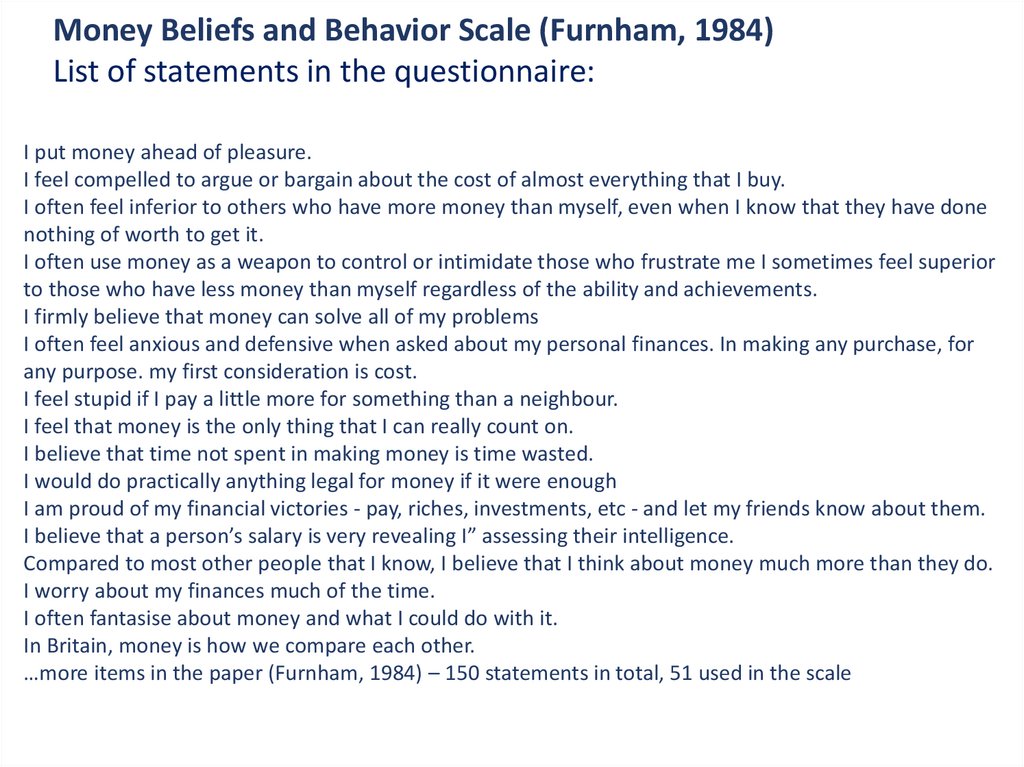
41.
Money Beliefs and Behavior Scale (Furnham, 1984)List of statements in the questionnaire:
I put money ahead of pleasure.
I feel compelled to argue or bargain about the cost of almost everything that I buy.
I often feel inferior to others who have more money than myself, even when I know that they have done
nothing of worth to get it.
I often use money as a weapon to control or intimidate those who frustrate me I sometimes feel superior
to those who have less money than myself regardless of the ability and achievements.
I firmly believe that money can solve all of my problems
I often feel anxious and defensive when asked about my personal finances. In making any purchase, for
any purpose. my first consideration is cost.
I feel stupid if I pay a little more for something than a neighbour.
I feel that money is the only thing that I can really count on.
I believe that time not spent in making money is time wasted.
I would do practically anything legal for money if it were enough
I am proud of my financial victories - pay, riches, investments, etc - and let my friends know about them.
I believe that a person’s salary is very revealing I” assessing their intelligence.
Compared to most other people that I know, I believe that I think about money much more than they do.
I worry about my finances much of the time.
I often fantasise about money and what I could do with it.
In Britain, money is how we compare each other.
photo
…more items in the paper (Furnham, 1984) – 150 statements in total, 51 used in the scale
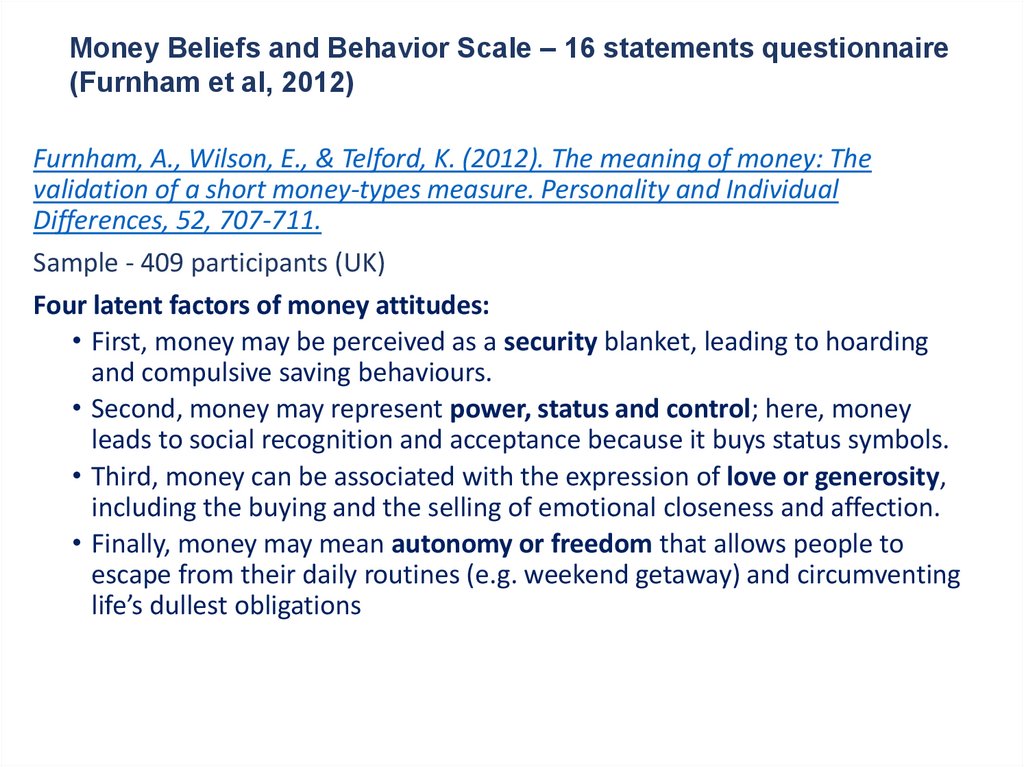
42.
Money Beliefs and Behavior Scale – 16 statements questionnaire(Furnham et al, 2012)
Furnham, A., Wilson, E., & Telford, K. (2012). The meaning of money: The
validation of a short money-types measure. Personality and Individual
Differences, 52, 707-711.
Sample - 409 participants (UK)
Four latent factors of money attitudes:
• First, money may be perceived as a security blanket, leading to hoarding
and compulsive saving behaviours.
• Second, money may represent power, status and control; here, money
leads to social recognition and acceptance because it buys status symbols.
• Third, money can be associated with the expression of love or generosity,
including the buying and the selling of emotional closeness and affection.
• Finally, money may mean autonomy or freedom that allows people to
escape from their daily routines (e.g. weekend getaway) and circumventing
life’s dullest obligations
photo
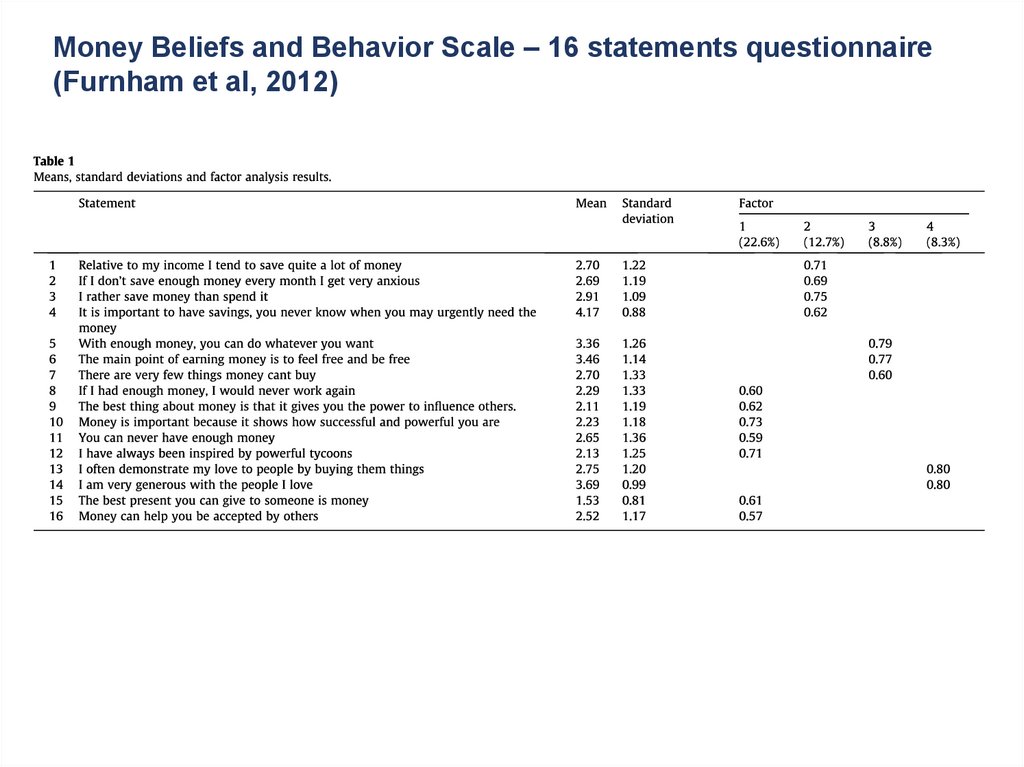
43.
Money Beliefs and Behavior Scale – 16 statements questionnaire(Furnham et al, 2012)
photo
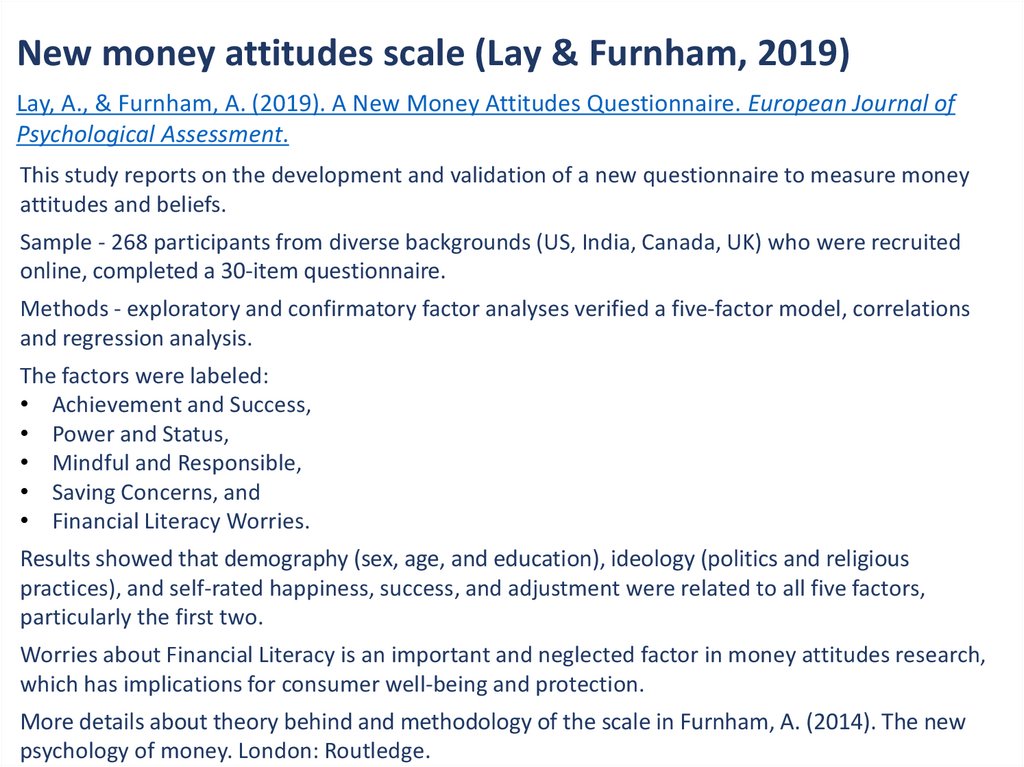
44.
A New Money Attitudes QuestionnaireNew money attitudes scale (Lay & Furnham, 2019)
Lay, A., & Furnham, A. (2019). A New Money Attitudes Questionnaire. European Journal of
Psychological Assessment.
This study reports on the development and validation of a new questionnaire to measure money
attitudes and beliefs.
Sample - 268 participants from diverse backgrounds (US, India, Canada, UK) who were recruited
online, completed a 30-item questionnaire.
Methods - exploratory and confirmatory factor analyses verified a five-factor model, correlations
and regression analysis.
The factors were labeled:
• Achievement and Success,
• Power and Status,
• Mindful and Responsible,
• Saving Concerns, and
• Financial Literacy Worries.
Results showed that demography (sex, age, and education), ideology (politics and religious
practices), and self-rated happiness, success, and adjustment were related to all five factors,
particularly the first two.
photo research,
Worries about Financial Literacy is an important and neglected factor in money attitudes
which has implications for consumer well-being and protection.
More details about theory behind and methodology of the scale in Furnham, A. (2014). The new
psychology of money. London: Routledge.
45.
A New Money Attitudes QuestionnaireValidisation of the the scale in Russian
Tatarko A.N. Social'nyj kapital kak faktor otnosheniya k den'gam. Psihologicheskij
zhurnal, 2012,33(3), 88−97. (in Russian)
Dejneka O.S. Ekonomicheskaya psihologiya: Uchebnoe posobie. St. Petersburg: S.Peterb. gos.universitet, 2000. (in Russian)
Nestik T.A., Gagarina M.A. Validation of the Russian version of A new money behavior
quiz by A. Furnham, S. Grover (MBQ)
photo
46.
Research papers where Money attitudes scales are usedMoney attitudes and impulsive buying
Fenton, O. M., & Furnham, A. (2020). Money Attitudes, Personality and Chronic Impulse
Buying. Applied Psychology, 69(4), 1557–1572.
The paper focuses on the attitudes characterized by the extent to which individuals associate money with
security, freedom, power, and love.
Sample - BBC online survey, N=3577. Method – correlation analysis and three-stage hierarchical
Tobit regression.
Results
Younger females and those with higher household income were more likely to engage in
impulsive buying.
Compulsive buyers were more likely to be obsessed with money. They see money as a
solution to problems and as a symbol of power and status.
Those high on Neuroticism and Extraversion and those low on Conscientiousness were more likely to be
impulse buyers.
All four money attitudes were related to impulsive buying (Money as Security most strongly).
photo
A hierarchical regression indicated that demographic variables accounted for 3 percent, personality a
further 9 percent, and money attitudes a further 13 percent of the variance, showing that these three sets
of variables accounted for around a quarter of the variance.
47.
Research papers where Money attitudes scales are usedFurnham, A., von Stumm, S., & Fenton-O’Creevy, M. (2015). Sex Differences in Money
Pathology in the General Population. Social Indicators Research, 123(3), 701–711.
Over 100,000 British participants of an on-line BBC survey completed two measures
online, one of which assessed “money pathology” and the other four “money types”,
based on the emotional associations of money.
Nearly all measures showed significant sex differences with medium to large effect
sizes, and with females exhibiting more “money pathology” than males.
The biggest difference on the money types was on money being associated with
generosity (money representing love) where men scored much lower than females,
and autonomy (money representing freedom) where men scored higher than women.
For men, more than women, money represented Power and Security.
Men were more likely to be Hoarders while women did more emotional regulatory
purchasing.
Discussion: No regression – correlation analysis – controls are needed. photo
Higher School of Economics , Moscow, 2011
48.
Research papers where Money attitudes scales are usedHenchoz, C., Coste, T. & Wernli, B. Culture, money attitudes and economic outcomes. Swiss J
Economics Statistics 155, 2 (2019).
Research question was to reveal to what extent money attitudes affect economic outcomes.
The link between cultural differences in attitude towards money and their potential impact on
individual financial behaviour.
Sample – three Switzerland’s linguistic regions (French, German, Italian). Online survey (May
2015), N=5000. The sample was taken at random among the three linguistic regions (German,
French and Italian)6 with an intended over-weighting of those from the Italian-speaking region
(10%).
Method - multilevel binary logistical regression analyses.
Three main types of attitudes towards money co-exist:
• the prestige and power attitude
• the money management attitude
• the goal-oriented attitude.
No money attitude significantly influences the savings behaviour.
Culturally shaped attitudes to money are mostly linked with indebtedness and the type of
debts (overdue bill(s) or leasing).
photo debts and
A high score on the prestige–power attitude axis increases the tendency to contract
to have overdue bill(s).
Highergoal-oriented
School of Economics , Moscow,
2011
The
attitude
has no significant effect on ei- ther of the economic outcomes
examined.
49.
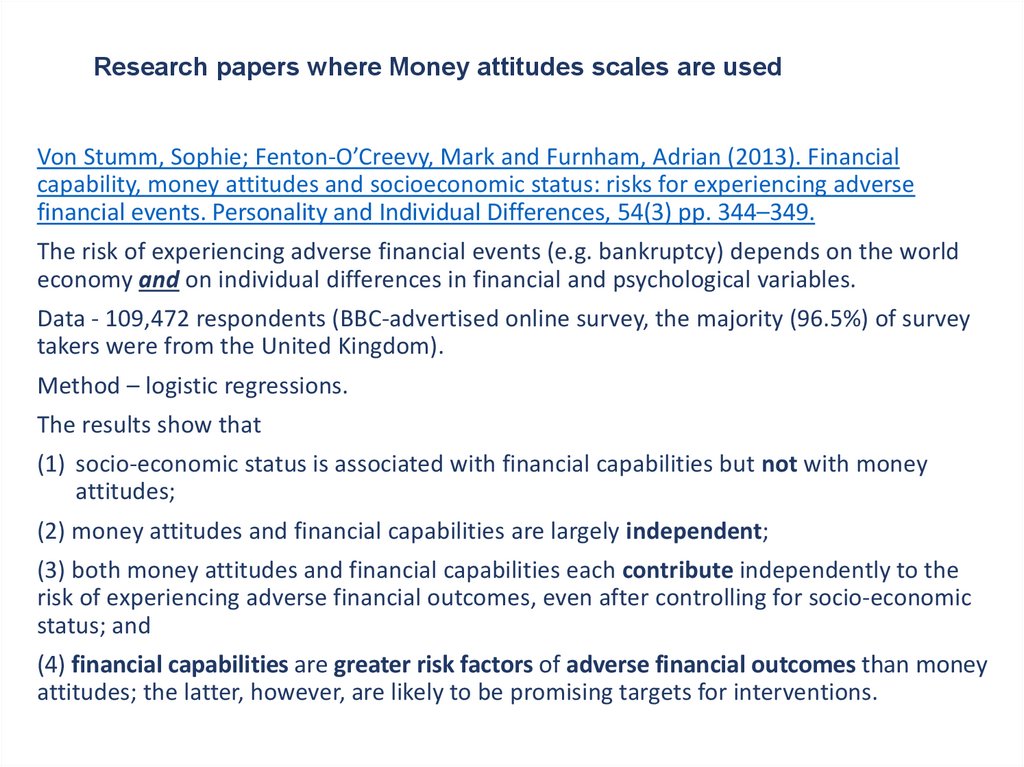
Research papers where Money attitudes scales are usedVon Stumm, Sophie; Fenton-O’Creevy, Mark and Furnham, Adrian (2013). Financial
capability, money attitudes and socioeconomic status: risks for experiencing adverse
financial events. Personality and Individual Differences, 54(3) pp. 344–349.
The risk of experiencing adverse financial events (e.g. bankruptcy) depends on the world
economy and on individual differences in financial and psychological variables.
Data - 109,472 respondents (BBC-advertised online survey, the majority (96.5%) of survey
takers were from the United Kingdom).
Method – logistic regressions.
The results show that
(1) socio-economic status is associated with financial capabilities but not with money
attitudes;
(2) money attitudes and financial capabilities are largely independent;
(3) both money attitudes and financial capabilities each contribute independently to the
risk of experiencing adverse financial outcomes, even after controlling for socio-economic
status; and
photo
(4) financial capabilities are greater risk factors of adverse financial outcomes than money
attitudes; the latter, however, are likely to be promising targets for interventions.
Higher School of Economics , Moscow, 2011
50.
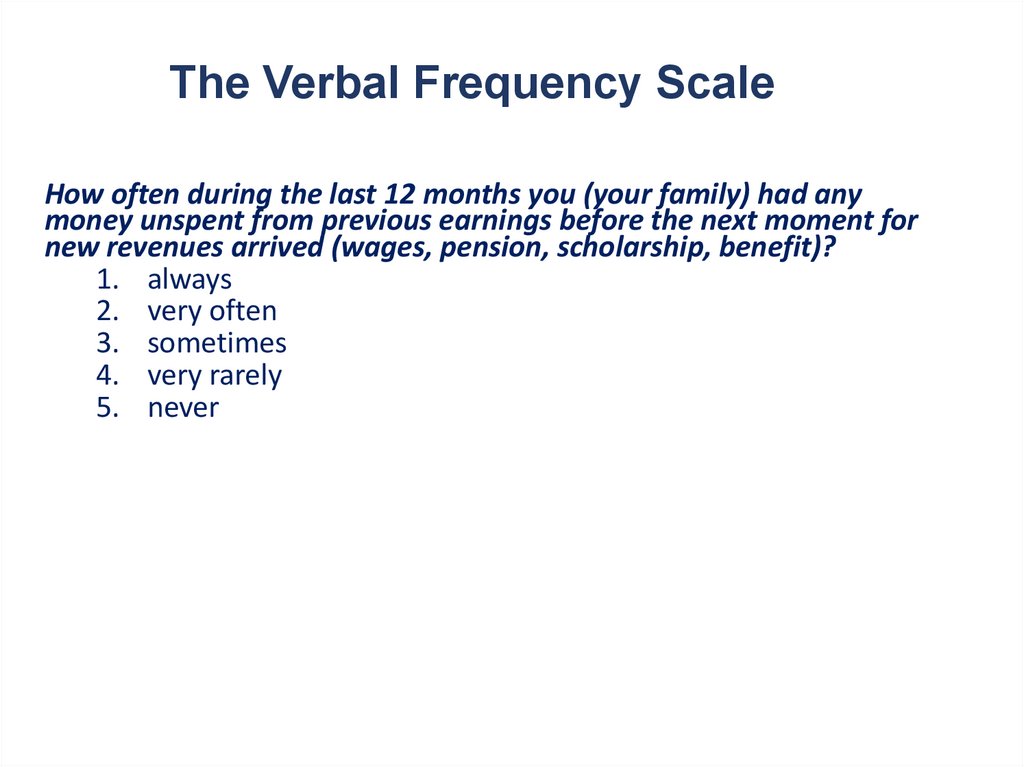
The Verbal Frequency ScaleHow often during the last 12 months you (your family) had any
money unspent from previous earnings before the next moment for
new revenues arrived (wages, pension, scholarship, benefit)?
1. always
2. very often
3. sometimes
4. very rarely
5. never
photo
Higher School of Economics , Moscow, 2011
51.
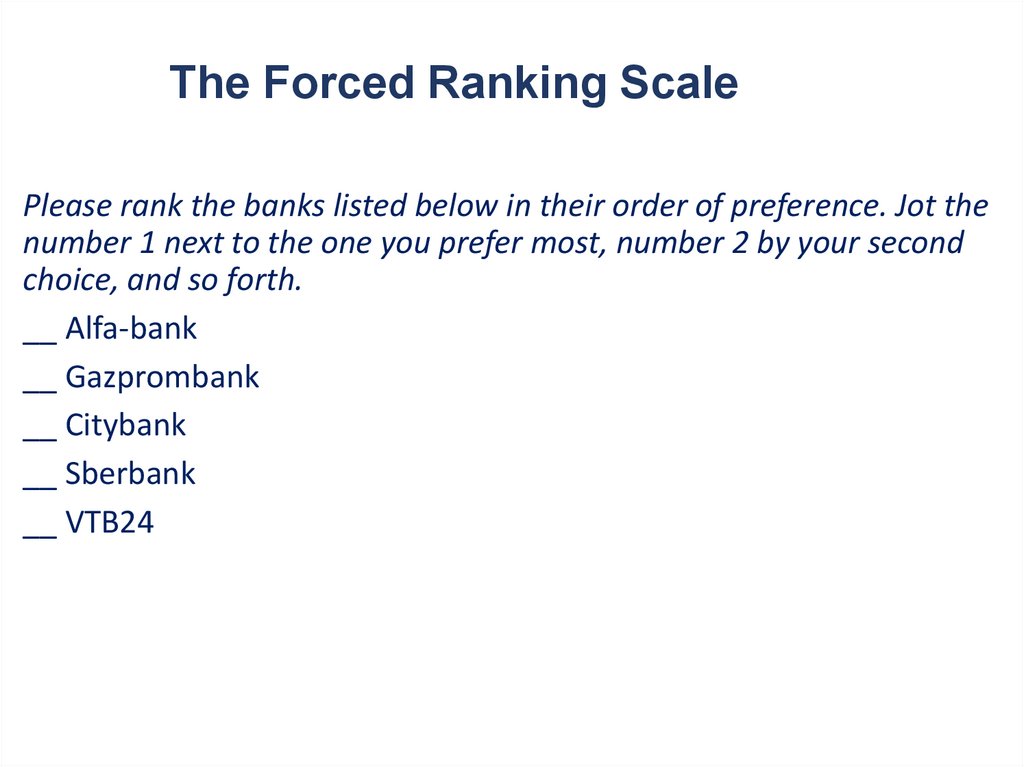
The Forced Ranking ScalePlease rank the banks listed below in their order of preference. Jot the
number 1 next to the one you prefer most, number 2 by your second
choice, and so forth.
__ Alfa-bank
__ Gazprombank
__ Citybank
__ Sberbank
__ VTB24
photo
Higher School of Economics , Moscow, 2011
52.
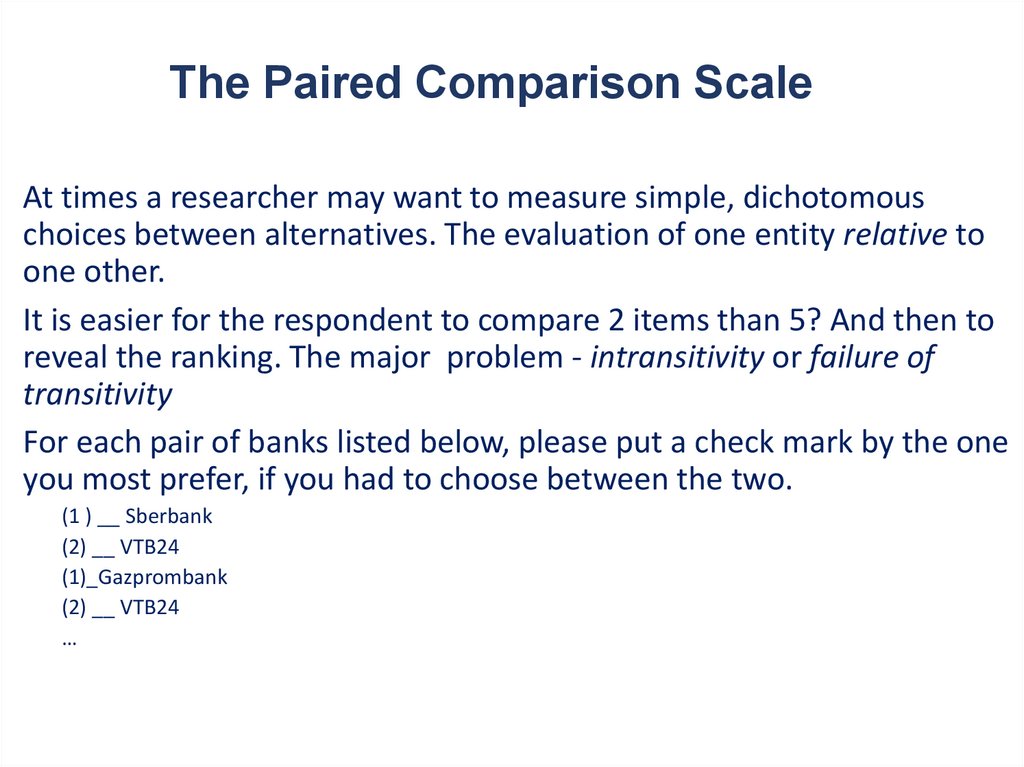
The Paired Comparison ScaleAt times a researcher may want to measure simple, dichotomous
choices between alternatives. The evaluation of one entity relative to
one other.
It is easier for the respondent to compare 2 items than 5? And then to
reveal the ranking. The major problem - intransitivity or failure of
transitivity
For each pair of banks listed below, please put a check mark by the one
you most prefer, if you had to choose between the two.
(1 ) __ Sberbank
(2) __ VTB24
(1)_Gazprombank
(2) __ VTB24
…
Higher School of Economics , Moscow, 2011
photo
53.
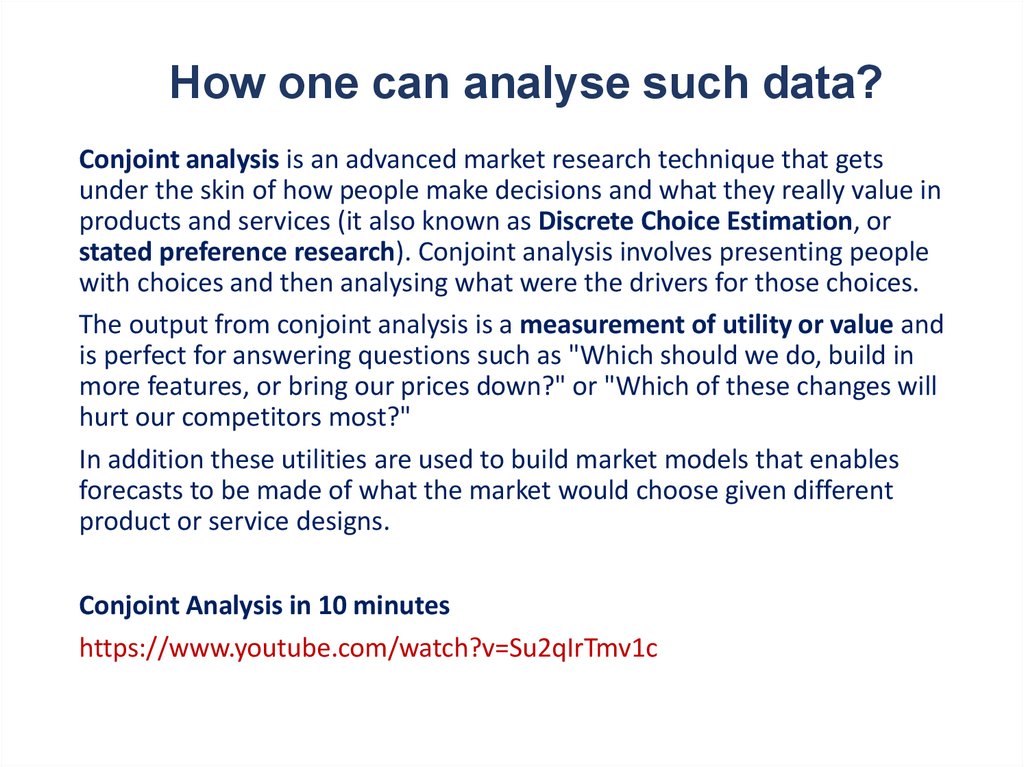
How one can analyse such data?Conjoint analysis is an advanced market research technique that gets
under the skin of how people make decisions and what they really value in
products and services (it also known as Discrete Choice Estimation, or
stated preference research). Conjoint analysis involves presenting people
with choices and then analysing what were the drivers for those choices.
The output from conjoint analysis is a measurement of utility or value and
is perfect for answering questions such as "Which should we do, build in
more features, or bring our prices down?" or "Which of these changes will
hurt our competitors most?"
In addition these utilities are used to build market models that enables
forecasts to be made of what the market would choose given different
product or service designs.
Conjoint Analysis in 10 minutes
https://www.youtube.com/watch?v=Su2qIrTmv1c
Higher School of Economics , Moscow, 2011
photo
54.
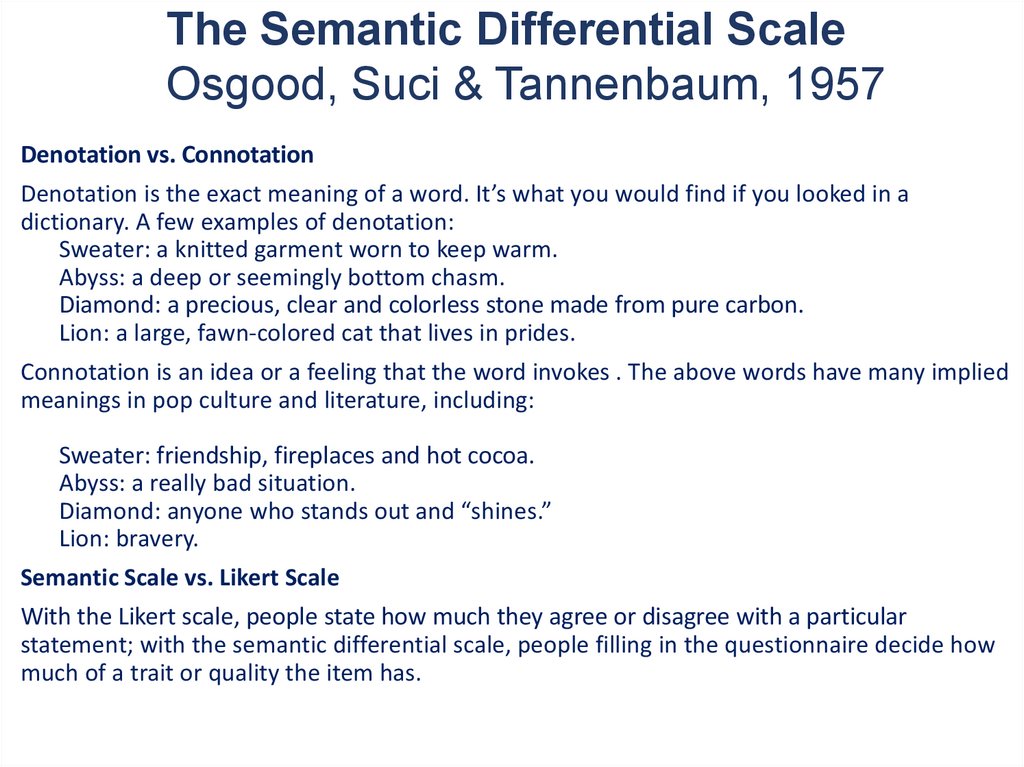
The Semantic Differential ScaleOsgood, Suci & Tannenbaum, 1957
Denotation vs. Connotation
Denotation is the exact meaning of a word. It’s what you would find if you looked in a
dictionary. A few examples of denotation:
Sweater: a knitted garment worn to keep warm.
Abyss: a deep or seemingly bottom chasm.
Diamond: a precious, clear and colorless stone made from pure carbon.
Lion: a large, fawn-colored cat that lives in prides.
Connotation is an idea or a feeling that the word invokes . The above words have many implied
meanings in pop culture and literature, including:
Sweater: friendship, fireplaces and hot cocoa.
Abyss: a really bad situation.
Diamond: anyone who stands out and “shines.”
Lion: bravery.
Semantic Scale vs. Likert Scale
With the Likert scale, people state how much they agree or disagree with a particular
statement; with the semantic differential scale, people filling in the questionnaire
decide how
photo
much of a trait or quality the item has.
Higher School of Economics , Moscow, 2011
55.
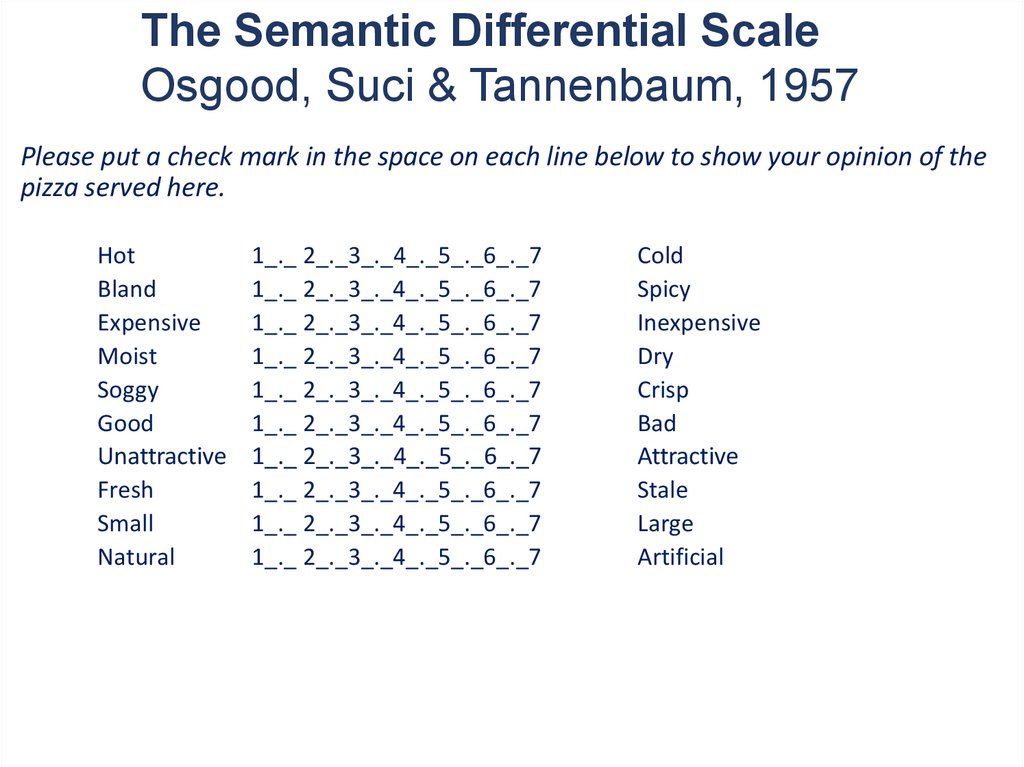
The Semantic Differential ScaleOsgood, Suci & Tannenbaum, 1957
Please put a check mark in the space on each line below to show your opinion of the
pizza served here.
Hot
Bland
Expensive
Moist
Soggy
Good
Unattractive
Fresh
Small
Natural
1_._ 2_._3_._4_._5_._6_._7
1_._ 2_._3_._4_._5_._6_._7
1_._ 2_._3_._4_._5_._6_._7
1_._ 2_._3_._4_._5_._6_._7
1_._ 2_._3_._4_._5_._6_._7
1_._ 2_._3_._4_._5_._6_._7
1_._ 2_._3_._4_._5_._6_._7
1_._ 2_._3_._4_._5_._6_._7
1_._ 2_._3_._4_._5_._6_._7
1_._ 2_._3_._4_._5_._6_._7
Cold
Spicy
Inexpensive
Dry
Crisp
Bad
Attractive
Stale
Large
Artificial
photo
Higher School of Economics , Moscow, 2011
56.
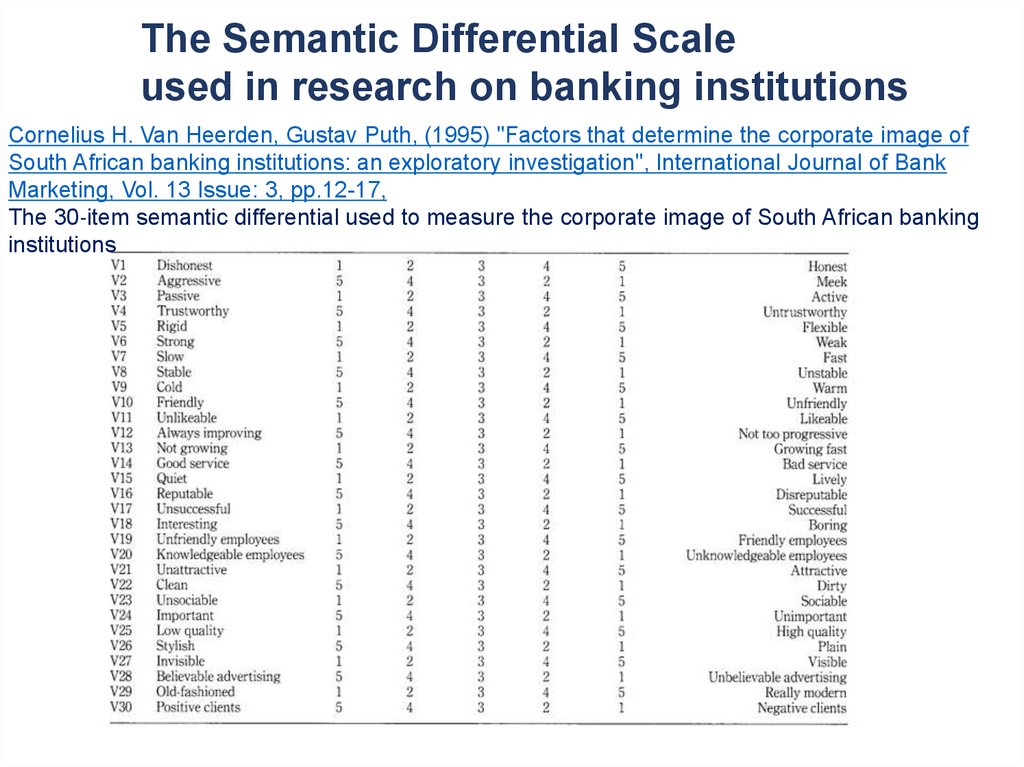
The Semantic Differential Scaleused in research on banking institutions
Cornelius H. Van Heerden, Gustav Puth, (1995) "Factors that determine the corporate image of
South African banking institutions: an exploratory investigation", International Journal of Bank
Marketing, Vol. 13 Issue: 3, pp.12-17,
The 30‐item semantic differential used to measure the corporate image of South African banking
institutions
photo
Higher School of Economics , Moscow, 2011
57.
The Semantic Differential Scalein research on bank space's impression
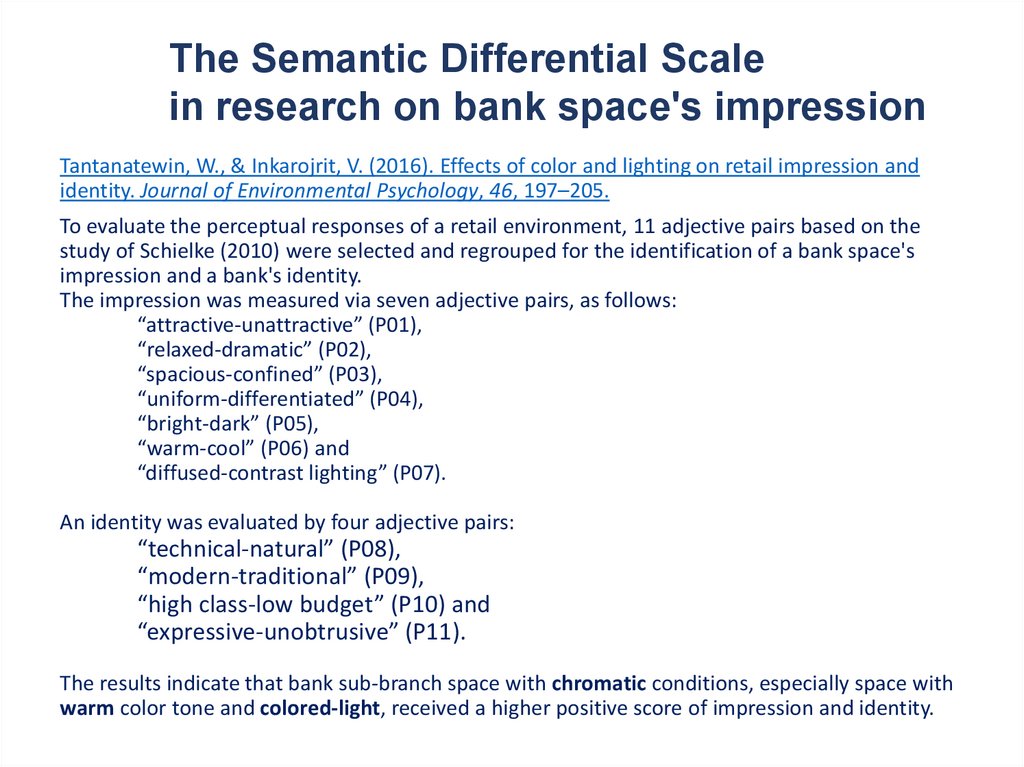
Tantanatewin, W., & Inkarojrit, V. (2016). Effects of color and lighting on retail impression and
identity. Journal of Environmental Psychology, 46, 197–205.
To evaluate the perceptual responses of a retail environment, 11 adjective pairs based on the
study of Schielke (2010) were selected and regrouped for the identification of a bank space's
impression and a bank's identity.
The impression was measured via seven adjective pairs, as follows:
“attractive-unattractive” (P01),
“relaxed-dramatic” (P02),
“spacious-confined” (P03),
“uniform-differentiated” (P04),
“bright-dark” (P05),
“warm-cool” (P06) and
“diffused-contrast lighting” (P07).
An identity was evaluated by four adjective pairs:
“technical-natural” (P08),
“modern-traditional” (P09),
“high class-low budget” (P10) and
“expressive-unobtrusive” (P11).
photo
The results indicate that bank sub-branch space with chromatic conditions, especially space with
warm color tone and colored-light, received a higher positive score of impression and identity.
Higher School of Economics , Moscow, 2011
58.
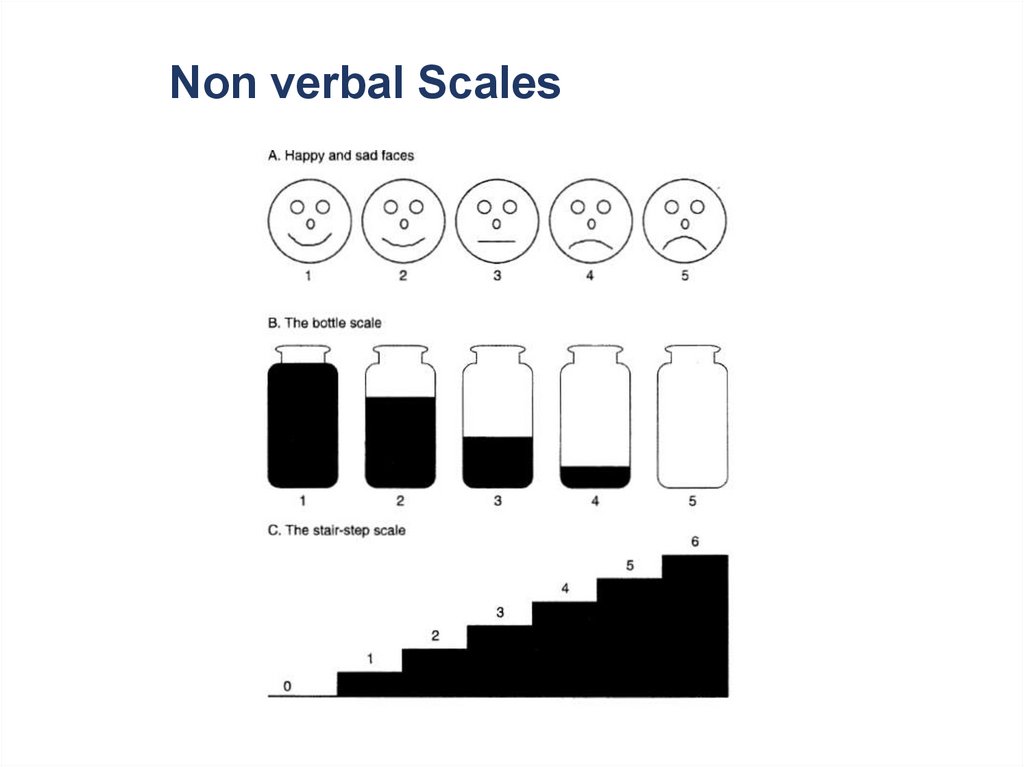
Non verbal Scalesphoto
Higher School of Economics , Moscow, 2011
59.
What these lectures are about?• How to compose questions
• How to create item scales
• How to build questionnaires
photo
Higher School of Economics , Moscow, 2011
60.
Types of questionnaires•Questionnaire is a data collection instrument.
•Two basic types of Q. :
• Self-administrated
• Interview
•Most of the same principles and techniques apply to all types of
interview and self-administrated Q.
photo
Higher School of Economics , Moscow, 2011
61.
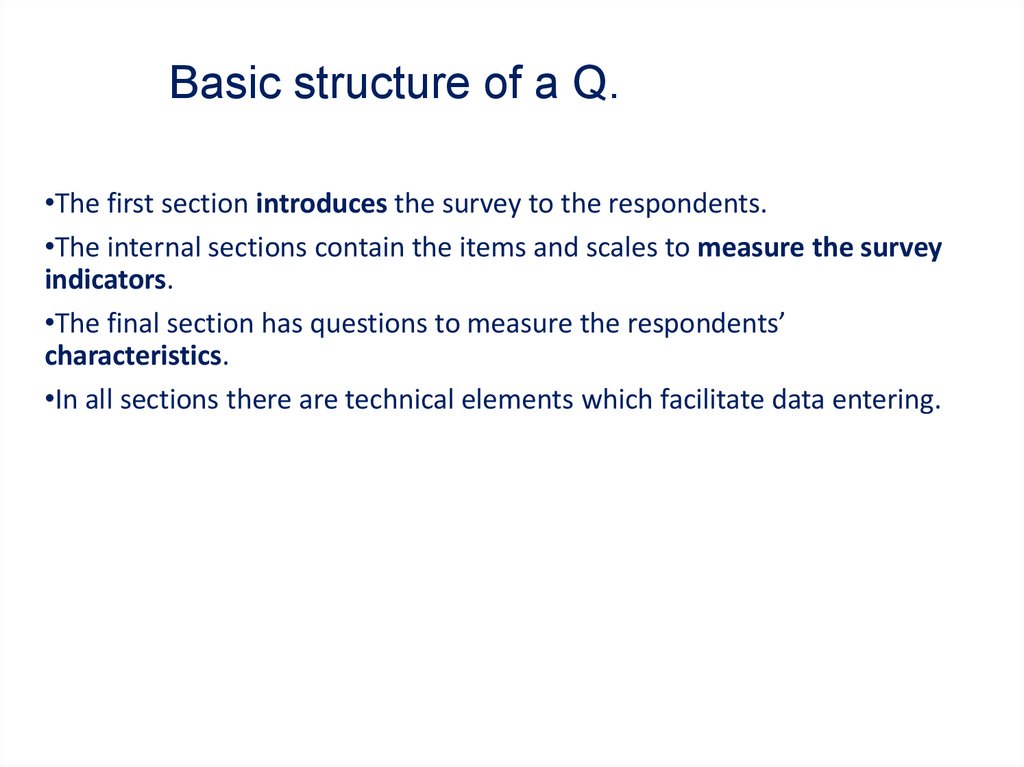
Basic structure of a Q.•The first section introduces the survey to the respondents.
•The internal sections contain the items and scales to measure the survey
indicators.
•The final section has questions to measure the respondents’
characteristics.
•In all sections there are technical elements which facilitate data entering.
photo
Higher School of Economics , Moscow, 2011
62.
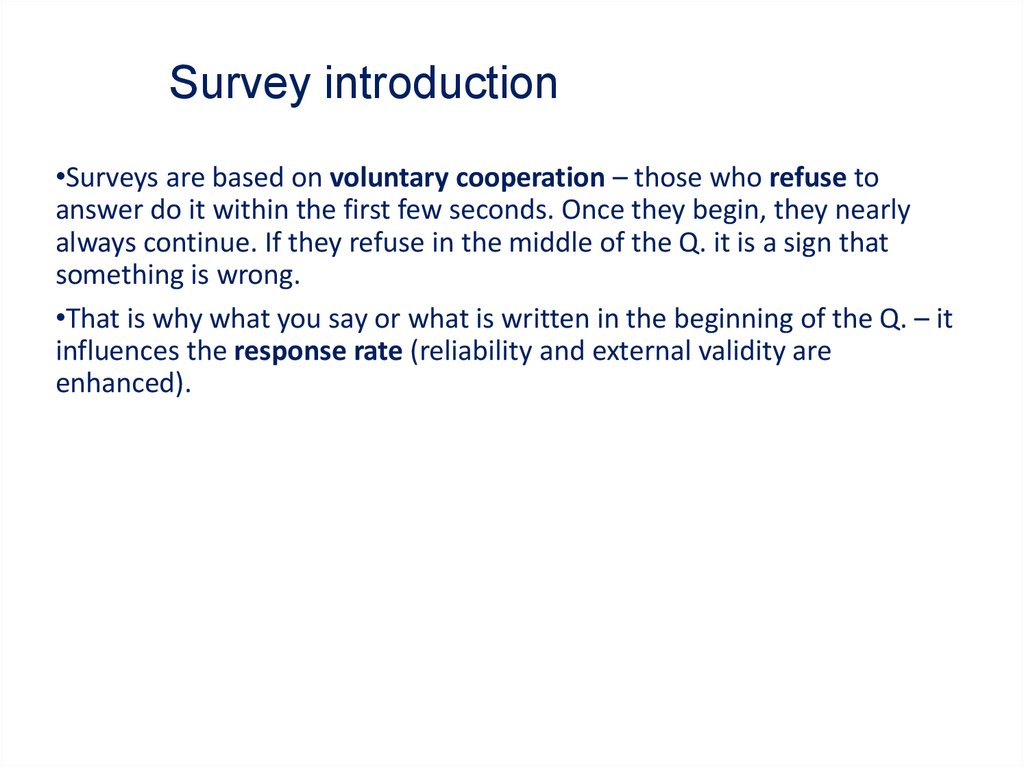
Survey introduction•Surveys are based on voluntary cooperation – those who refuse to
answer do it within the first few seconds. Once they begin, they nearly
always continue. If they refuse in the middle of the Q. it is a sign that
something is wrong.
•That is why what you say or what is written in the beginning of the Q. – it
influences the response rate (reliability and external validity are
enhanced).
photo
Higher School of Economics , Moscow, 2011
63.
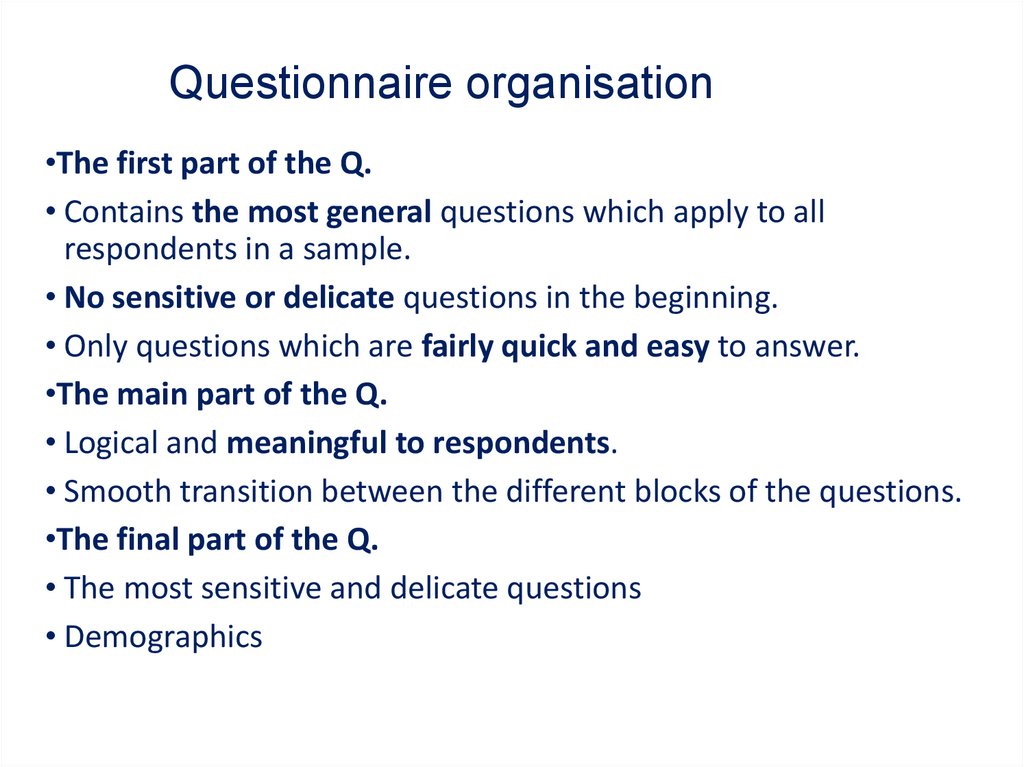
Questionnaire organisation•The first part of the Q.
• Contains the most general questions which apply to all
respondents in a sample.
• No sensitive or delicate questions in the beginning.
• Only questions which are fairly quick and easy to answer.
•The main part of the Q.
• Logical and meaningful to respondents.
• Smooth transition between the different blocks of the questions.
•The final part of the Q.
• The most sensitive and delicate questions
• Demographics
photo
Higher School of Economics , Moscow, 2011
64.
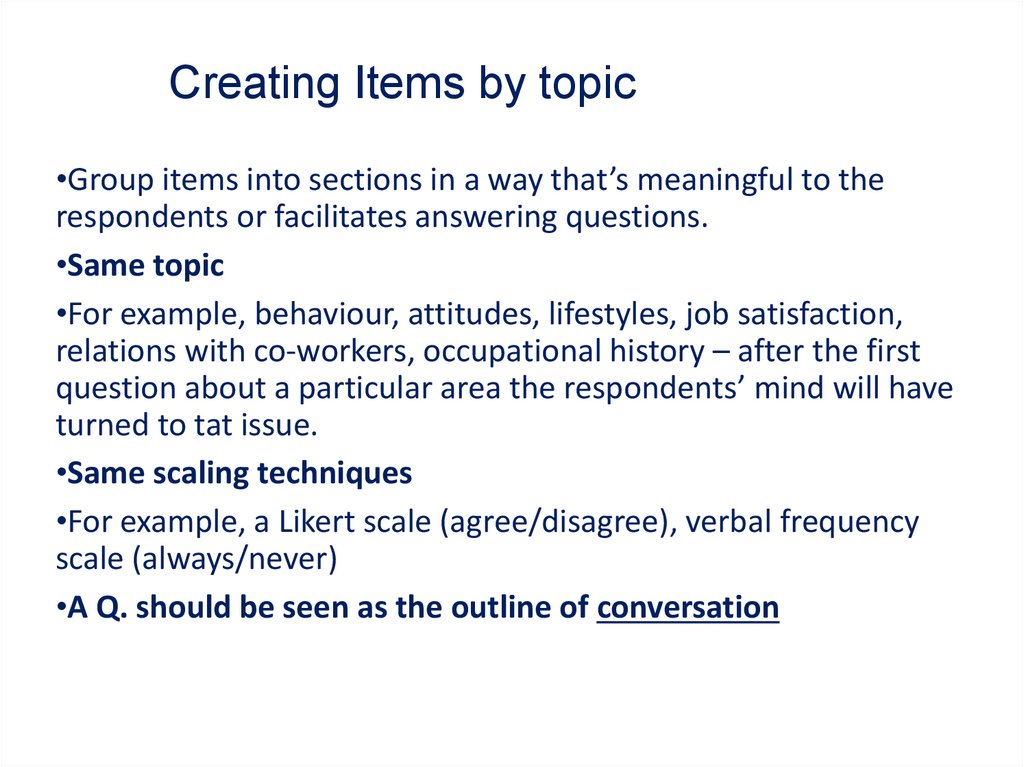
Creating Items by topic•Group items into sections in a way that’s meaningful to the
respondents or facilitates answering questions.
•Same topic
•For example, behaviour, attitudes, lifestyles, job satisfaction,
relations with co-workers, occupational history – after the first
question about a particular area the respondents’ mind will have
turned to tat issue.
•Same scaling techniques
•For example, a Likert scale (agree/disagree), verbal frequency
scale (always/never)
•A Q. should be seen as the outline of conversation
photo
Higher School of Economics , Moscow, 2011
65.
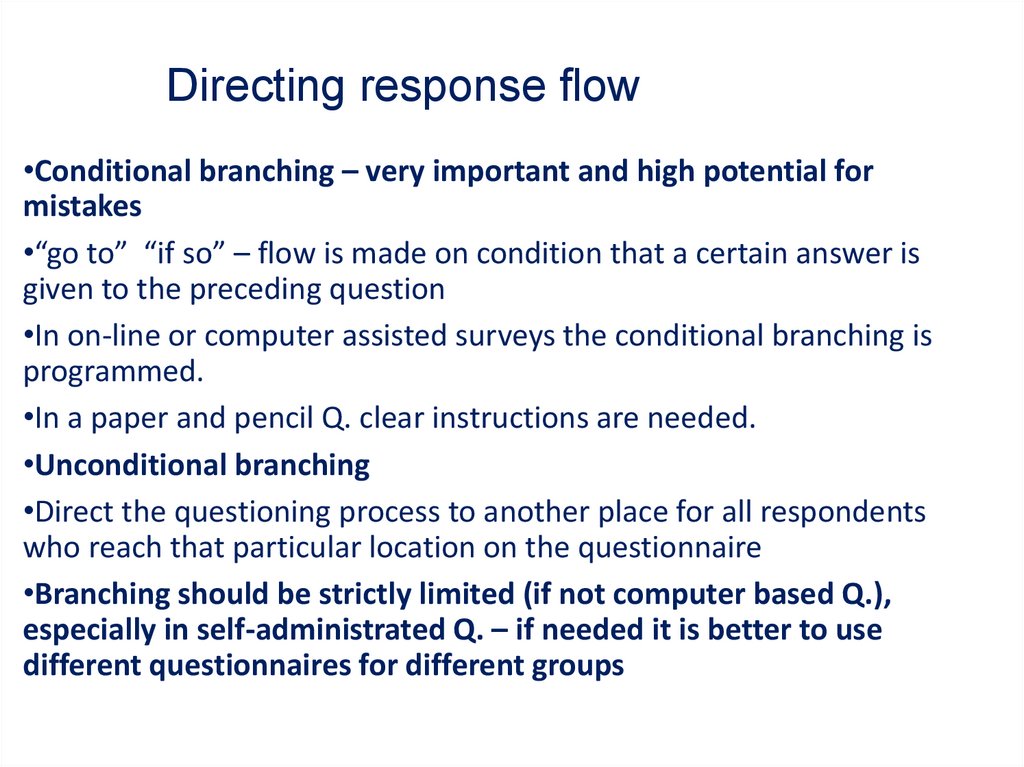
Directing response flow•Conditional branching – very important and high potential for
mistakes
•“go to” “if so” – flow is made on condition that a certain answer is
given to the preceding question
•In on-line or computer assisted surveys the conditional branching is
programmed.
•In a paper and pencil Q. clear instructions are needed.
•Unconditional branching
•Direct the questioning process to another place for all respondents
who reach that particular location on the questionnaire
•Branching should be strictly limited (if not computer based Q.),
especially in self-administrated Q. – if needed it is better to use
photo
different questionnaires for different groups
Higher School of Economics , Moscow, 2011
66.
Precoding and pretesting of the Questionnaire•Do not begin listing the format until the entire Q. draft is
complete
•Use listing within sections rather than within the whole Q.
•Codes for DK and refuse
•Pretesting should be always used!!!!
photo
Higher School of Economics , Moscow, 2011
67.
Instructions•Instructions to respondents – if self-administrated questionnaires
how to indicate their answers in the Q
how to use scales
how many number of answers are possible in check lists
•Instructions to interviewers
not shown to the respondents
explanations on the format of the Q. – for example – do not ask or
not read for options “do not know” or “refuse to answer”
branching instructions
using cards
photo
Higher School of Economics , Moscow, 2011
68.
Sensitive or threatening questions•Income and financial matters in general
•Mental or technical skills and abilities
•Inability to perceive personally or socially desirable goals
•Low level social status indications (education, jobs,
neighborhoods)
•Sexuality and sexual identity
•Consumption of alcohol or drugs
•Inability to form or to break personal habits
•Emotional or psychological disturbance
•Aging
photo
•Death or dying
Higher School of Economics , Moscow, 2011