
 finance
Similar presentations:


")


CAP and ROC curves
1.
CAP and ROC curves2.
Cumulative Accuracy Profiles (CAP)• We first rank companies by their default
probabilities (i.e., credit scores) as predicted by
the model, from highest to lowest.
• Then, out of those companies with a score
higher than a value such that altogether they
represent x% of the total number of companies,
we record the corresponding number of
defaulted companies being captured as a
percentage (y%) of total number of defaulted
companies.
3.
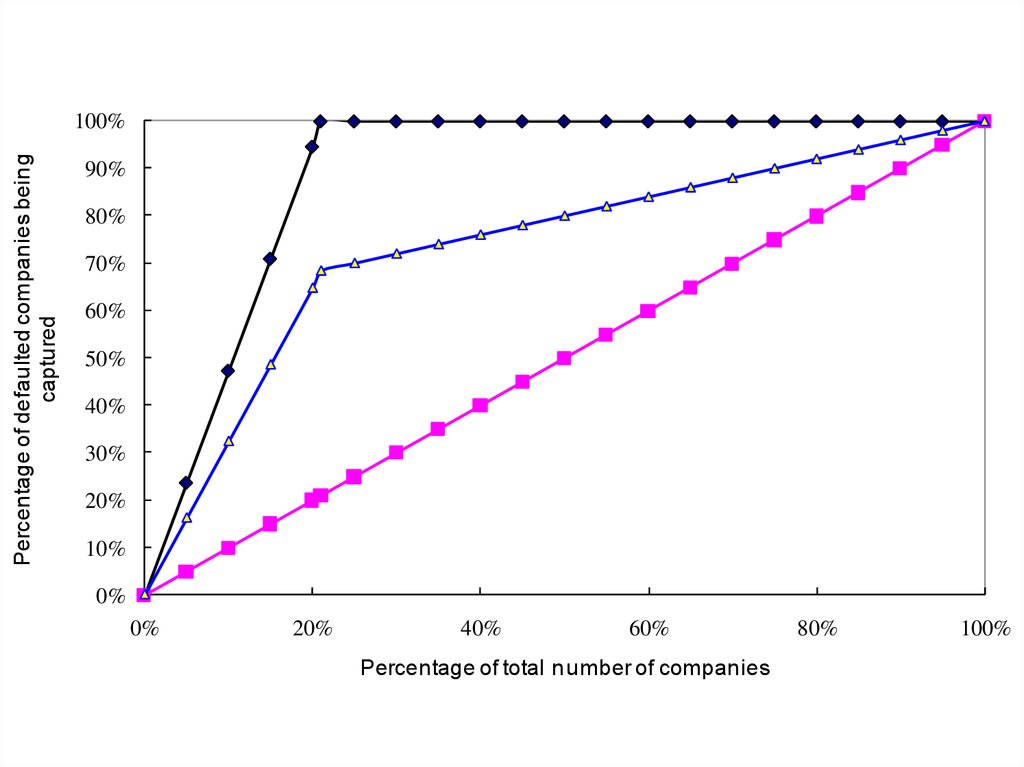
CAP• The CAP curve can then be traced out by
varying x from 0 to 100 and plotting the
corresponding values of x and y along and xaxis and y-axis respectively.
• Using a good model will result in a majority of
the defaulters having relatively high default
probability estimates and so the percentage of
defaulters being captured (the y values in Fig. 1)
increases quickly as one moves down the sorted
sample of all companies (the x values in Fig. 1).
4.
CAP• If the model were totally uninformative, for
example, by assigning default probabilities
randomly, we would expect to capture a
proportional fraction (i.e., x% of the
defaulters with about x% of the
observations), resulting in a CAP curve
along the 45-degree line (i.e., the
“Random CAP” curve of Fig. 1).
5.
Percentage of defaulted companies beingcaptured
100%
90%
80%
70%
60%
50%
40%
30%
20%
10%
0%
0%
20%
40%
60%
Percentage of total number of companies
80%
100%
6.
CAP• Accuracy ratio by CAP curve= (the area
under a model’s CAP)/ (the area under the
ideal CAP)
7.
Operating Characteristic Curves(ROC)
• The ROC curve is constructed by varying the
cutoff probability.
• In particular, for every cutoff probability, the ROC
curve defines the “true positive rate” (percentage
of defaults that the model correctly classifies as
defaults) on the y-axis as a function of the
corresponding “false positive rate” (percentage
of non-defaults that are mistakenly classified as
defaults) on the x-axis.
8.
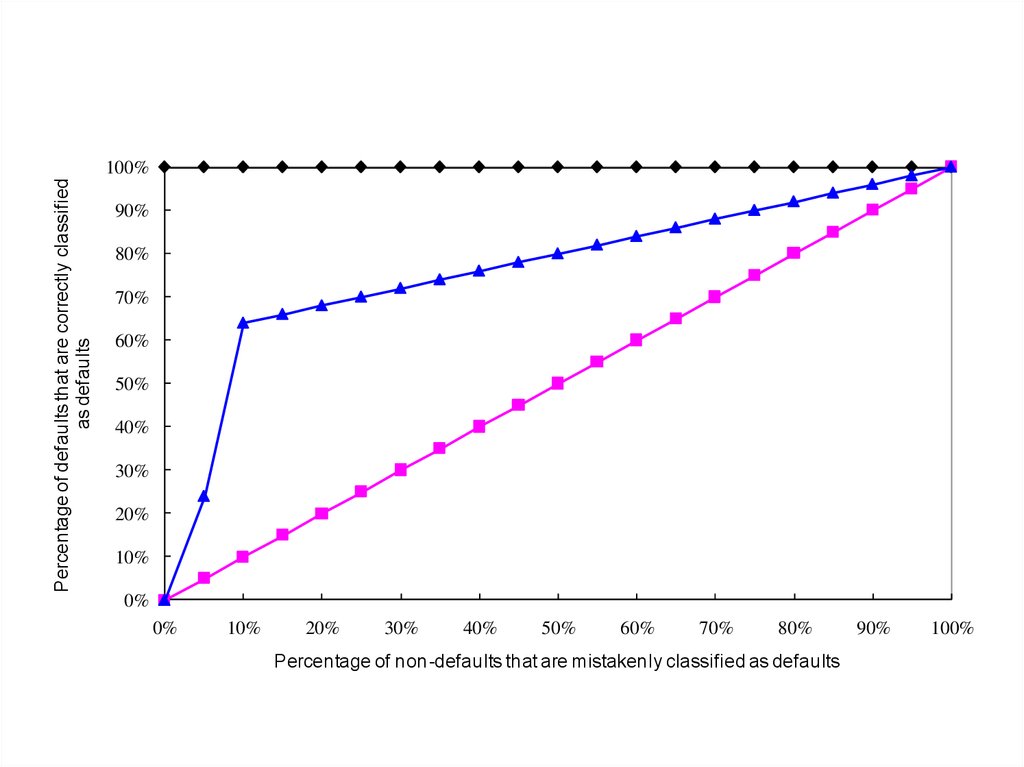
• The ROC curve of a constant or entirelyrandom prediction model corresponds to
the 45-degree line, whereas a perfect
model will have a ROC curve that goes
straight up from (0, 0) to (0, 1) and then
across to (1, 1).
9.
Percentage of defaults that are correctly classifiedas defaults
100%
90%
80%
70%
60%
50%
40%
30%
20%
10%
0%
0%
10%
20%
30%
40%
50%
60%
70%
80%
Percentage of non-defaults that are mistakenly classified as defaults
90%
100%
10.
ROC• Accuracy ratio by ROC curve=2× (area
under a model’s ROC curve-0.5)