
 software
Similar presentations:


 & MDOS Onboarding Training Global Partner Onboarding Team")


")


Microsoft. Fundamental analysis of a company
1.
MICROSOFTFUNDAMENTAL ANALYSIS OF A COMPANY
2.
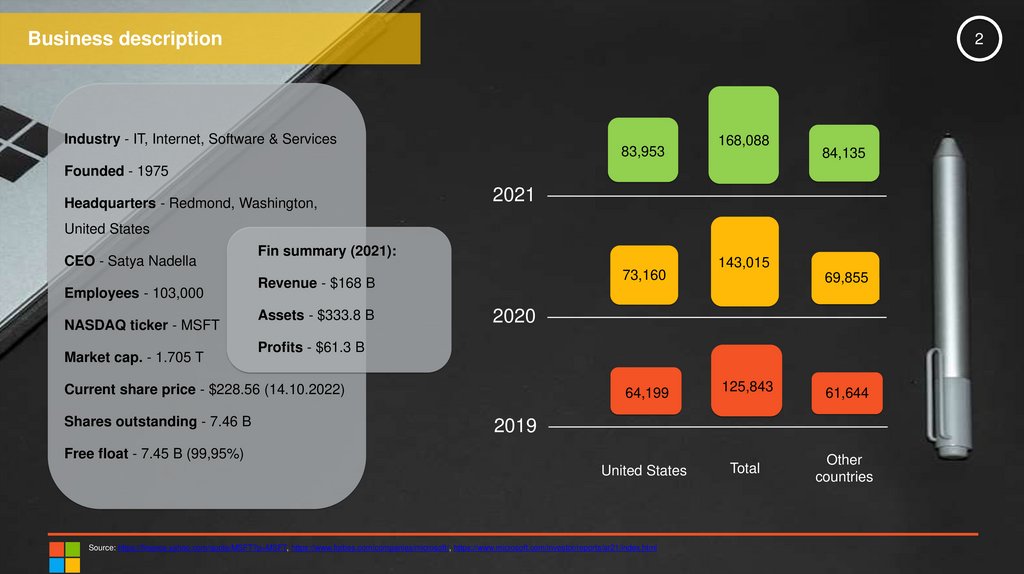
Business description2
Industry - IT, Internet, Software & Services
83,953
168,088
84,135
Founded - 1975
Headquarters - Redmond, Washington,
2021
United States
CEO - Satya Nadella
Employees - 103,000
NASDAQ ticker - MSFT
Market cap. - 1.705 T
Fin summary (2021):
73,160
Revenue - $168 B
Assets - $333.8 B
69,855
2020
Profits - $61.3 B
Current share price - $228.56 (14.10.2022)
Shares outstanding - 7.46 B
143,015
64,199
125,843
61,644
Total
Other
countries
2019
Free float - 7.45 B (99,95%)
United States
Source: https://finance.yahoo.com/quote/MSFT?p=MSFT, https://www.forbes.com/companies/microsoft/, https://www.microsoft.com/investor/reports/ar21/index.html
3.
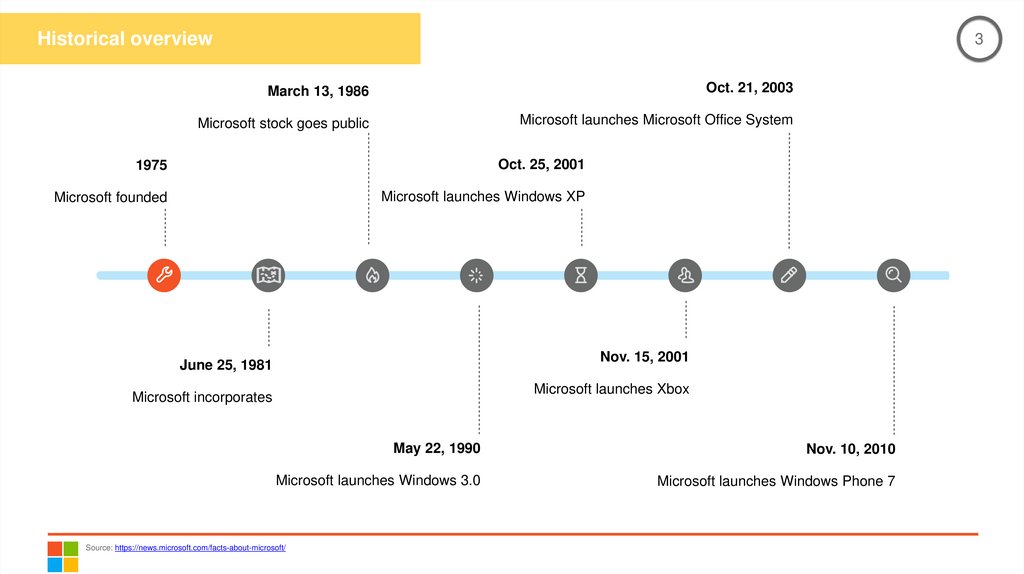
Historical overview3
March 13, 1986
Oct. 21, 2003
Microsoft stock goes public
Microsoft launches Microsoft Office System
1975
Oct. 25, 2001
Microsoft founded
Microsoft launches Windows XP
Nov. 15, 2001
June 25, 1981
Microsoft launches Xbox
Microsoft incorporates
May 22, 1990
Nov. 10, 2010
Microsoft launches Windows 3.0
Microsoft launches Windows Phone 7
Source: https://news.microsoft.com/facts-about-microsoft/
4.
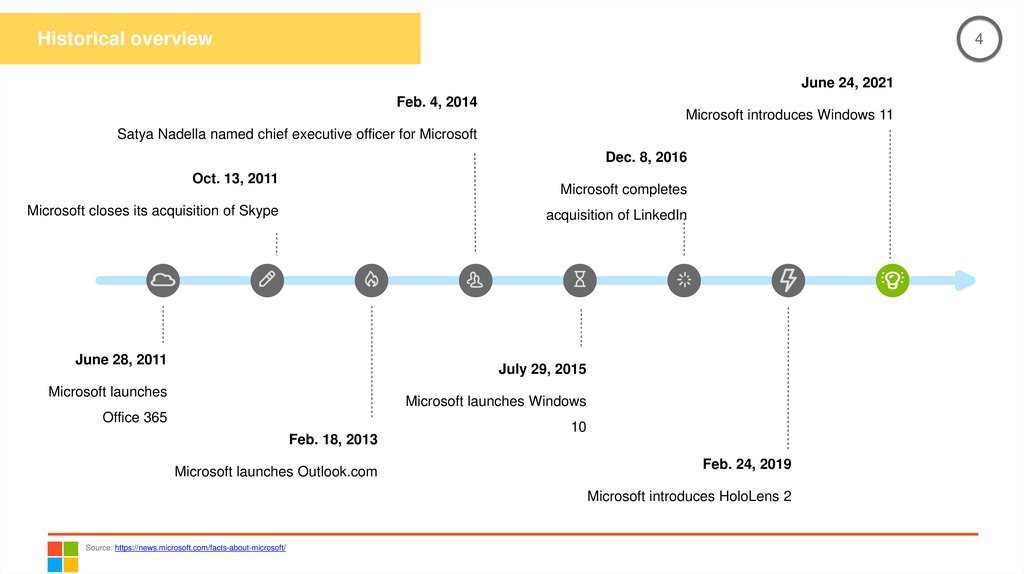
Historical overview4
June 24, 2021
Feb. 4, 2014
Microsoft introduces Windows 11
Satya Nadella named chief executive officer for Microsoft
Dec. 8, 2016
Oct. 13, 2011
Microsoft completes
Microsoft closes its acquisition of Skype
acquisition of LinkedIn
June 28, 2011
July 29, 2015
Microsoft launches
Microsoft launches Windows
Office 365
Feb. 18, 2013
Microsoft launches Outlook.com
10
Feb. 24, 2019
Microsoft introduces HoloLens 2
Source: https://news.microsoft.com/facts-about-microsoft/
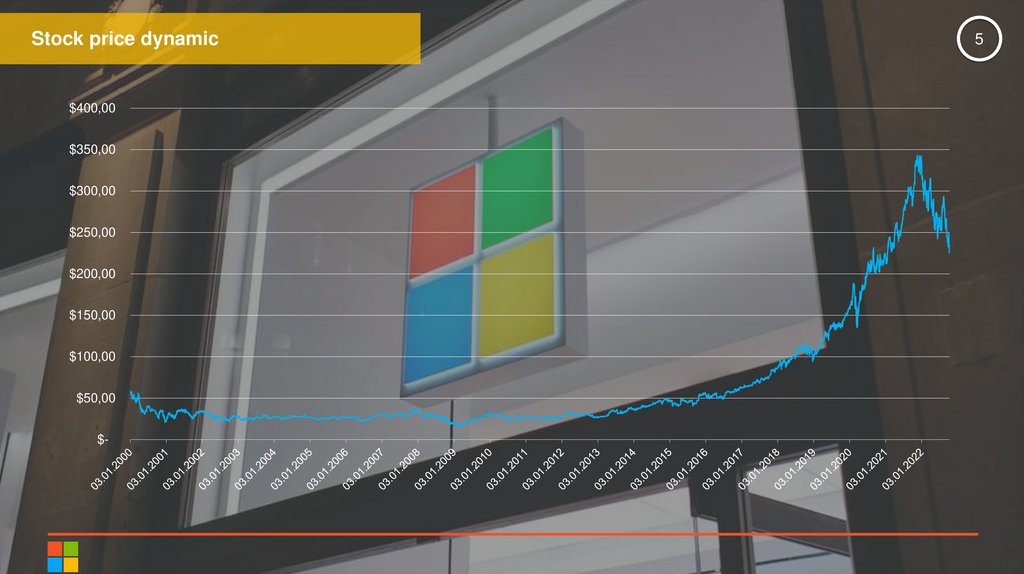
5.
Stock price dynamic$400,00
$350,00
$300,00
$250,00
$200,00
$150,00
$100,00
$50,00
$-
5
6.
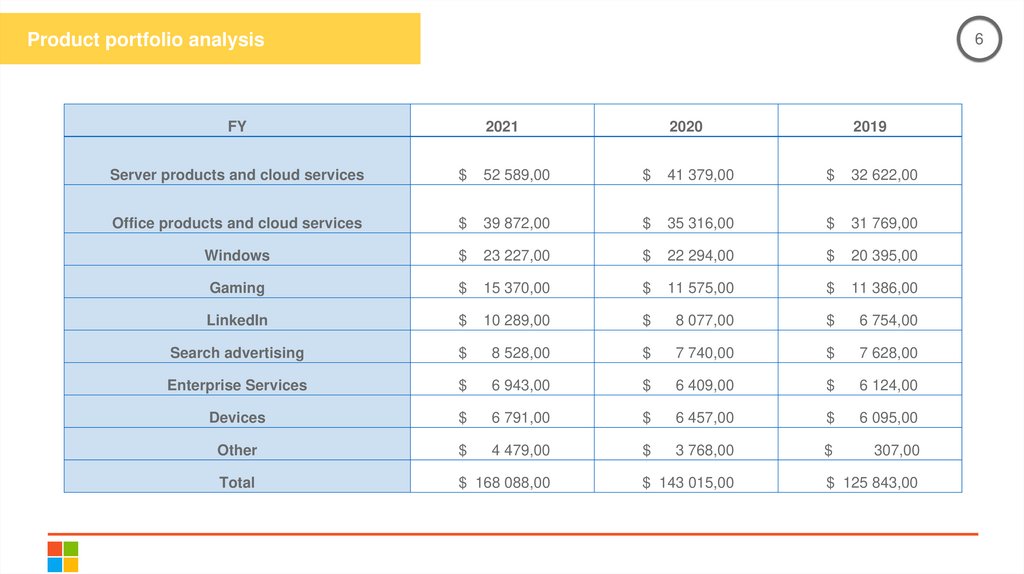
Product portfolio analysis6
FY
2021
2020
2019
Server products and cloud services
$
52 589,00
$
41 379,00
$
32 622,00
Office products and cloud services
$
39 872,00
$
35 316,00
$
31 769,00
Windows
$
23 227,00
$
22 294,00
$
20 395,00
Gaming
$
15 370,00
$
11 575,00
$
11 386,00
$
10 289,00
$
8 077,00
$
6 754,00
Search advertising
$
8 528,00
$
7 740,00
$
7 628,00
Enterprise Services
$
6 943,00
$
6 409,00
$
6 124,00
Devices
$
6 791,00
$
6 457,00
$
6 095,00
Other
$
4 479,00
$
3 768,00
$
307,00
Total
$ 168 088,00
$ 143 015,00
$ 125 843,00
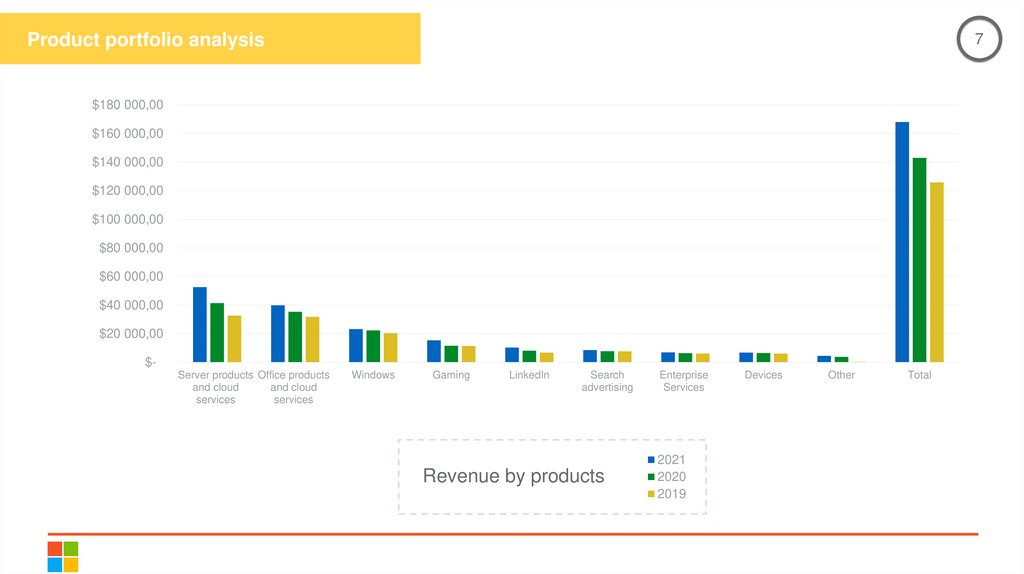
7.
Product portfolio analysis7
$180 000,00
$160 000,00
$140 000,00
$120 000,00
$100 000,00
$80 000,00
$60 000,00
$40 000,00
$20 000,00
$Server products Office products
and cloud
and cloud
services
services
Windows
Gaming
Search
advertising
Revenue by products
Enterprise
Services
2021
2020
2019
Devices
Other
Total
8.
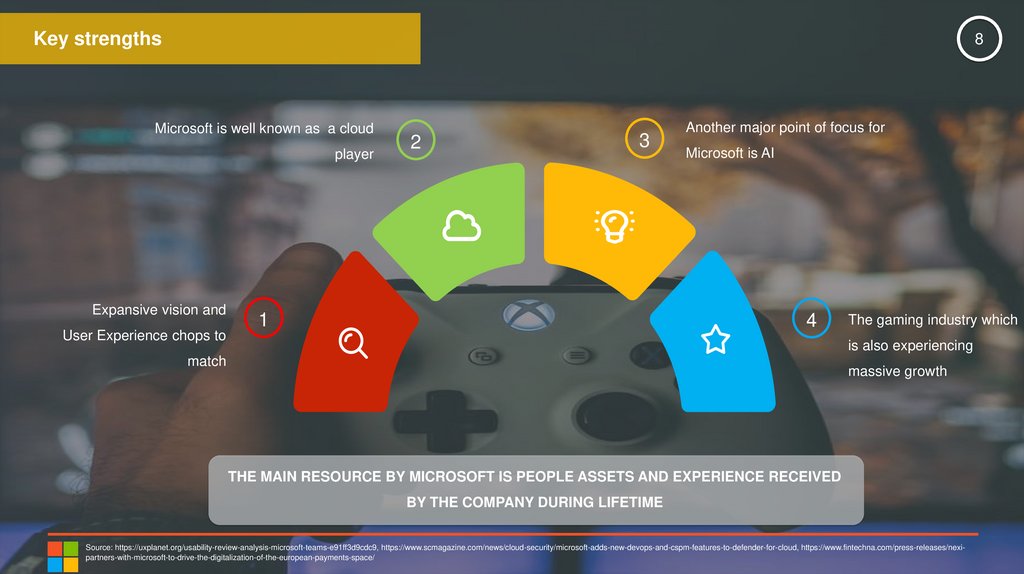
Key strengths8
Microsoft is well known as a cloud
player
Expansive vision and
User Experience chops to
2
3
1
Another major point of focus for
Microsoft is AI
4
The gaming industry which
is also experiencing
match
massive growth
THE MAIN RESOURCE BY MICROSOFT IS PEOPLE ASSETS AND EXPERIENCE RECEIVED
BY THE COMPANY DURING LIFETIME
Source: https://uxplanet.org/usability-review-analysis-microsoft-teams-e91ff3d9cdc9, https://www.scmagazine.com/news/cloud-security/microsoft-adds-new-devops-and-cspm-features-to-defender-for-cloud, https://www.fintechna.com/press-releases/nexipartners-with-microsoft-to-drive-the-digitalization-of-the-european-payments-space/
9.
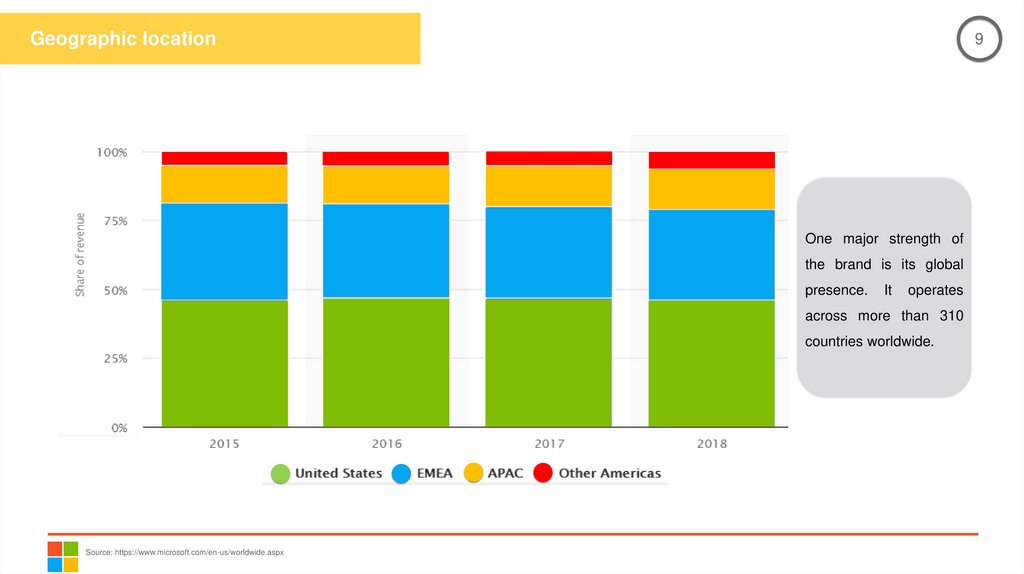
Geographic location9
One major strength of
the brand is its global
presence.
It
operates
across more than 310
countries worldwide.
Source: https://www.microsoft.com/en-us/worldwide.aspx
10.
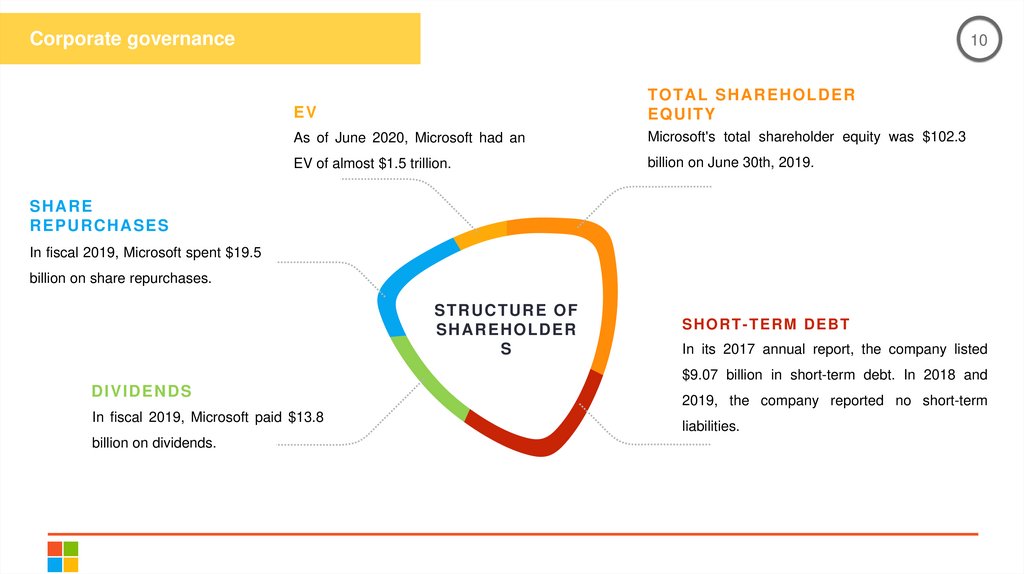
Corporate governance10
EV
TOTA L SH A R EHOLD ER
EQU ITY
As of June 2020, Microsoft had an
Microsoft's total shareholder equity was $102.3
EV of almost $1.5 trillion.
billion on June 30th, 2019.
SH A R E
R EPU R CHASES
In fiscal 2019, Microsoft spent $19.5
billion on share repurchases.
STR U C TURE OF
SH A R EHOLD ER
S
SHORT-TERM DEBT
In its 2017 annual report, the company listed
$9.07 billion in short-term debt. In 2018 and
D IVID EN D S
In fiscal 2019, Microsoft paid $13.8
billion on dividends.
2019, the company reported no short-term
liabilities.
11.
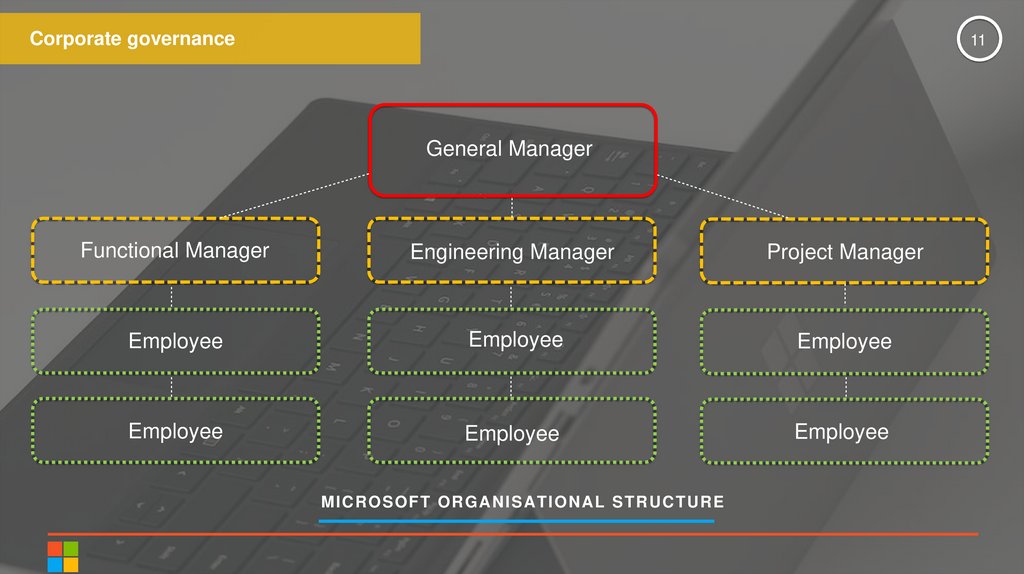
Corporate governance11
General Manager
Functional Manager
Engineering Manager
Project Manager
Employee
Employee
Employee
Employee
Employee
Employee
MICROSOFT ORGANISATION A L STR U C TURE
12.
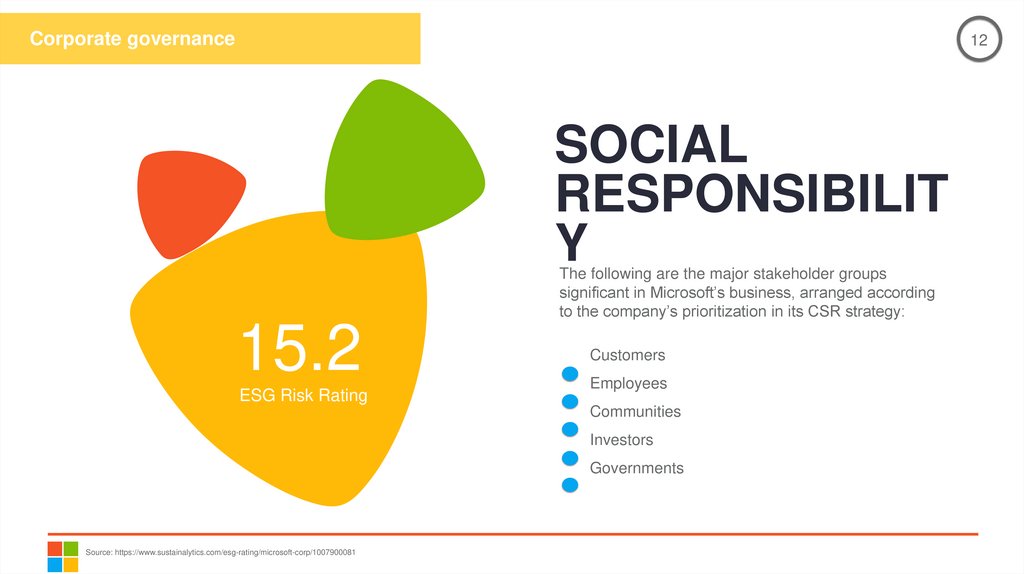
Corporate governance12
SOCIAL
RESPONSIBILIT
Y
The following are the major stakeholder groups
significant in Microsoft’s business, arranged according
to the company’s prioritization in its CSR strategy:
15.2
ESG Risk Rating
Customers
Employees
Communities
Investors
Governments
Source: https://www.sustainalytics.com/esg-rating/microsoft-corp/1007900081
13.
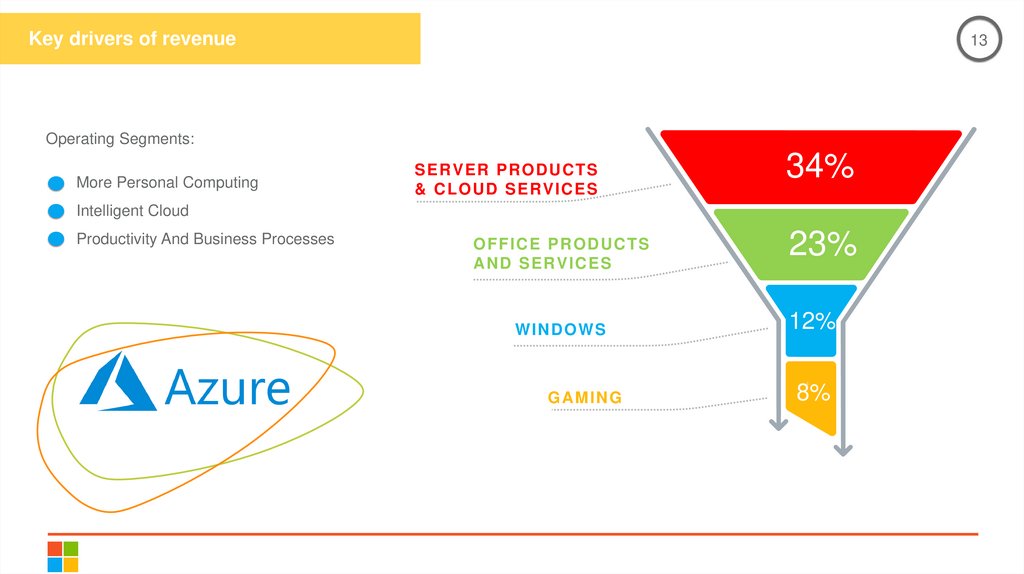
Key drivers of revenue13
Operating Segments:
More Personal Computing
SER VER PR OD U C TS
& C LOU D SER VIC ES
34%
Intelligent Cloud
Productivity And Business Processes
OFFIC E PR OD U C TS
A N D SER VIC ES
WIN D OWS
23%
12%
4
GA MIN G
8%
14.
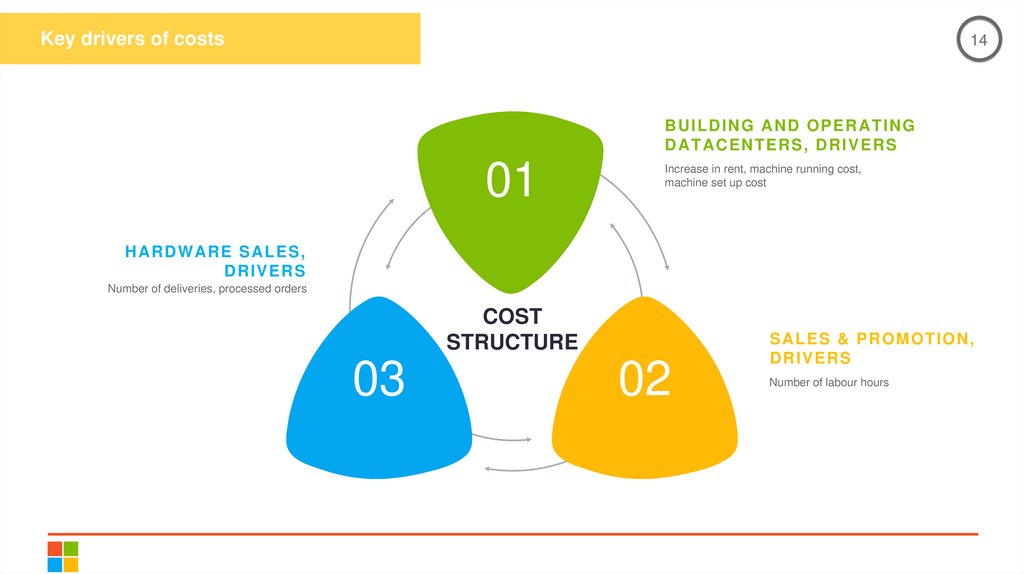
Key drivers of costs14
B U ILD IN G A N D OPER A TIN G
D A TA C ENTERS, D R IVER S
01
Increase in rent, machine running cost,
machine set up cost
H A R DWA RE SA LES,
D R IVER S
Number of deliveries, processed orders
COST
STRUCTURE
03
02
SA LES & PR OMOTION ,
D R IVER S
Number of labour hours
15.
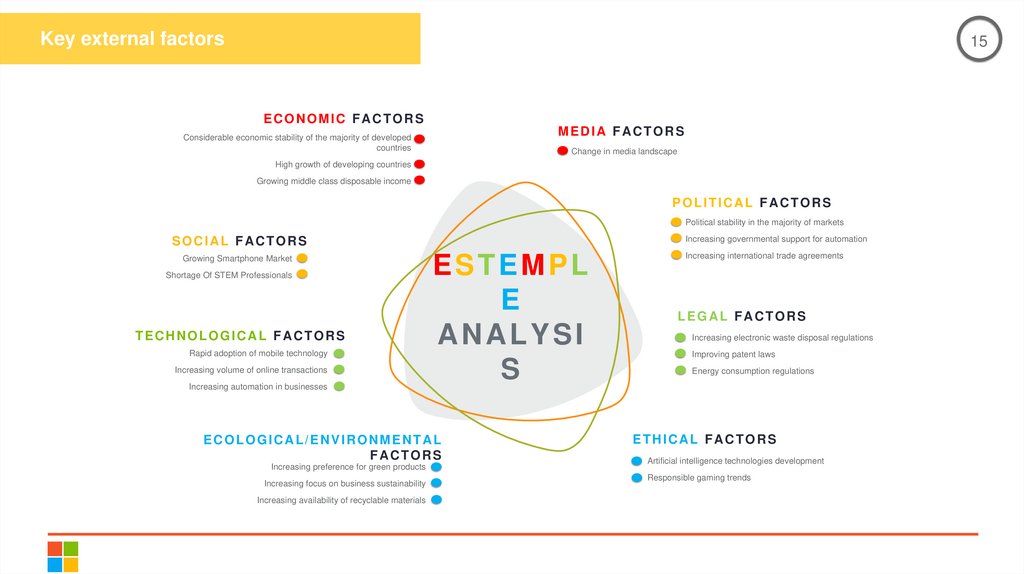
Key external factors15
ECONOMIC FACTORS
MEDIA FACTORS
Considerable economic stability of the majority of developed
countries
Change in media landscape
High growth of developing countries
Growing middle class disposable income
POLITICAL FACTORS
Political stability in the majority of markets
Increasing governmental support for automation
SOCIAL FACTORS
Growing Smartphone Market
Shortage Of STEM Professionals
TECHNOLOGICAL FACTORS
Rapid adoption of mobile technology
Increasing volume of online transactions
Increasing automation in businesses
ESTEMPL
E
ANALYSI
S
ECOLOGICAL/ENVIRONMENTAL
FACTORS
Increasing preference for green products
Increasing focus on business sustainability
Increasing availability of recyclable materials
Increasing international trade agreements
LEGAL FACTORS
Increasing electronic waste disposal regulations
Improving patent laws
Energy consumption regulations
ETHICAL FACTORS
Artificial intelligence technologies development
Responsible gaming trends
16.
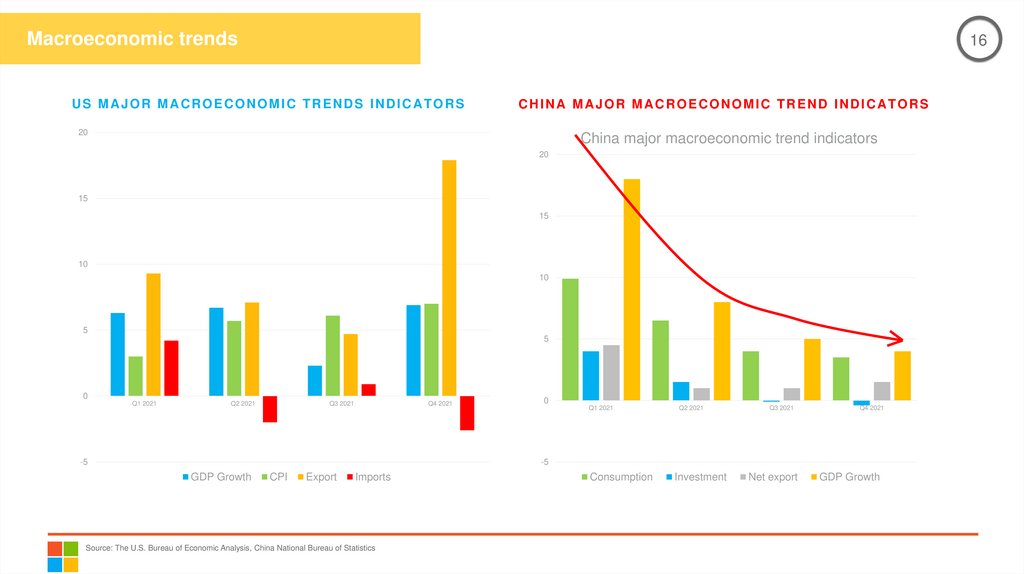
Macroeconomic trends16
US MAJOR MACROECONOMIC TRENDS INDICATORS
CHINA MAJOR MACROECONOMIC TREND INDICATORS
20
China major macroeconomic trend indicators
20
15
15
10
10
5
5
0
Q1 2021
Q2 2021
Q3 2021
Q4 2021
-5
0
Q1 2021
Q2 2021
Q3 2021
Q4 2021
Net export
GDP Growth
-5
GDP Growth
CPI
Export
Imports
Source: The U.S. Bureau of Economic Analysis, China National Bureau of Statistics
Consumption
Investment
17.
Company Strategy analysis17
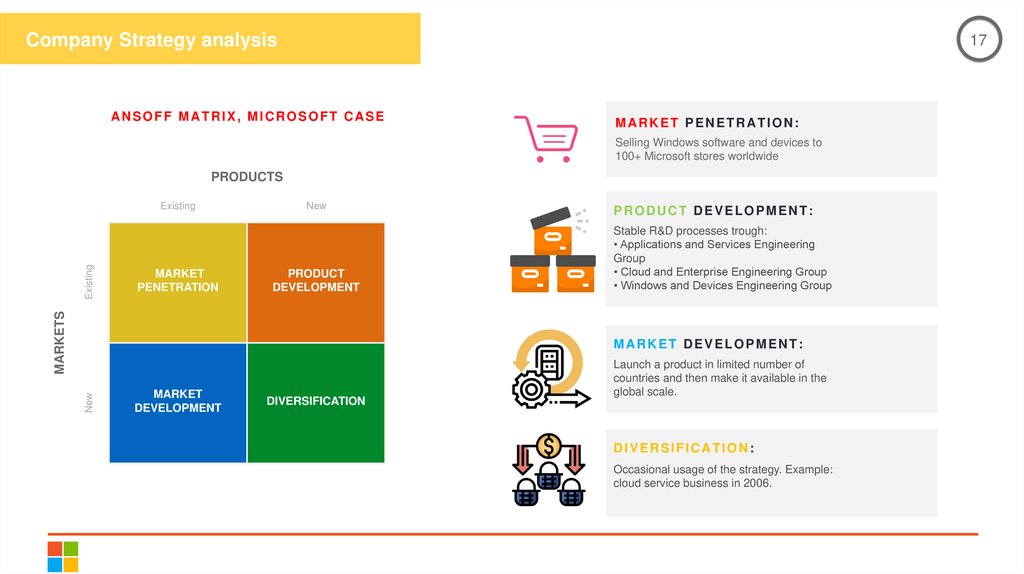
ANSOFF MATRIX, MICROSOFT CASE
MARKET PENETRATION:
Selling Windows software and devices to
100+ Microsoft stores worldwide
PRODUCTS
MARKET
PENETRATION
New
PRODUCT
DEVELOPMENT
MARKETS
Existing
Existing
PRODUCT DEVELOPMENT:
Stable R&D processes trough:
• Applications and Services Engineering
Group
• Cloud and Enterprise Engineering Group
• Windows and Devices Engineering Group
New
MARKET DEVELOPMENT:
MARKET
DEVELOPMENT
DIVERSIFICATION
Launch a product in limited number of
countries and then make it available in the
global scale.
DIVERSIFICATION:
Occasional usage of the strategy. Example:
cloud service business in 2006.