

 physics
 astronomy
Similar presentations:


Detection of streaks of faint space objects
1.
Detection of streaks offaint space objects
Nikita Berenkov
Moscow Institute of Physics and Technology
Space Informatics Laboratory
6th International conference Engineering & Telecommunication
En&T-2019, MIPT, November 20-21, 2019
2.
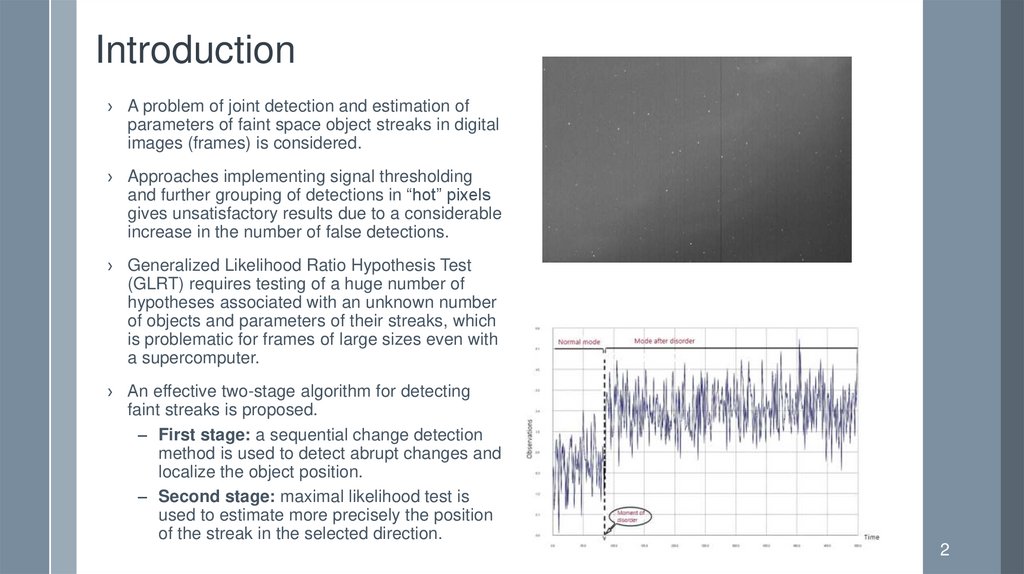
Introduction› A problem of joint detection and estimation of
parameters of faint space object streaks in digital
images (frames) is considered.
› Approaches implementing signal thresholding
and further grouping of detections in “hot” pixels
gives unsatisfactory results due to a considerable
increase in the number of false detections.
› Generalized Likelihood Ratio Hypothesis Test
(GLRT) requires testing of a huge number of
hypotheses associated with an unknown number
of objects and parameters of their streaks, which
is problematic for frames of large sizes even with
a supercomputer.
› Аn effective two-stage algorithm for detecting
faint streaks is proposed.
– First stage: a sequential change detection
method is used to detect abrupt changes and
localize the object position.
– Second stage: maximal likelihood test is
used to estimate more precisely the position
of the streak in the selected direction.
2
3.
Background clutterwill be suppressed
after preprocessing.
Discuss it later.
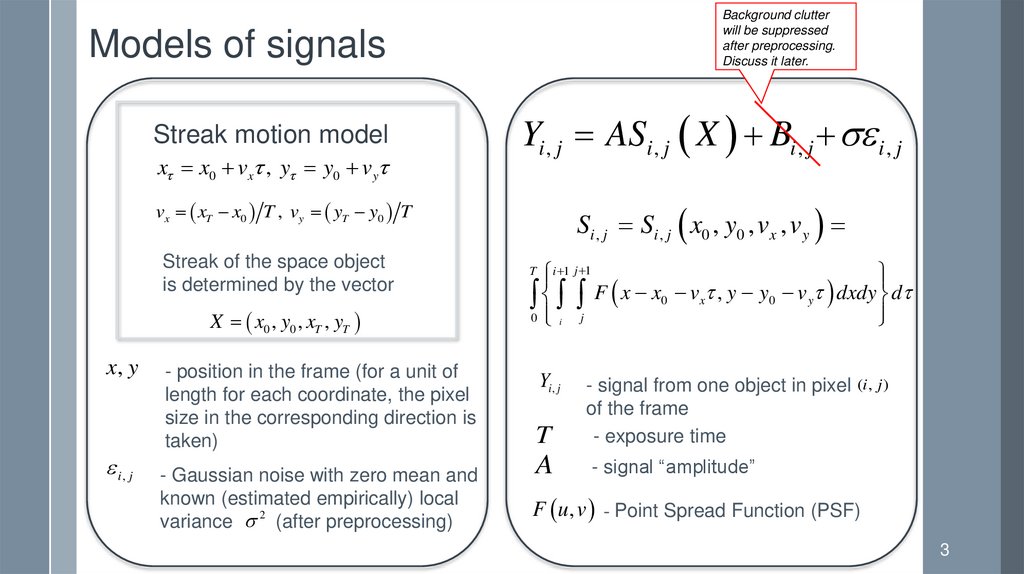
Models of signals
Streak motion model
x x0 vx , y y0 v y
Yi , j ASi , j X Bi , j i , j
vx xT x0 T , vy yT y0 T
Streak of the space object
is determined by the vector
X x0 , y0 , xT , yT
x, y
i, j
- position in the frame (for a unit of
length for each coordinate, the pixel
size in the corresponding direction is
taken)
- Gaussian noise with zero mean and
known (estimated empirically) local
variance 2 (after preprocessing)
Si , j Si , j x0 , y0 , vx , v y
i 1 j 1
F
x
x
v
,
y
y
v
dxdy
d
0
x
0
y
0 j
i
T
Yi , j
T
- signal from one object in pixel (i , j )
of the frame
- exposure time
A
- signal “amplitude”
F u , v - Point Spread Function (PSF)
3
4.
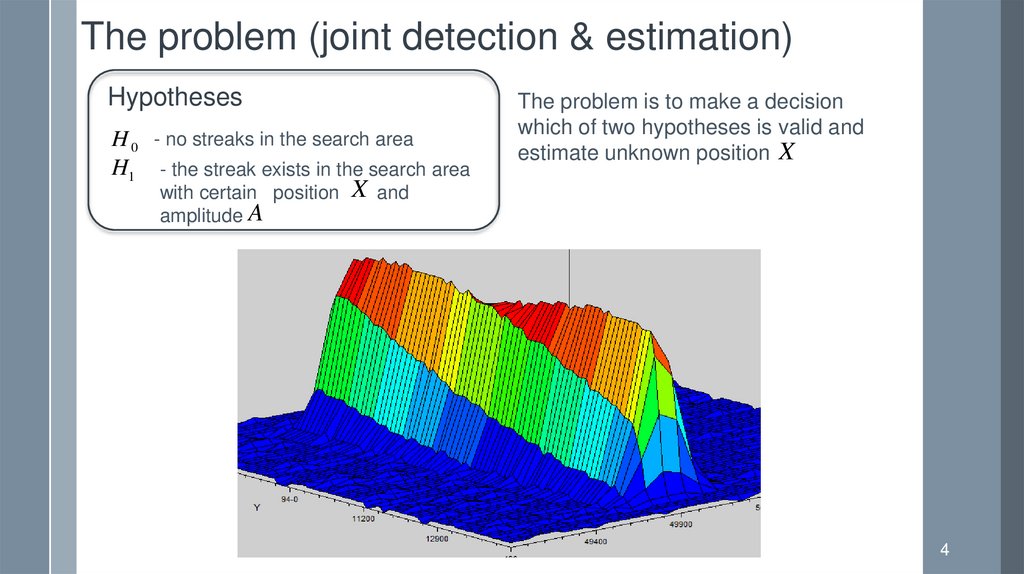
The problem (joint detection & estimation)Hypotheses
H 0 - no streaks in the search area
H1 - the streak exists in the search area
The problem is to make a decision
which of two hypotheses is valid and
estimate unknown position X
with certain position X and
amplitude A
4
5.
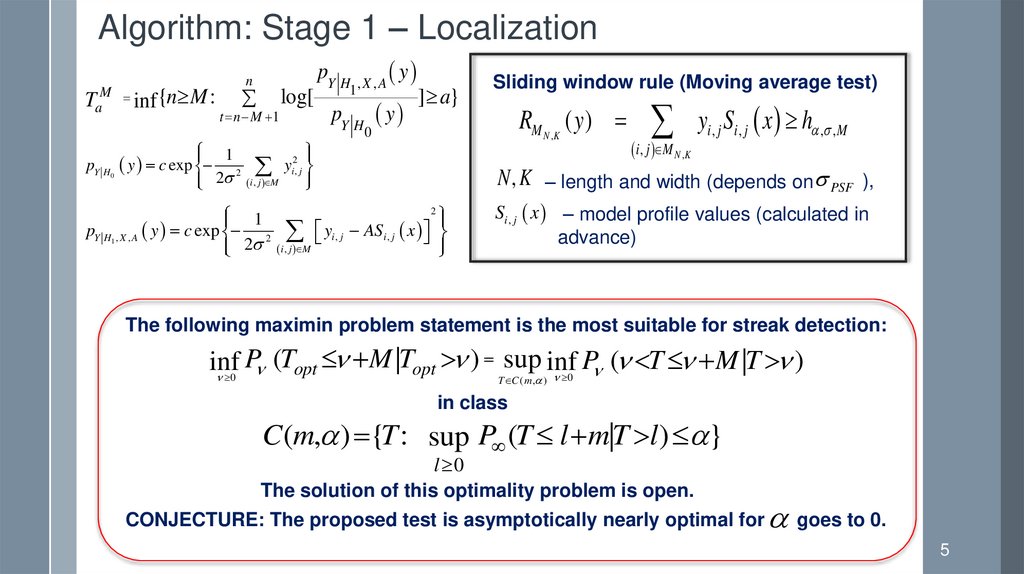
Algorithm: Stage 1 – LocalizationTaM inf {n M :
n
t n M 1
log[
pY H , X , A y
1
pY H y
] a}
Sliding window rule (Moving average test)
RM N ,K ( y )
0
1
pY H 0 y c exp 2 yi2, j
2 i , j M
y S x h
i , j M N ,K
i, j i, j
, , M
N , K – length and width (depends on PSF ),
2
1
pY H1 , X , A y c exp 2 yi , j ASi , j x
2 i , j M
Si , j x – model profile values (calculated in
advance)
The following maximin problem statement is the most suitable for streak detection:
sup inf P ( T M |T )
P
(
T
M
|
T
)
inf
opt
opt
0
T C ( m , )
0
in class
C(m, ) {T : sup P (T l mT
| l ) }
l 0
The solution of this optimality problem is open.
CONJECTURE: The proposed test is asymptotically nearly optimal for goes to 0.
5
6.
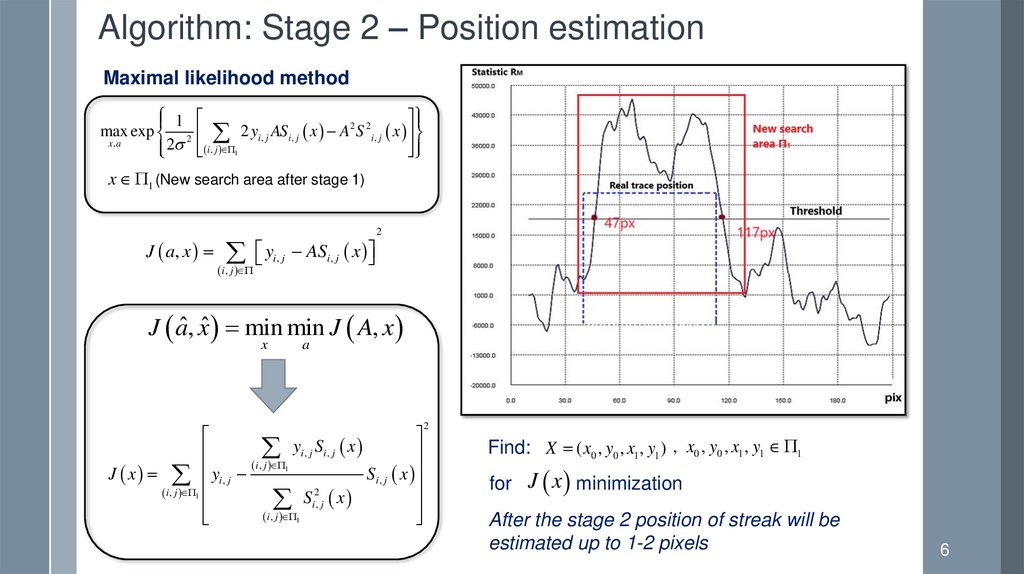
Algorithm: Stage 2 – Position estimationMaximal likelihood method
1
2 2
max exp 2 2 yi , j ASi , j x A S i , j x
x ,a
2 i , j 1
x 1 (New search area after stage 1)
J a, x yi , j ASi , j x
2
i , j
J aˆ, xˆ min min J A, x
x
a
y
S
x
i, j i, j
i , j 1
J x yi , j
Si , j x
2
i , j 1
S
x
i, j
i , j 1
2
Find: X ( x0 , y0 , x1 , y1 ) , x0 , y0 , x1 , y1 1
for J x minimization
After the stage 2 position of streak will be
estimated up to 1-2 pixels
6
7.
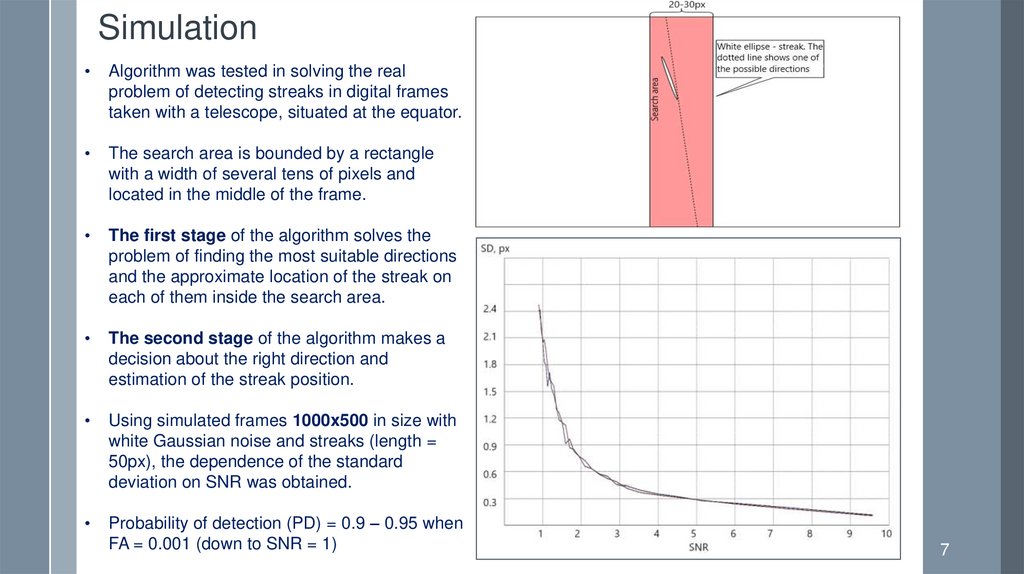
SimulationAlgorithm was tested in solving the real
problem of detecting streaks in digital frames
taken with a telescope, situated at the equator.
The search area is bounded by a rectangle
with a width of several tens of pixels and
located in the middle of the frame.
The first stage of the algorithm solves the
problem of finding the most suitable directions
and the approximate location of the streak on
each of them inside the search area.
The second stage of the algorithm makes a
decision about the right direction and
estimation of the streak position.
Using simulated frames 1000x500 in size with
white Gaussian noise and streaks (length =
50px), the dependence of the standard
deviation on SNR was obtained.
Probability of detection (PD) = 0.9 – 0.95 when
FA = 0.001 (down to SNR = 1)
7
8.
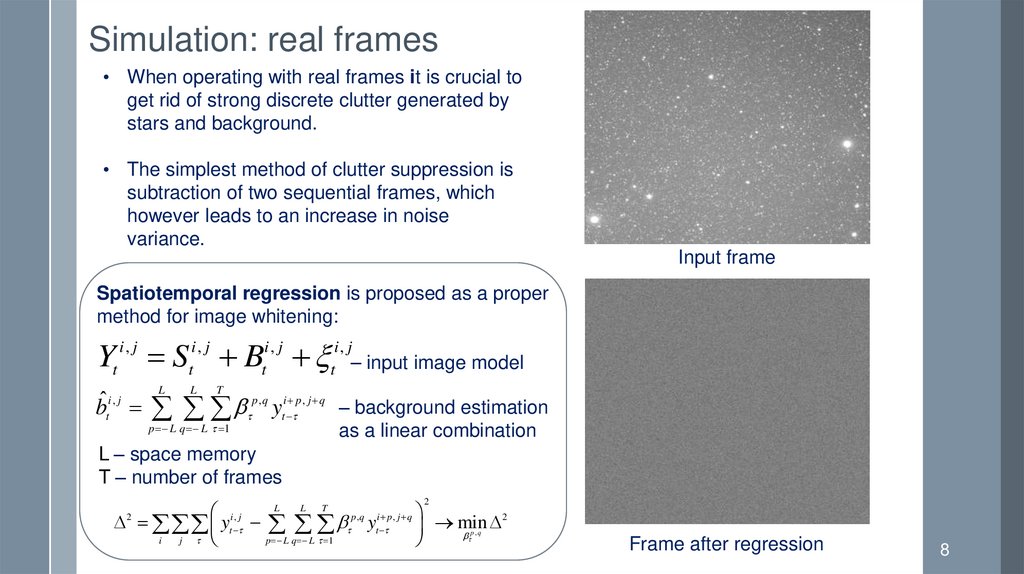
Simulation: real frames• When operating with real frames it is crucial to
get rid of strong discrete clutter generated by
stars and background.
• The simplest method of clutter suppression is
subtraction of two sequential frames, which
however leads to an increase in noise
variance.
Input frame
Spatiotemporal regression is proposed as a proper
method for image whitening:
Yt i , j Sti , j Bti , j ti , j– input image model
L
L
T
bˆti , j p ,q yti p , j q – background estimation
p L q L 1
as a linear combination
L – space memory
T – number of frames
2
L
L
T
i, j
yt p ,q yti p , j q min 2
i
j
p L q L 1
2
p ,q
Frame after regression
8
9.
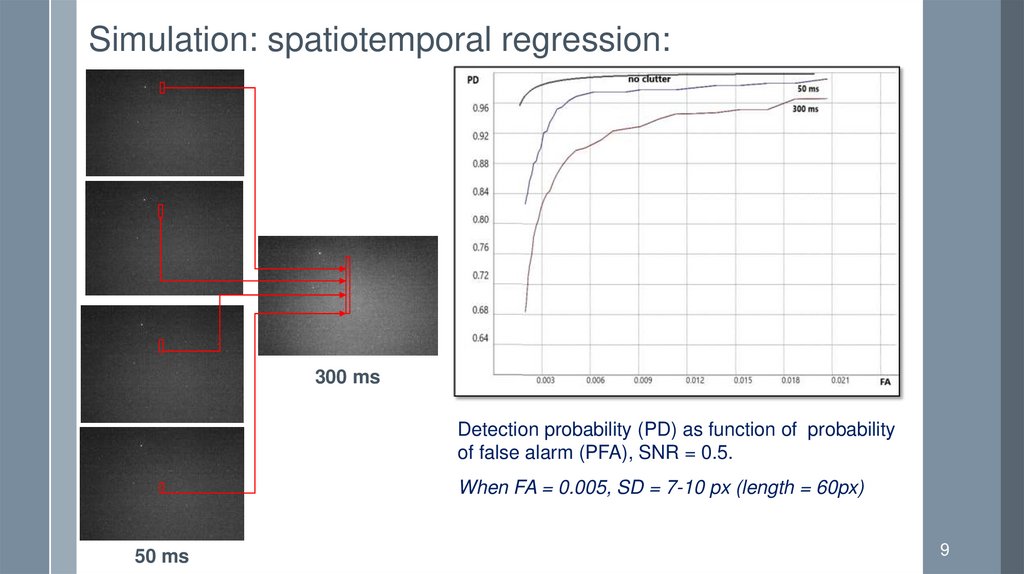
Simulation: spatiotemporal regression:300 ms
Detection probability (PD) as function of probability
of false alarm (PFA), SNR = 0.5.
When FA = 0.005, SD = 7-10 px (length = 60px)
50 ms
9
10.
Conclusion and future workWe proposed an effective two-stage algorithm which significantly reduces the
number of hypotheses that have to be tested and the time of processing
compared to the popular GLRT.
Testing showed that the algorithm is capable of detecting streaks of space
objects and accurately estimating their parameters with a signal-to-noise ratio
near 1 both on simulated frames and on real data.
The algorithm also showed good results in detection of faint streaks (down to
SNR = 0.5) on real frames after background clutter suppression using
spatiotemporal regression approach.
In the future, it is planned to test the algorithm using other clutter filtering
methods, as well as compare our trace detection approach with, for instance,
Radon transform.
10
11.
AcknowledgementsI am grateful to Alexey E. Kolessa and Alexander G. Tartakovsky for setting
the problem, useful discussions and support.
11
12.
Thank you!Questions?
12