

 biology
 geography
Similar presentations:


Study of the genetic structure of two ecomorphological groups of roach (rutilus rutilus) of the Kaniv reservoir
1.
Institute of Fisheries,National Academy of
Agrarian Sciences
of Ukraine
National University of
Life and Environmental
Sciences of Ukraine
UKRAINE
STUDY OF THE GENETIC STRUCTURE OF
TWO ECOMORPHOLOGICAL GROUPS OF
ROACH (RUTILUS RUTILUS)
OF THE KANIV RESERVOIR
ZALOILO Olga
(оzaloilo@yahoo.com)
BIELIKOVA Olena
(belikova.e.y.@gmail.com)
DIDENKO Alexander (al_didenko@yahoo.com)
BUZEVICH Igor
(busevitch@ukr.net)
ZALOILO Іgor
(zaloilo@yahoo.com)
~ 8th AQUATIC BIODIVERSITY INTERNATIONAL CONFERENCE ~
2022 - Sibiu/Transylvania/Romania/European Union
2.
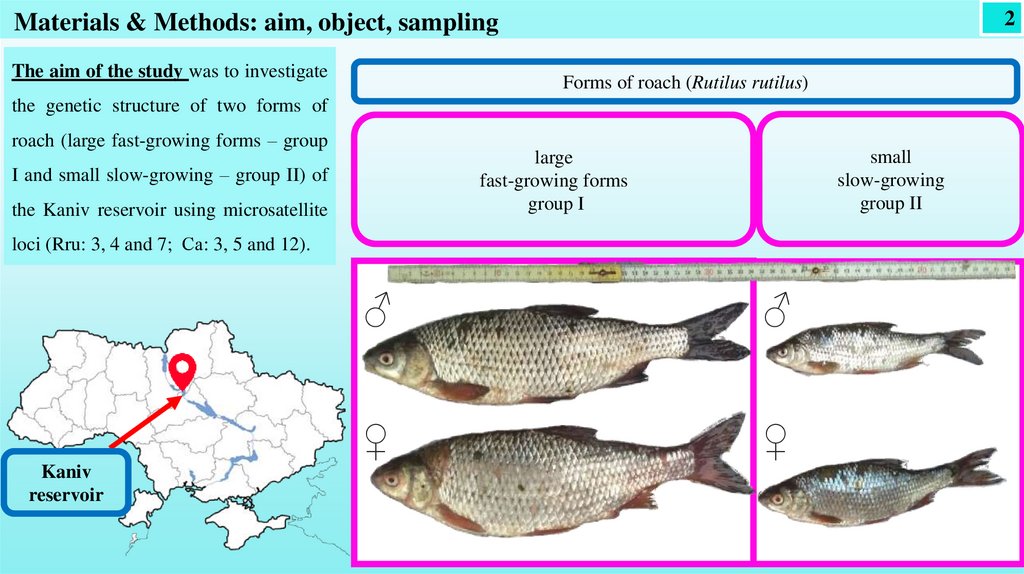
2Materials & Methods: aim, object, sampling
The aim of the study was to investigate
Forms of roach (Rutilus rutilus)
the genetic structure of two forms of
roach (large fast-growing forms – group
small
slow-growing
group II
large
fast-growing forms
group I
I and small slow-growing – group II) of
the Kaniv reservoir using microsatellite
loci (Rru: 3, 4 and 7; Са: 3, 5 and 12).
Kaniv
reservoir
♂
♂
♀
♀
3.
Materials & Methods: Microsatellite AnalysisLocus
Genbank
accession
number
Rru 3
AB112739
Rru 4
AB112740
Rru 7
AB112741
Са 3
AF277575
Са 5
AF277577
Са 7
AF277579
Са 12
AF277584
MFW 6
-
MFW 15
-
MFW 23
-
MFW 31
-
Hmo 02
AM086449
Hmo 27
AM086456
Hmo 33
AM086458
Marker sequence (5’→3’)
F: GGGGAGTCTGGCTTCAGG
R: CGGCACACAGGGAGGTTA
F: TAAGCAGTGACCAGAATCCA
R: CAAAGCCTCAAAAGCACAA
F: GTCTCCACAAAAATAGCGAACC
R: CGATTGATGCCGTCAGAA
F:GGACAGTGAGGGACGCAGAC
R:TCTAGCCCCCAAATTTTACGG
F:TTGAGTGGATGGTGCTTGTA
R:GCATTGCCAAAAGTTACCTAA
F:ACACGGGCTCAGAGCTAGTC
R:CAAATGTCAGGAGTTCTCCGA
F:GTGAAGCATGGCATAGCACA
R:CAGGAAAGTGCCAGCATACAC
F*: АCСТGАTСААTCССTGGСТС
R**:ТТGGGАСТТTTАААTCАCGTТG
F: CTCCTGTTTТGТTTTGTGААА
R: GTTCACAAGGTCATTTCCAGC
F:GТАТААТТGGGАGТТТТАGGG
R:САGGТТТАТСТСССТТСТАG
F:CCTTCCTCTGGCCATTCTCAC
R:TACATCGCAGAGAATTCGTAAG
F: CATCTGTTCTGAGGGGCTGAG
R: CCCCACTTTACCACCAATTATTAT
F: CTGTAATTCCGTTTTATCTGTGT
R: ATTGCTGTAAACCATAAAATGTAA
F: GTGCAGCAGTATGTGAATCAGGACAC
R: GTGCTTCGGGATACCACACTCTTG
3
PCR conditions
D
90° C
30 s
92 °C
1 min
АТ
55°C
30 s
55°C*
30 s
55°C
30 s
57°C*
1 min
57°C*
1 min
59°C
1 min
57°C*
1 min
Reference
E
C
72 °C
30 s
33
72 °C
1.5
min
27
95°C
30 s
55 °C
45 s
72 °C
1 min
35
94° C
50 s
60°C
50 s
60°C
50 s
59°C
50 s
72 °C
50 s
28
[Barinova,
2004]
[Dimsoski,
2000]
Notes:
* - Temperature was optimized
F - forward primer's sequence;
R - reverse primer's sequence;
D - denaturation;
AT - annealing temperature;
E - extension.
C - Cycles
Separation in 8% PAGE
Gel analysіs in Totallab v.2.01
Statistical Analysis in Genalex 6.5 (Peakall &
Smouse, 2006, 2012).
PIC (The polymorphic information content ) was
calculated using the formulas generally accepted
for codominant markers (Nagy et al., 2012).
1. Barinova,A., Yadrenkina,E., Nakajima,M. and Taniguchi,N.
(2004). Identification and characterization of microsatellite
DNA markers developed in ide Leuciscus idus and Siberian
[Сrooijmans,
roach Rutilus rutilus. Mol. Ecol. Notes 4, 86-88
1997]
2. Dimsoski P. , Toth G. P. , Bagley M. J. (2000) Microsatellite
characterization in central stoneroller Campostoma anomalum
(Pisces: Cyprinidae). Blackwell Science Ltd, Molecular
Ecology, 9, 2187–2189
3. Сrooijmans R., Bierbooms V., Komen J. et al. Miсrosatellite
markers in common carp (Cyprinus carpio L.). Animal
Genetics. 1997. V. 28. P. 129 – 134.
[Gheyas,
4.Gheyas
A. A., Cairney M., Gilmour A. E., Sattar M. A., Das T.
2006]
K., Mcandrew B. J., Penman D. J. and Taggart J. B. (2006)
Characterization of microsatellite loci in silver carp
(Hypophthalmichthys molitrix), and cross-amplification in
other cyprinid species. Molecular Ecology Notes 6, 656–659.
doi: 10.1111/j.1471-8286.2006.01288.x © 2006
4.
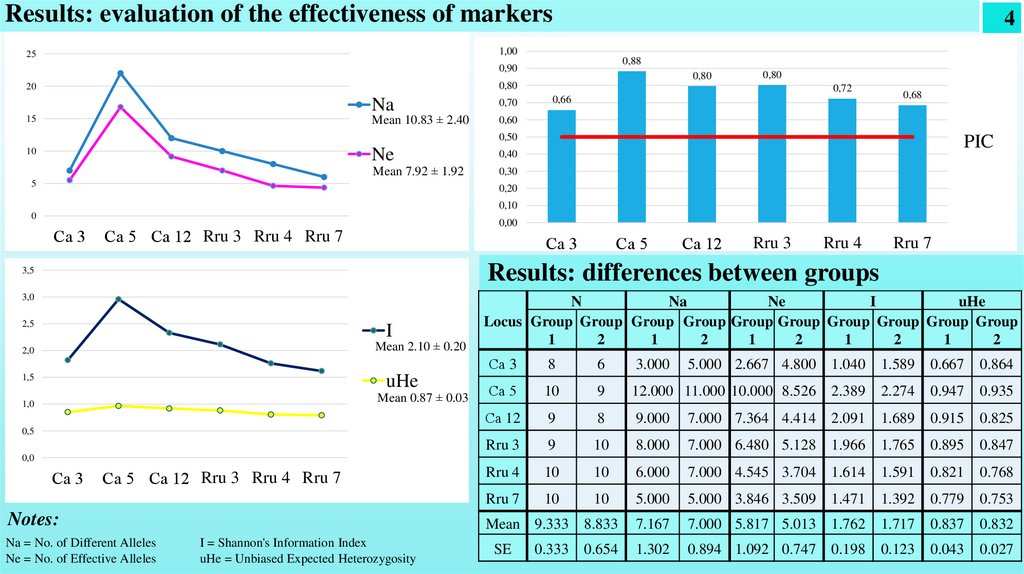
Results: evaluation of the effectiveness of markers4
1,00
25
0,88
0,90
0,80
0,80
0,80
20
Na
Mean 10.83 ± 2.40
15
0,70
0,72
0,66
0,68
0,60
0,50
Ne
10
Mean 7.92 ± 1.92
5
PIC
0,40
0,30
0,20
0,10
0
Са 3
0,00
Са 5 Са 12 Rru 3 Rru 4 Rru 7
Са 3
Са 5
Са 12
Rru 3
Rru 4
Rru 7
3,5
Results: differences between groups
3,0
N
Na
Ne
I
uHe
Locus Group Group Group Group Group Group Group Group Group Group
1
2
1
2
1
2
1
2
1
2
2,5
I
Mean 2.10 ± 0.20
2,0
uHe
1,5
Mean 0.87 ± 0.03
1,0
Са 3
8
6
3.000
5.000 2.667 4.800
1.040
1.589
0.667
0.864
Са 5
10
9
12.000 11.000 10.000 8.526
2.389
2.274
0.947
0.935
Са 12
9
8
9.000
7.000 7.364 4.414
2.091
1.689
0.915
0.825
Rru 3
9
10
8.000
7.000 6.480 5.128
1.966
1.765
0.895
0.847
Rru 4
10
10
6.000
7.000 4.545 3.704
1.614
1.591
0.821
0.768
Rru 7
10
10
5.000
5.000 3.846 3.509
1.471
1.392
0.779
0.753
Mean 9.333
8.833
7.167
7.000 5.817 5.013
1.762
1.717
0.837
0.832
SE
0.654
1.302
0.894 1.092 0.747
0.198
0.123
0.043
0.027
0,5
0,0
Са 3
Са 5 Са 12 Rru 3 Rru 4 Rru 7
Notes:
Na = No. of Different Alleles
Ne = No. of Effective Alleles
I = Shannon's Information Index
uHe = Unbiased Expected Heterozygosity
0.333
5.
0,60,5
0,4
0,3
0,2
0,1
0
І
5
0,4
ІI
І
224
232
237
255
275
Frequency
Frequency
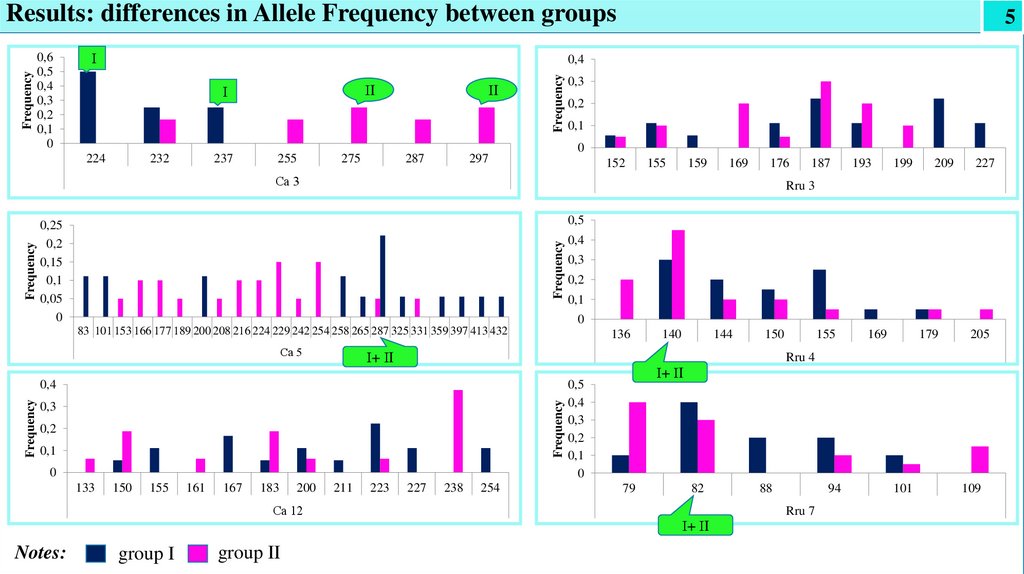
Results: differences in Allele Frequency between groups
ІI
287
0,3
0,2
0,1
0
297
152
155
159
169
176
209
227
fff
0,4
0,3
0,2
0,1
0
83 101 153 166 177 189 200 208 216 224 229 242 254 258 265 287 325 331 359 397 413 432
Са 5
136
І+ ІI
Frequency
0,3
0,2
0,1
0
133
150
155
161
167
183
200
Са 12
group I
group II
211
223
140
144
150
155
169
179
205
Rru 4
0,4
Frequency
199
0,5
0,25
0,2
0,15
0,1
0,05
0
Notes:
193
Rru 3
Frequency
Frequency
Са 3
187
227
238
254
І+ ІI
0,5
0,4
0,3
0,2
0,1
0
79
82
І+ ІI
88
94
Rru 7
101
109
6.
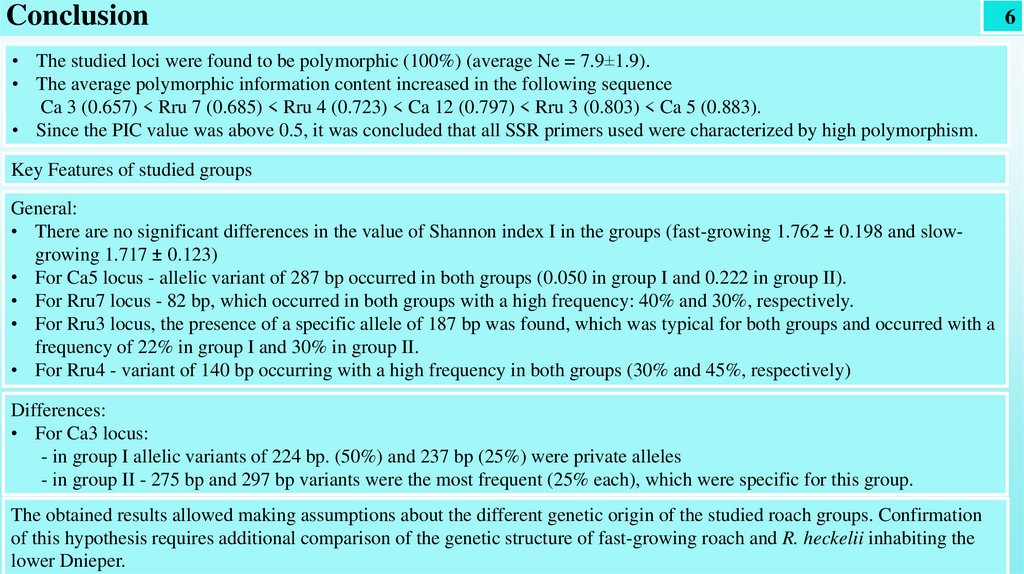
Conclusion• The studied loci were found to be polymorphic (100%) (average Ne = 7.9±1.9).
• The average polymorphic information content increased in the following sequence
Ca 3 (0.657) < Rru 7 (0.685) < Rru 4 (0.723) < Ca 12 (0.797) < Rru 3 (0.803) < Ca 5 (0.883).
• Since the PIC value was above 0.5, it was concluded that all SSR primers used were characterized by high polymorphism.
Key Features of studied groups
General:
• There are no significant differences in the value of Shannon index I in the groups (fast-growing 1.762 ± 0.198 and slowgrowing 1.717 ± 0.123)
• For Ca5 locus - allelic variant of 287 bp occurred in both groups (0.050 in group I and 0.222 in group II).
• For Rru7 locus - 82 bp, which occurred in both groups with a high frequency: 40% and 30%, respectively.
• For Rru3 locus, the presence of a specific allele of 187 bp was found, which was typical for both groups and occurred with a
frequency of 22% in group I and 30% in group II.
• For Rru4 - variant of 140 bp occurring with a high frequency in both groups (30% and 45%, respectively)
Differences:
• For Ca3 locus:
- in group I allelic variants of 224 bp. (50%) and 237 bp (25%) were private alleles
- іn group II - 275 bp and 297 bp variants were the most frequent (25% each), which were specific for this group.
The obtained results allowed making assumptions about the different genetic origin of the studied roach groups. Confirmation
of this hypothesis requires additional comparison of the genetic structure of fast-growing roach and R. heckelii inhabiting the
lower Dnieper.
6
7.
THANK YOUFOR YOUR ATTENTION!