

 finance
 business
Similar presentations:


")

")
")
")

Index numbers (lecture 4)
1.
2.
LECTURE 4INDEX NUMBERS
Temur Makhkamov
Indira Khadjieva
QM Module Leaders
tmakhkamov@wiut.uz
i.khadjieva@wiut.uz
Office hours: by appointment
Room IB 205
EXT: 546
3.
Lecture OutlineTo understand the concept of index number and its use in
economics, finance and business
To Represent data in terms of index numbers
To understand some well-known indices sush as Consumer
Price Index, Dow Jones Industrial Averages and the
Nasdaq Index
4.
Index NumbersIndex number is the measure of change in a variable over
time
Index numbers allows relative comparisons over time
They are typically used in economics to measure trends in
a wide variety of areas including: stock market prices, cost
of living, imports, exports, industrial or agricultural
production and etc,.
5.
Simple Index numbersWhen an item is considered:
1) Fixed base index
2) Chain base index
When a group of items are considered:
1) Simple mean index
2) Simple aggregate index
6.
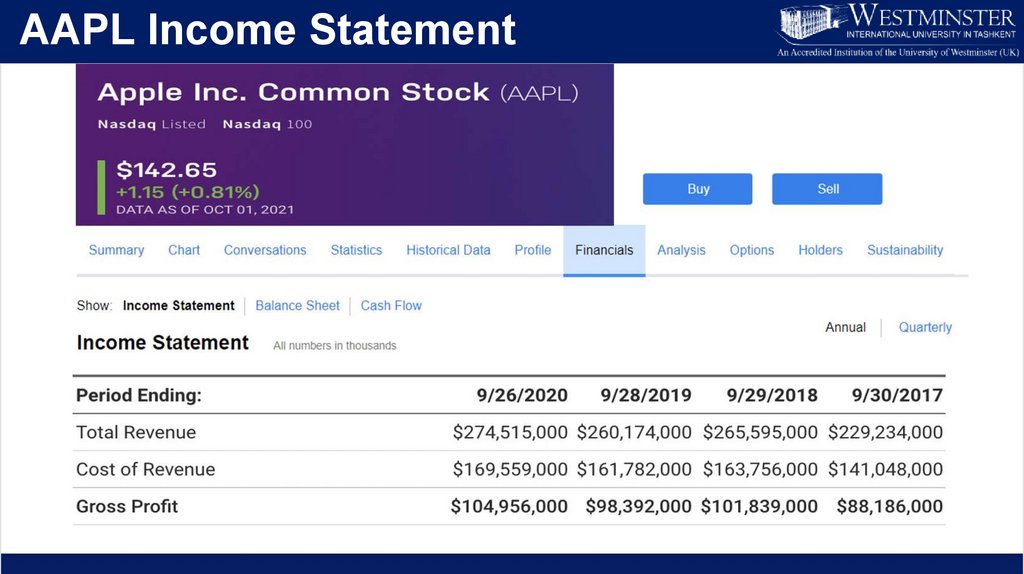
AAPL Income Statement7.
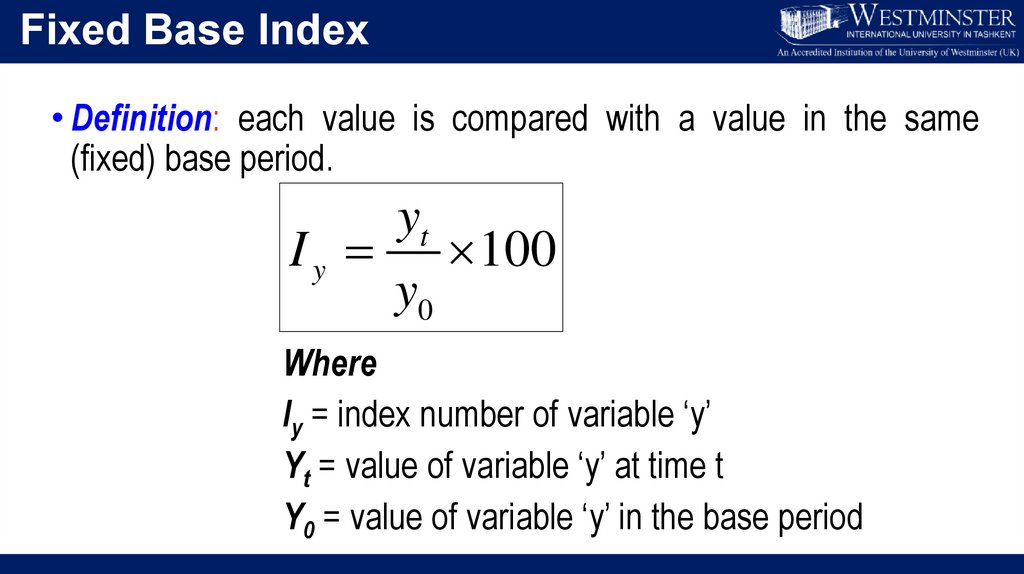
Fixed Base Index• Definition: each value is compared with a value in the same
(fixed) base period.
yt
I y 100
y0
Where
Iy = index number of variable ‘y’
Yt = value of variable ‘y’ at time t
Y0 = value of variable ‘y’ in the base period
8.
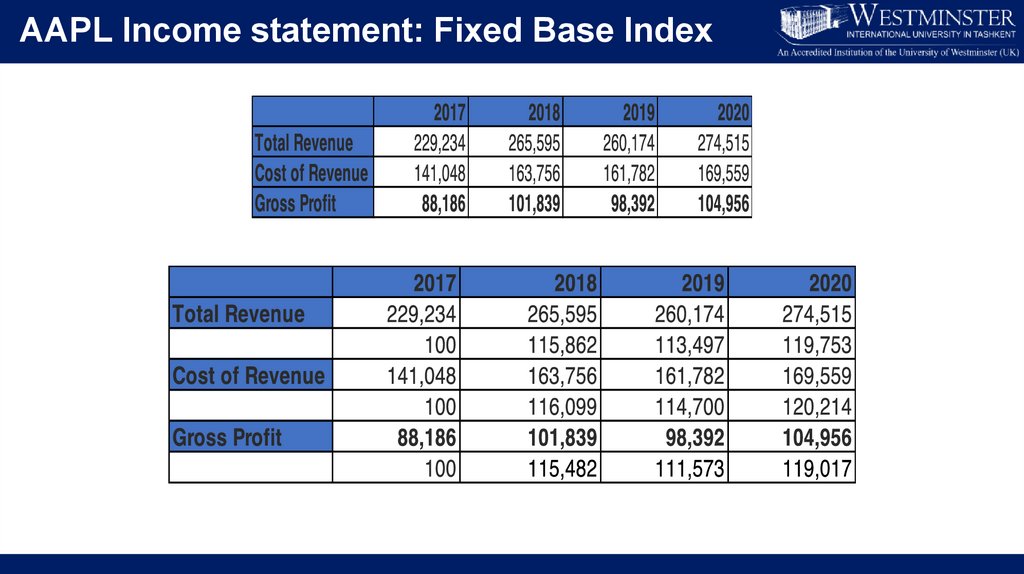
AAPL Income statement: Fixed Base Index9.
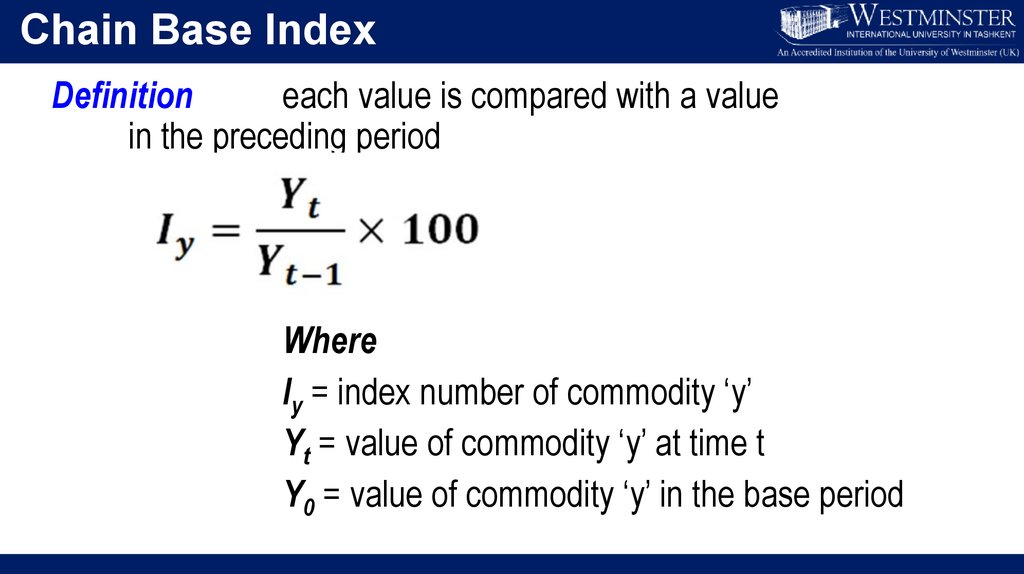
Chain Base IndexDefinition
each value is compared with a value
in the preceding period
Where
Iy = index number of commodity ‘y’
Yt = value of commodity ‘y’ at time t
Y0 = value of commodity ‘y’ in the base period
10.
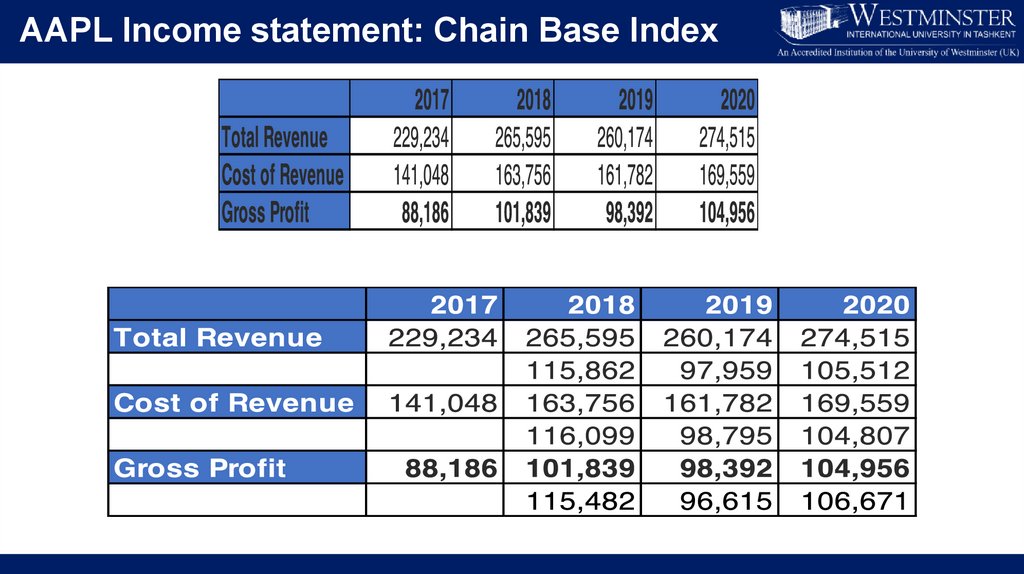
AAPL Income statement: Chain Base Index11.
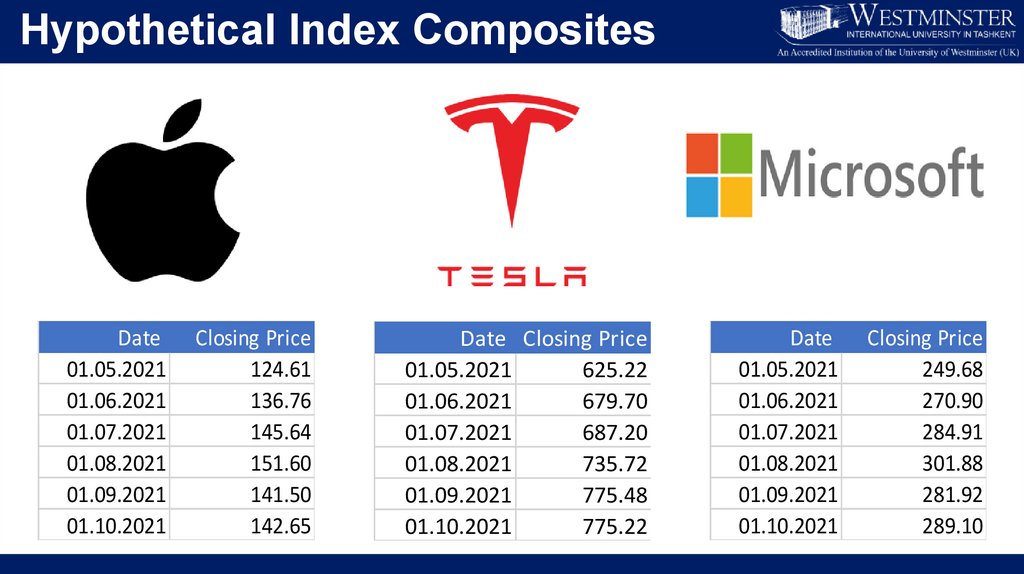
Hypothetical Index CompositesDate
01.05.2021
01.06.2021
01.07.2021
01.08.2021
01.09.2021
01.10.2021
Closing Price
124.61
136.76
145.64
151.60
141.50
142.65
Date Closing Price
01.05.2021
625.22
01.06.2021
679.70
01.07.2021
687.20
01.08.2021
735.72
01.09.2021
775.48
01.10.2021
775.22
Date
01.05.2021
01.06.2021
01.07.2021
01.08.2021
01.09.2021
01.10.2021
Closing Price
249.68
270.90
284.91
301.88
281.92
289.10
12.
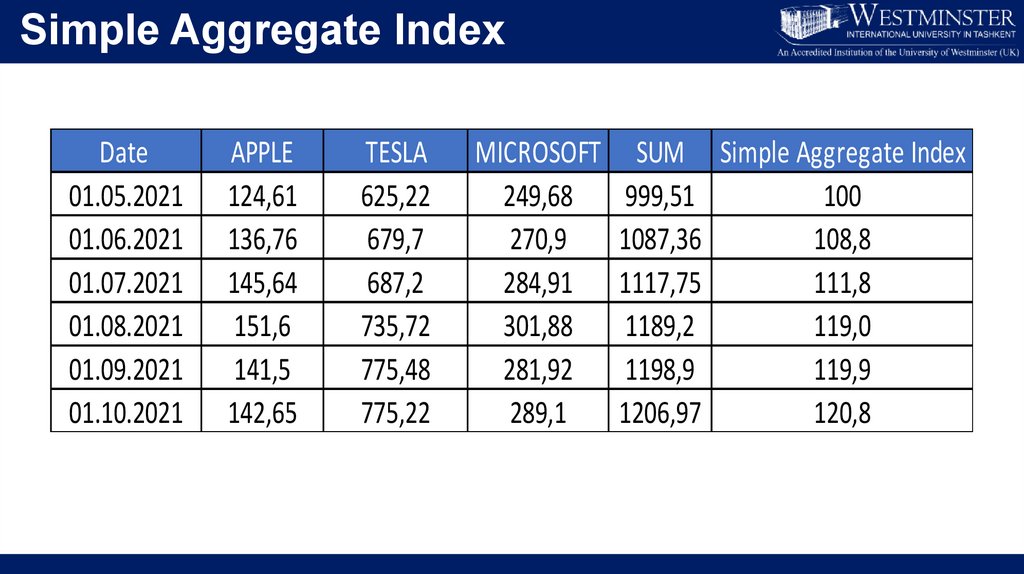
Simple Aggregate IndexDate
01.05.2021
01.06.2021
01.07.2021
01.08.2021
01.09.2021
01.10.2021
APPLE
124,61
136,76
145,64
151,6
141,5
142,65
TESLA
625,22
679,7
687,2
735,72
775,48
775,22
MICROSOFT
249,68
270,9
284,91
301,88
281,92
289,1
SUM Simple Aggregate Index
999,51
100
1087,36
108,8
1117,75
111,8
1189,2
119,0
1198,9
119,9
1206,97
120,8
13.
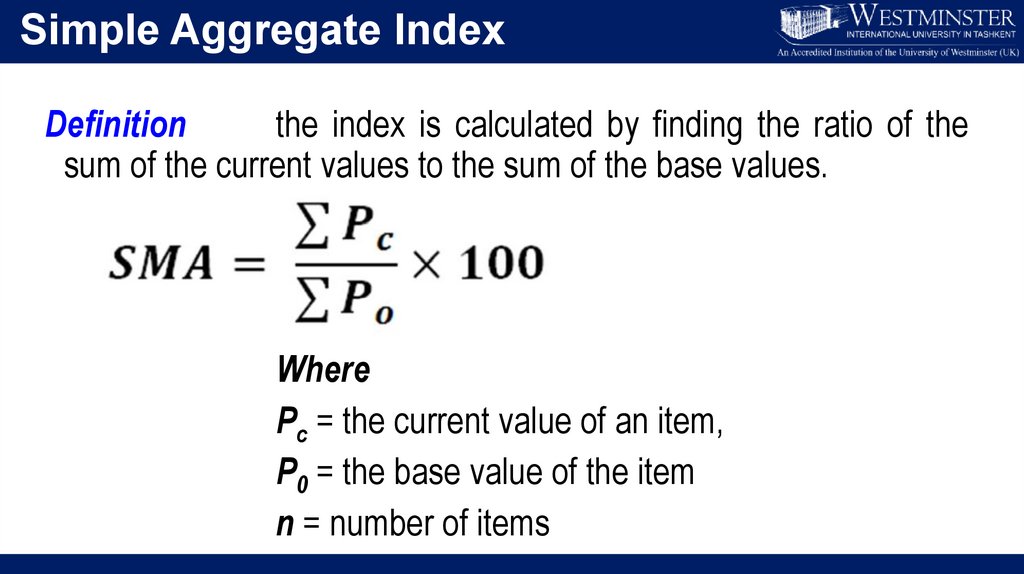
Simple Aggregate IndexDefinition
the index is calculated by finding the ratio of the
sum of the current values to the sum of the base values.
Where
Pc = the current value of an item,
P0 = the base value of the item
n = number of items
14.
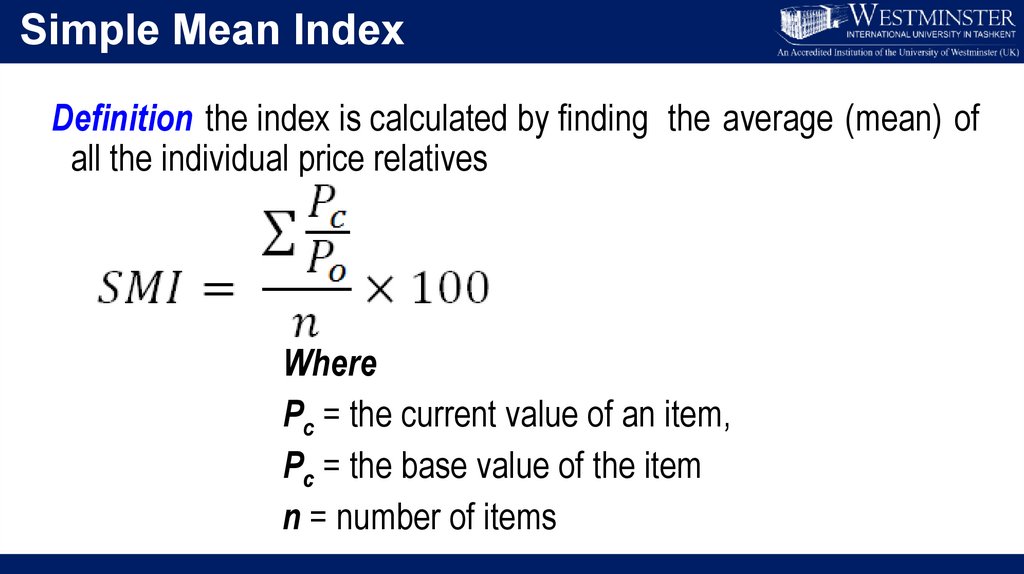
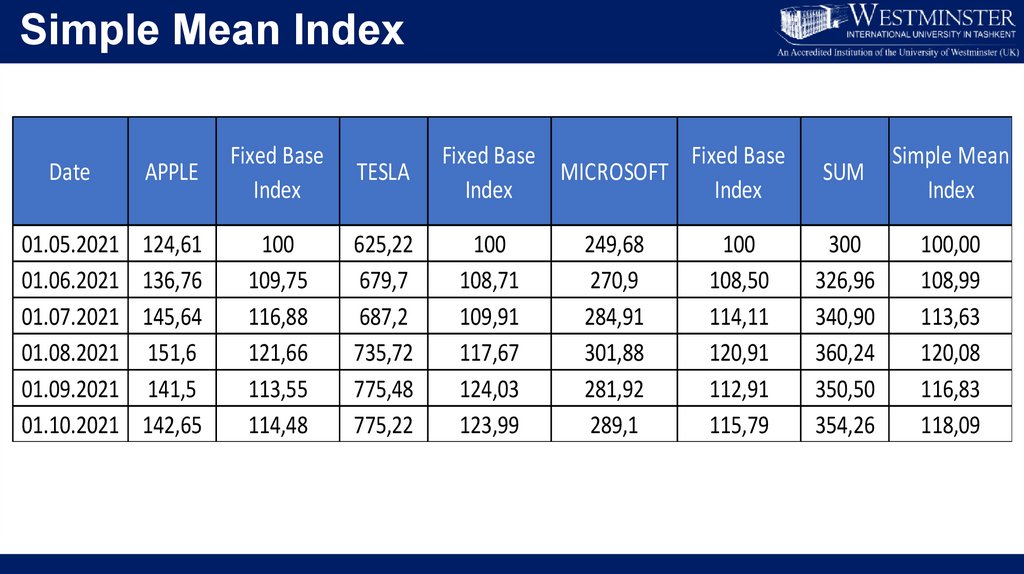
Simple Mean IndexDefinition the index is calculated by finding the average (mean) of
all the individual price relatives
Where
Pc = the current value of an item,
Pc = the base value of the item
n = number of items
15.
Simple Mean IndexDate
APPLE
Fixed Base
Index
01.05.2021
01.06.2021
01.07.2021
01.08.2021
01.09.2021
01.10.2021
124,61
136,76
145,64
151,6
141,5
142,65
100
109,75
116,88
121,66
113,55
114,48
TESLA
625,22
679,7
687,2
735,72
775,48
775,22
Fixed Base
Fixed Base
MICROSOFT
Index
Index
100
108,71
109,91
117,67
124,03
123,99
249,68
270,9
284,91
301,88
281,92
289,1
100
108,50
114,11
120,91
112,91
115,79
SUM
Simple Mean
Index
300
326,96
340,90
360,24
350,50
354,26
100,00
108,99
113,63
120,08
116,83
118,09
16.
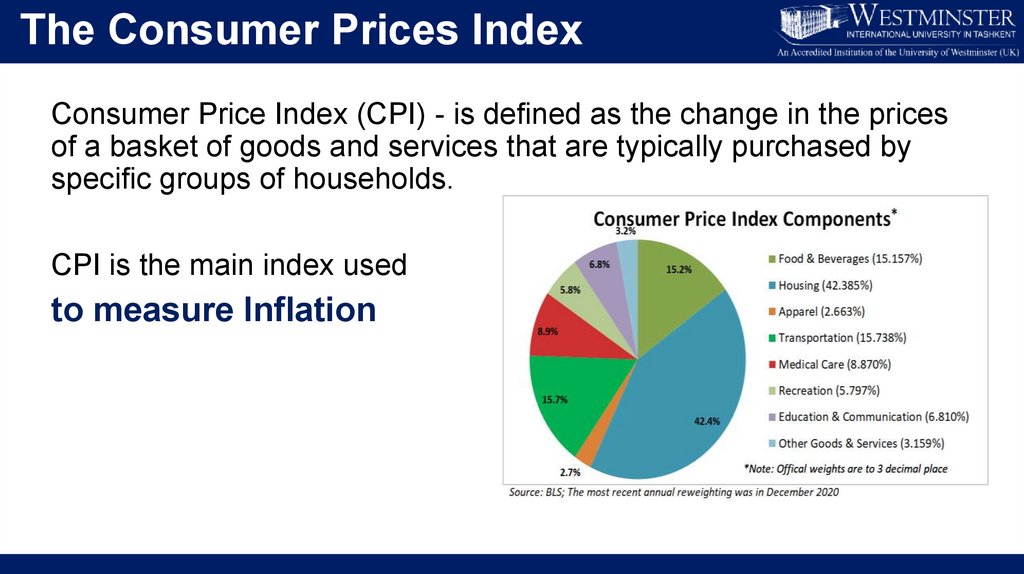
The Consumer Prices IndexConsumer Price Index (CPI) - is defined as the change in the prices
of a basket of goods and services that are typically purchased by
specific groups of households.
CPI is the main index used
to measure Inflation
17.
Dow Jones Industrial AveragesThe Dow Jones Industrial Average (DJIA) - price-weighted average of 30 bluechip stocks that are generally the leaders in their industry.
Widely followed indicator of the stock market since October 1, 1928.
30 most important market-leading companies on the American stock exchange
and reflects their growth
18.
The Nasdaq IndexThe Nasdaq 100 includes the shares of the 100 largest American and
international companies as measured by their market capitalization which do
not come from the financial sector and which are traded on the largest
electronic stock exchange in the USA.
The shares included in it are weighted according to market capitalization
The index level represents the average of the shares included in it.
Dividend payments are not considered when calculating the index.
19.
Concluding remarksToday, you learnt:
The method of indexing data
The different types of indices used to show the change of the data
over time
20.
Essential readingsJon Curwin…, “Quantitative methods…”, Ch 7
Glyn Burton…, “Quantitative methods…”, Ch 8
Richard Thomas, “Quantitative methods…”, Ch 5.1-5.3
Mik Wisniewski…, “Foundation Quantitative…”, Ch 7
Clare Morris, “Quantitative Approaches…”, Ch 7
Louise Swift “Quantitative methods…”, Ch DD2.