


 software
Similar presentations:


 in MS power bi. DAX functions")

")


Power BI Introduction to Power BI
1.
Power BIIntroduction to Power BI
2.
Hello, my name is Kristina• Business Intelligence developer with 7+ years of production
experience.
• Advanced level in reporting including Tibco Spotfire, Power BI,
Qlikview;
• Power BI POCs, pre-sales, mentoring participation;
• Strong proven development skills, including data modelling;
• Strong Business Analysis skills and experience in requirements
elicitation and communication with stakeholders;
• Delivery Management production experience;
• Practical HTML, Python, R development experience;
• Working in Agile and KANBAN methodologies.
2
3.
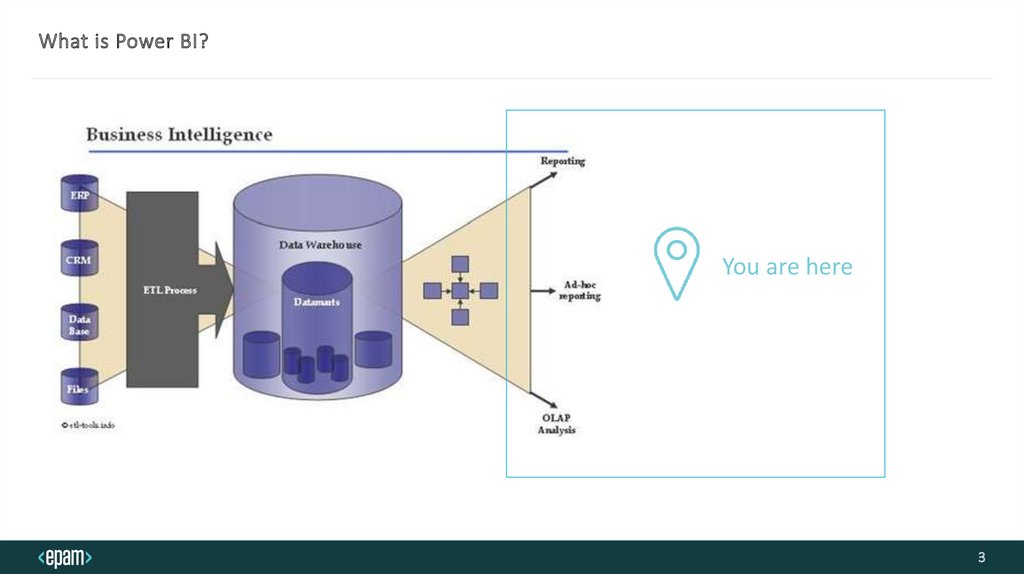
What is Power BI?You are here
3
4.
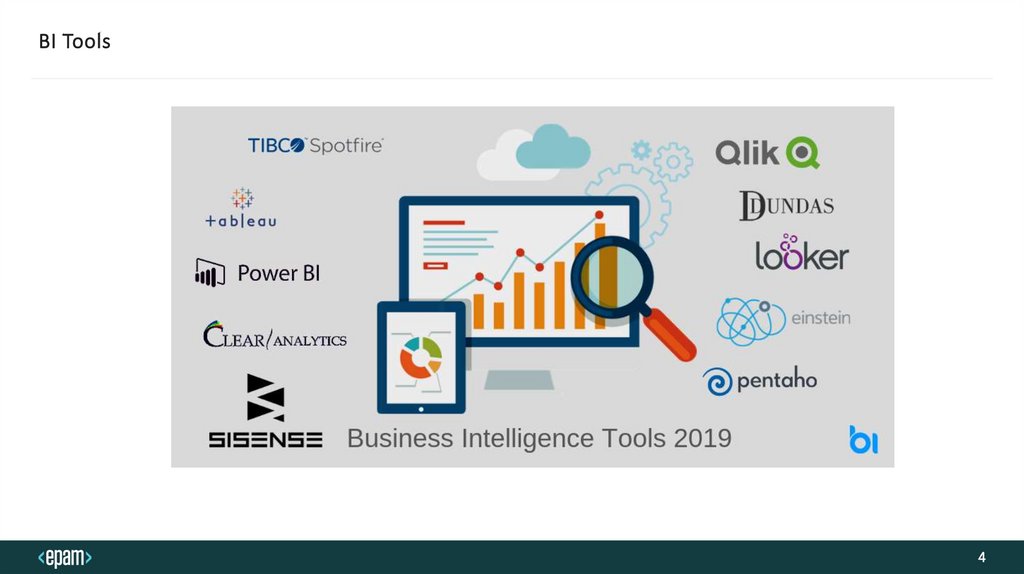
BI Tools4
5.
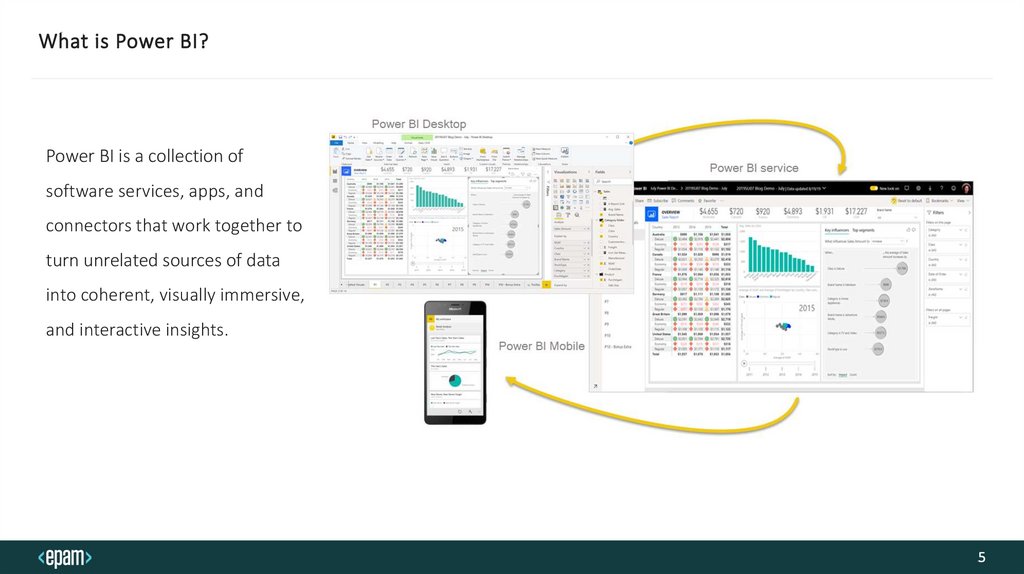
What is Power BI?Power BI is a collection of
software services, apps, and
connectors that work together to
turn unrelated sources of data
into coherent, visually immersive,
and interactive insights.
5
6.
Power BI Success Stories with EPAMEPAM has several success stories with Power BI implementation: Chevron,
MSD Int., Kronos, HAVI, etc. A lot of widely used EPAM internal reports are
also built in Power BI (staffing, PlusX, etc.).
6
7.
Power BI PlatformPower BI consists of:
• A Windows desktop application called Power BI
Desktop.
• An online SaaS (Software as a Service) service
called the Power BI service.
• Power BI mobile apps for Windows, iOS, and
Android devices.
7
8.
Power BI DesktopThe most common uses for Power BI Desktop are as
follows:
• Connect to data
• Transform and clean that data, to create a data model
• Create visuals, such as charts or graphs, that provide
visual representations of the data
• Create reports that are collections of visuals, on one or
more report pages
• Share reports with others by using the Power BI
service
There are three views available in Power BI Desktop, which you select on the left side of the canvas.
Report: In this view, you create reports and visuals, where most of your creation time is spent.
Data: In this view, you see the tables, measures, and other data used in the data model associated with your report and
transform the data for best use in the report's model.
Model: In this view, you see and manage the relationships among tables in your data model.
8
9.
Power BI Service• Power BI Service (usually known simply as Power BI) is the full
version of Power BI, and is hosted on Azure, Microsoft’s cloud
platform. There are two ways to license Power BI Service;
Power BI Pro and Power BI Premium.
• The Microsoft Power BI service (app.powerbi.com), sometimes
referred to as Power BI online, is the SaaS (Software as a
Service) part of Power BI. In the Power BI service, dashboards
help you keep a finger on the pulse of your business.
Dashboards display tiles, which you can select to open reports
for exploring further. Dashboards and reports connect to
datasets that bring all of the relevant data together in one
place.
9
10.
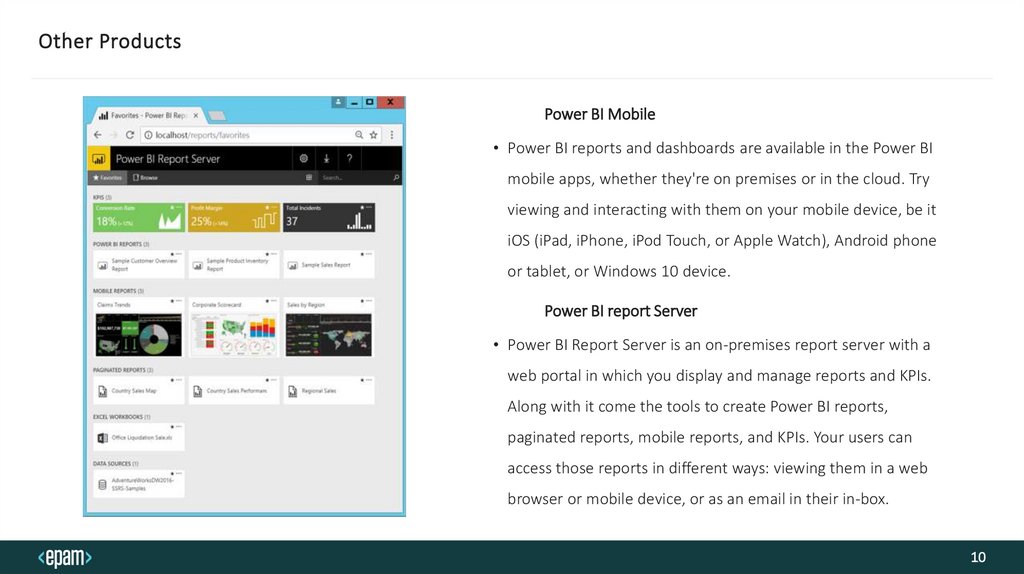
Other ProductsPower BI Mobile
• Power BI reports and dashboards are available in the Power BI
mobile apps, whether they're on premises or in the cloud. Try
viewing and interacting with them on your mobile device, be it
iOS (iPad, iPhone, iPod Touch, or Apple Watch), Android phone
or tablet, or Windows 10 device.
Power BI report Server
• Power BI Report Server is an on-premises report server with a
web portal in which you display and manage reports and KPIs.
Along with it come the tools to create Power BI reports,
paginated reports, mobile reports, and KPIs. Your users can
access those reports in different ways: viewing them in a web
browser or mobile device, or as an email in their in-box.
10
11.
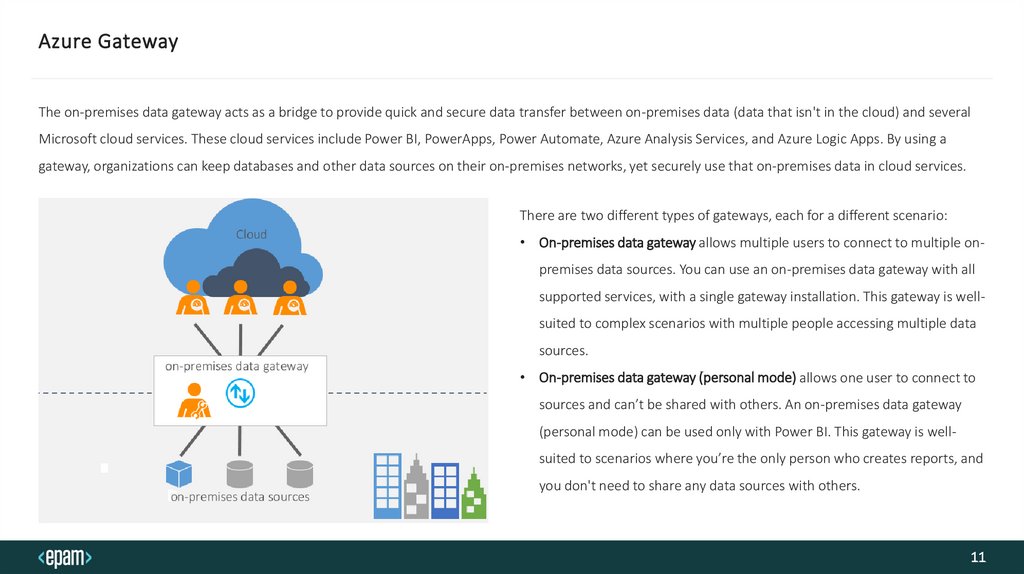
Azure GatewayThe on-premises data gateway acts as a bridge to provide quick and secure data transfer between on-premises data (data that isn't in the cloud) and several
Microsoft cloud services. These cloud services include Power BI, PowerApps, Power Automate, Azure Analysis Services, and Azure Logic Apps. By using a
gateway, organizations can keep databases and other data sources on their on-premises networks, yet securely use that on-premises data in cloud services.
There are two different types of gateways, each for a different scenario:
• On-premises data gateway allows multiple users to connect to multiple onpremises data sources. You can use an on-premises data gateway with all
supported services, with a single gateway installation. This gateway is well-
suited to complex scenarios with multiple people accessing multiple data
sources.
• On-premises data gateway (personal mode) allows one user to connect to
sources and can’t be shared with others. An on-premises data gateway
(personal mode) can be used only with Power BI. This gateway is wellsuited to scenarios where you’re the only person who creates reports, and
you don't need to share any data sources with others.
11
12.
Power BI ComponentsThe Power BI product is made up of a number of apps,
each with their own features and uses. These include:
• Power Query: a data connection tool that lets you
transform, combine, and enhance data from several
sources
• Power Pivot: a data modeling tool for creating data
models
• Power View: a data visualization tool that generates
interactive charts, graphs, maps, and other visuals
• Power Map: another visualization tool for creating
immersive 3D visuals
• Power Q&A: a question and answer engine that lets
you ask questions about your data in plain language
12
13.
Power QueryPower Query is data transformation and mash up
engine. Power Query can be downloaded as an add-in
for Excel or be used as part of Power BI Desktop. With
Power Query you can extract data from many different
data sources. You can read data from databases such as
SQL Server, Oracle, MySQL, DB2, and many other
databases. You can fetch data from files such as CSV,
Text, Excel.
Power Query also uses a powerful formula language as
code behind called M. M is much more powerful than
the GUI built for it. There are many functionalities in M
that cannot be accessed through graphical user
interface. Screenshot below is a view of Power Query
editor and some of its transformations.
13
14.
Power PivotPower Pivot is data modelling engine which works on
xVelocity In-Memory based tabular engine. The InMemory engine gives Power Pivot fast response time
and the modelling engine provides the possibility to
build the star schema, calculated measures and
columns, build relationships through entities and so on.
Power Pivot uses Data Analysis eXpression language
(DAX) for building measures and calculated columns.
DAX is a powerful functional language, and there are
heaps of functions for that in the library. We will go
through details of Power Pivot modelling and DAX in
future chapters.
14
15.
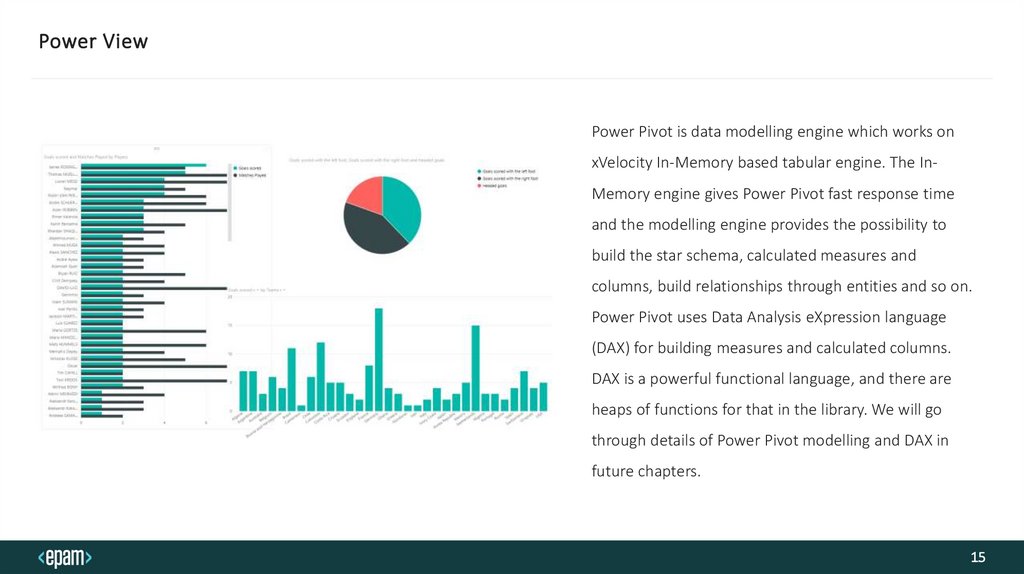
Power ViewPower Pivot is data modelling engine which works on
xVelocity In-Memory based tabular engine. The InMemory engine gives Power Pivot fast response time
and the modelling engine provides the possibility to
build the star schema, calculated measures and
columns, build relationships through entities and so on.
Power Pivot uses Data Analysis eXpression language
(DAX) for building measures and calculated columns.
DAX is a powerful functional language, and there are
heaps of functions for that in the library. We will go
through details of Power Pivot modelling and DAX in
future chapters.
15
16.
Power Q&APower Q&A is a natural language engine for
questions and answers to your data model.
Once you’ve built your data model and deployed
that into Power BI website, then you or your
users can ask questions and get answers easily.
There are some tips and tricks about how to
build your data model so it can answer
questions in the best way. Users can simply ask
questions such as: Number of Stores by State,
and Power Q&A will answer their question in a
bar chart.
16
17.
Homework1.
PBIX file with your progress
2.
Word/Power Point file with screenshots and comments
3.
* Additional steps described in the homework
17