


 software
Similar presentations:


 in MS power bi. DAX functions")


")


")
Power BI
1.
Power BIProject Design Essentials
2.
Power BI Data SourcesPower BI Data sources
You can get data from any of the data sources into Power BI by selecting Get Data.
Power BI allows you to load data from different data source types:
simple files (like Excel, csv files, etc.)
databases (whether on-premise or cloud)
web services (Google analytics, Github, etc)
and many others.
Databases:
Databases in the Cloud
From the Power BI service, you can connect live to:
Azure SQL Database
Azure SQL Data Warehouse
Spark on Azure HDInsight
Connections from Power BI to these databases are live. Let's say you connect to an
Azure SQL Database. You then begin exploring its data by creating reports in Power
BI. Whenever you slice your data or add another field to a visualization, Power BI
makes a query right to the database.
2
3.
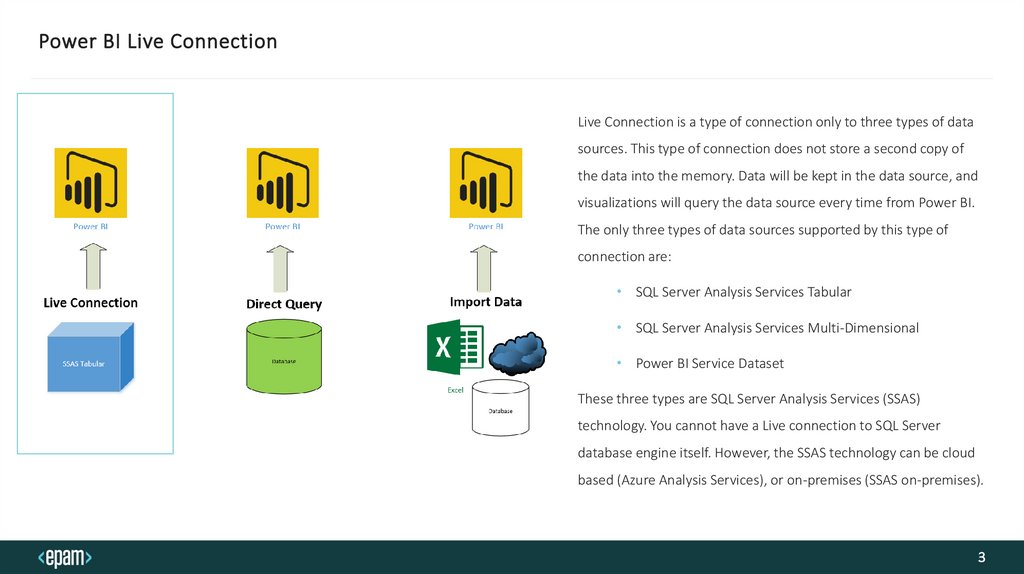
Power BI Live ConnectionLive Connection is a type of connection only to three types of data
sources. This type of connection does not store a second copy of
the data into the memory. Data will be kept in the data source, and
visualizations will query the data source every time from Power BI.
The only three types of data sources supported by this type of
connection are:
• SQL Server Analysis Services Tabular
• SQL Server Analysis Services Multi-Dimensional
• Power BI Service Dataset
These three types are SQL Server Analysis Services (SSAS)
technology. You cannot have a Live connection to SQL Server
database engine itself. However, the SSAS technology can be cloud
based (Azure Analysis Services), or on-premises (SSAS on-premises).
3
4.
Power BI Live Connection Pros and ConsCons:
• Most limiting of all in terms of disabling Power BI features.
• Cost
• Different Tools
Pros:
• Change Control
This feature that can be implemented by Team Foundation Services allows for a developer to manage their code.
• No memory or size constraints in Power BI
A dedicated server / Azure implementation has the capability to scale up to whatever RAM is necessary to support the model. The limitations of the
Desktop are gone, and Power BI capable of handling high volumes of data.
• More Secure & Better security
Along with the security of being permissioned to access the model there is an extremely valid argument related to security that just make a SSAS
model better.
• Partitions
Partitions in a model allow you to process, or NOT process, certain parts of the model independently from one another. This gives an immense
amount of flexibility in a large-scale solution and make the overall processing more efficient. Using partitions allows you to only process the
information that changes and thus reduce the number of resources, reduce processing, and create an efficient model.
4
5.
Power BI Data SourcesDatabases on-premises
From the Power BI, you can connect directly to an on-premise databases. To keep the data automatically refreshed, you'll need a Power BI Enterprise gateway.
For all data sources used in the Power BI service, consider the following limitations. There are other limitations that apply to specific features, but the
following list applies to the full Power BI service:
Dataset size limit - There's a 1-GB limit for datasets stored in Shared capacities in the Power BI service (except Power BI Premium licensing
option).
Distinct values in a column - When caching data in a Power BI dataset ('Import' mode, see details below), there is a 1,999,999,997 limit on the
number of distinct values that can be stored in a column.
Row limit - When using DirectQuery, Power BI imposes a limit on the query results that are sent to your underlying data source. If the query sent
to the data source returns more than one million rows, you see an error and the query fails. Your underlying data can still contain more than one
million rows. You're unlikely to run into this limit as most reports aggregate the data into smaller sets of results.
Column limit - The maximum number of columns allowed in a dataset, across all tables in the dataset, is 16,000 columns. This limit applies to the
Power BI service and to datasets used in Power BI Desktop. Power BI tracks the number of columns and tables in the dataset in this way, which
means the maximum number of columns is 16,000 minus one for each table in the dataset.
There are two options for loading data from an on-premise database:
o
Import
o
Direct Query
5
6.
Power BI Data Load TypesImport:
• Upon load, all the data defined by those queries will be imported into the Power BI cache.
• Upon building a visual within Power BI Desktop, the imported data will be queried. The Power BI store ensures the query will be fast. All changes to the
visual are reflected immediately.
• Any changes to the underlying data aren't reflected in any visuals. It's necessary to Refresh to reimport data.
• Upon publishing the report as a .pbix file to the Power BI service, a dataset is created and uploaded to the Power BI service. The imported data is included
with that dataset. It's then possible to schedule refresh of that data, for example, to reimport the data every day. Depending upon the location of the
original data source, it might be necessary to configure an on-premises data gateway.
• When opening an existing report in the Power BI service, or authoring a new report, the imported data is queried again, ensuring interactivity.
• Visuals, or entire report pages, can be pinned as dashboard tiles. The tiles automatically refresh whenever the underlying dataset refreshes.
6
7.
Power BI Data Load TypesDirectQuery:
• During the initial Get Data experience, the source is selected. For relational sources, a set of tables are selected and each still define a query that logically
returns a set of data. For multidimensional sources, like SAP BW, only the source is selected.
• However, upon load, no data is imported into the Power BI store. Instead, upon building a visual within Power BI Desktop, queries are sent to the
underlying data source to retrieve the necessary data. The time taken to refresh the visual depends on the performance of the underlying data source.
• Any changes to the underlying data aren't immediately reflected in any existing visuals. It's still necessary to refresh. The necessary queries are resent for
each visual, and the visual is updated as necessary.
• Upon publishing the report to the Power BI service, it will again result in a dataset in the Power BI service, the same as for import. However, no data is
included with that dataset.
• When opening an existing report in the Power BI service, or authoring a new one, the underlying data source is again queried to retrieve the necessary
data. Depending upon the location of the original data source, it might be necessary to configure an on-premises data gateway, as is needed for import
mode if the data is refreshed.
• Visuals, or entire report pages, can be pinned as Dashboard tiles. To ensure that opening a dashboard is fast, the tiles are automatically refreshed on a
schedule, for example, every hour. The frequency of this refresh can be controlled, to reflect how frequently the data is changing, and how important it's to
see the latest data. When opening a dashboard, the tiles reflect the data at the time of the last refresh, and not necessarily the latest changes made to the
underlying source. You can refresh an open dashboard to ensure it's current.
7
8.
Direct Query in Power BiThere are a few benefits to using DirectQuery:
• DirectQuery lets you build visualizations over very large datasets, where it would otherwise be unfeasible to first import all the data with pre-aggregation.
• Underlying data changes can require a refresh of data. For some reports, the need to display current data can require large data transfers, making
reimporting data unfeasible. By contrast, DirectQuery reports always use current data.
There are currently a few limitations to using DirectQuery:
• If the Query Editor query is overly complex, an error occurs. To remedy the error, either delete the problematic step in Query Editor, or import the data
instead of using DirectQuery. For multi-dimensional sources like SAP Business Warehouse, there's no Query Editor.
• Time intelligence capabilities are unavailable in DirectQuery. For example, special treatment of date columns (such as year, quarter, month, or day) isn't
supported in DirectQuery mode.
• Limitations are placed on DAX expressions allowed in measures to ensure that queries sent to the underlying data source have acceptable performance.
• There's a one-million-row limit for returning data when using DirectQuery, unless using a Premium capacity. The limit doesn't affect aggregations or
calculations used to create the dataset returned using DirectQuery. It only affects the rows returned. Premium capacities can set maximum row limits, as
described in this post.
• For example, you can aggregate 10 million rows with your query that runs on the data source. The query accurately returns the results of that aggregation
to Power BI using DirectQuery if the returned Power BI data is less than 1 million rows. If over 1 million rows are returned from DirectQuery, Power BI
returns an error (unless in Premium capacity, and the row count is under the admin-set limit).
8
9.
Direct Query ConsiderationsPerformance and load: All DirectQuery requests are sent to the source database, so the required visual refresh time depends on how long that back-end
source takes to respond with the results from the query (or queries). Five seconds or less is the recommended response time (with requested data being
returned) for using DirectQuery for visuals; the maximum recommended time is 30 seconds. Any longer, and the experience of a user consuming the
report becomes unacceptably poor. After a report is published to the Power BI service, any query that takes longer than a few minutes will time out, and
the user will receive an error.
Load on the source database should also be considered, based on the number of Power BI users who will consume the published report. Using Row Level
Security (RLS) can have a significant impact as well.
Security : By default, all users who consume a published report connect to the back-end data source using the credentials entered after publication to the
Power BI service. This process is the same for data that's imported: all users see the same data, regardless of any security rules defined in the backend
source.
Customers who want per-user security implemented with DirectQuery sources should either use RLS or configure Kerberos-constrained authentication
against the source. Kerberos isn't available for all sources.
Supported features: Some features in Power BI Desktop are unsupported in DirectQuery mode, or they have limitations. Also, some capabilities in the
Power BI service (such as Quick Insights) aren't available for datasets using DirectQuery. When determining whether to use DirectQuery, you should
consider these feature limitations.
9
10.
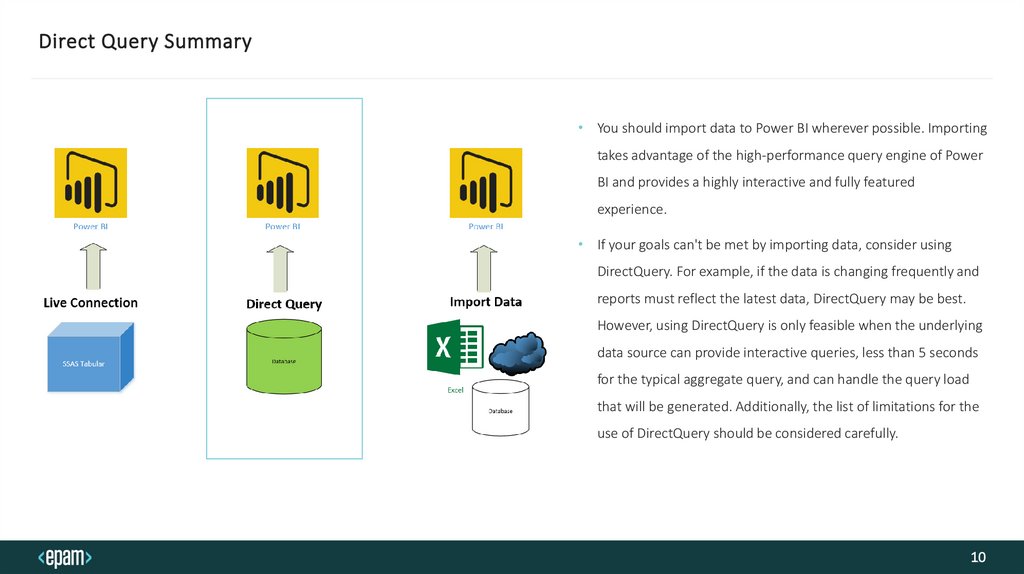
Direct Query Summary• You should import data to Power BI wherever possible. Importing
takes advantage of the high-performance query engine of Power
BI and provides a highly interactive and fully featured
experience.
• If your goals can't be met by importing data, consider using
DirectQuery. For example, if the data is changing frequently and
reports must reflect the latest data, DirectQuery may be best.
However, using DirectQuery is only feasible when the underlying
data source can provide interactive queries, less than 5 seconds
for the typical aggregate query, and can handle the query load
that will be generated. Additionally, the list of limitations for the
use of DirectQuery should be considered carefully.
10
11.
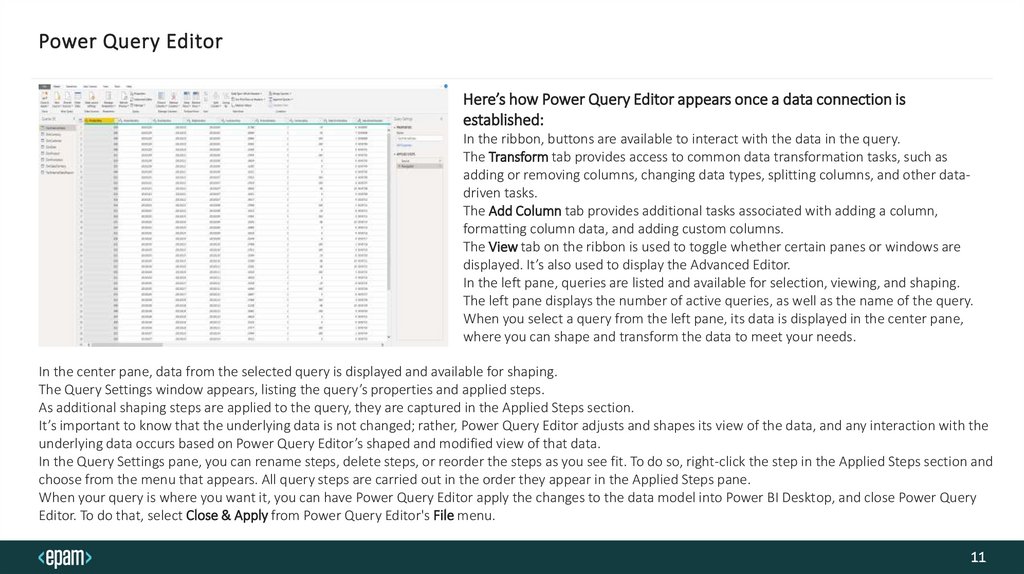
Power Query EditorHere’s how Power Query Editor appears once a data connection is
established:
In the ribbon, buttons are available to interact with the data in the query.
The Transform tab provides access to common data transformation tasks, such as
adding or removing columns, changing data types, splitting columns, and other datadriven tasks.
The Add Column tab provides additional tasks associated with adding a column,
formatting column data, and adding custom columns.
The View tab on the ribbon is used to toggle whether certain panes or windows are
displayed. It’s also used to display the Advanced Editor.
In the left pane, queries are listed and available for selection, viewing, and shaping.
The left pane displays the number of active queries, as well as the name of the query.
When you select a query from the left pane, its data is displayed in the center pane,
where you can shape and transform the data to meet your needs.
In the center pane, data from the selected query is displayed and available for shaping.
The Query Settings window appears, listing the query’s properties and applied steps.
As additional shaping steps are applied to the query, they are captured in the Applied Steps section.
It’s important to know that the underlying data is not changed; rather, Power Query Editor adjusts and shapes its view of the data, and any interaction with the
underlying data occurs based on Power Query Editor’s shaped and modified view of that data.
In the Query Settings pane, you can rename steps, delete steps, or reorder the steps as you see fit. To do so, right-click the step in the Applied Steps section and
choose from the menu that appears. All query steps are carried out in the order they appear in the Applied Steps pane.
When your query is where you want it, you can have Power Query Editor apply the changes to the data model into Power BI Desktop, and close Power Query
Editor. To do that, select Close & Apply from Power Query Editor's File menu.
11
12.
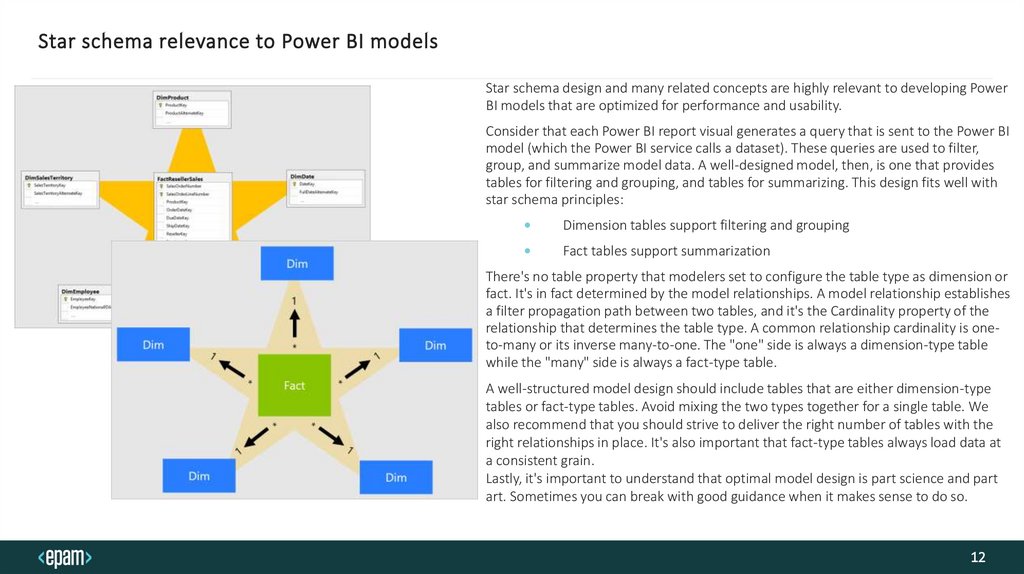
Star schema relevance to Power BI modelsStar schema design and many related concepts are highly relevant to developing Power
BI models that are optimized for performance and usability.
Consider that each Power BI report visual generates a query that is sent to the Power BI
model (which the Power BI service calls a dataset). These queries are used to filter,
group, and summarize model data. A well-designed model, then, is one that provides
tables for filtering and grouping, and tables for summarizing. This design fits well with
star schema principles:
Dimension tables support filtering and grouping
Fact tables support summarization
There's no table property that modelers set to configure the table type as dimension or
fact. It's in fact determined by the model relationships. A model relationship establishes
a filter propagation path between two tables, and it's the Cardinality property of the
relationship that determines the table type. A common relationship cardinality is oneto-many or its inverse many-to-one. The "one" side is always a dimension-type table
while the "many" side is always a fact-type table.
A well-structured model design should include tables that are either dimension-type
tables or fact-type tables. Avoid mixing the two types together for a single table. We
also recommend that you should strive to deliver the right number of tables with the
right relationships in place. It's also important that fact-type tables always load data at
a consistent grain.
Lastly, it's important to understand that optimal model design is part science and part
art. Sometimes you can break with good guidance when it makes sense to do so.
12
13.
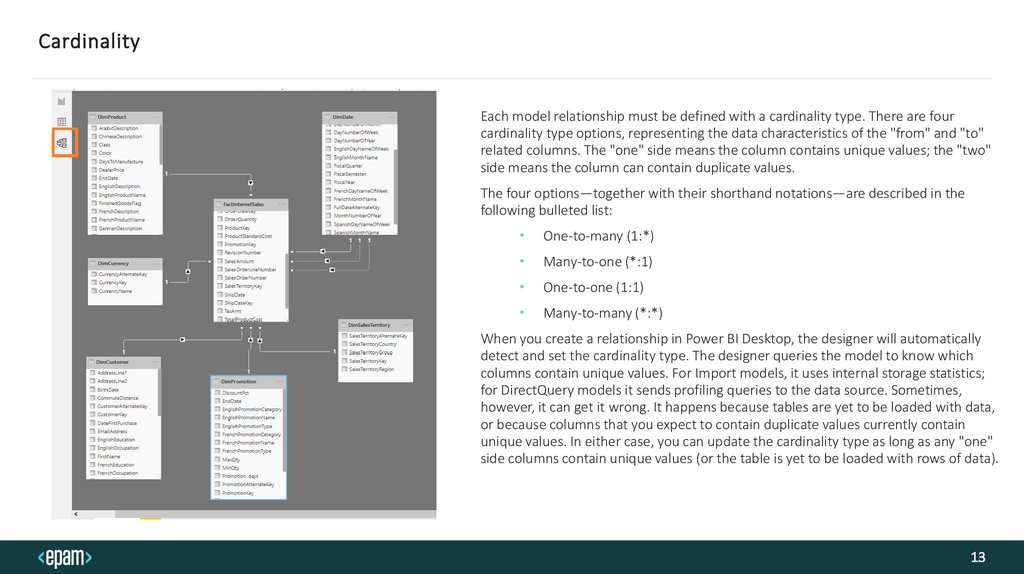
CardinalityEach model relationship must be defined with a cardinality type. There are four
cardinality type options, representing the data characteristics of the "from" and "to"
related columns. The "one" side means the column contains unique values; the "two"
side means the column can contain duplicate values.
The four options—together with their shorthand notations—are described in the
following bulleted list:
One-to-many (1:*)
Many-to-one (*:1)
One-to-one (1:1)
Many-to-many (*:*)
When you create a relationship in Power BI Desktop, the designer will automatically
detect and set the cardinality type. The designer queries the model to know which
columns contain unique values. For Import models, it uses internal storage statistics;
for DirectQuery models it sends profiling queries to the data source. Sometimes,
however, it can get it wrong. It happens because tables are yet to be loaded with data,
or because columns that you expect to contain duplicate values currently contain
unique values. In either case, you can update the cardinality type as long as any "one"
side columns contain unique values (or the table is yet to be loaded with rows of data).
13
14.
Power BI Report EditorThe Power BI report editor is divided into
several main sections:
1. Top nav pane
2. Report canvas
3. Filters pane
4. Visualizations pane
5. Fields pane
14